
I want to go over how to calculate dynamic profit margins in Power BI. You may watch the full video of this tutorial at the bottom of this blog.
This is something I consider to be quite straightforward if you’ve been using Power BI for some time. But if you’re just starting out, this could be challenging to piece together.
This kind of information is something that most organizations need. Once you learn how to get dynamic product margins, you can drill down into that data and get even better insights.

Getting The Total Profits
When you’re trying to calculate the sales or revenue for an organization, your model would usually look like this, which uses the waterfall technique that I’ve talked about in previous tutorials.

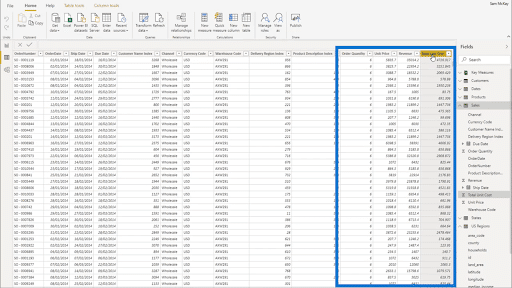
Now, within your Sales table, you usually have basic revenue information like the quantity, unit price and unit cost.
Since we don’t have the data needed to jump straight into your profit margin, we’re going to do some measure branching here. This means we’re going to start with simple measures, then start building it up from there.
Our table already has the revenue, which we computed by getting the SUM of our Total Sales.
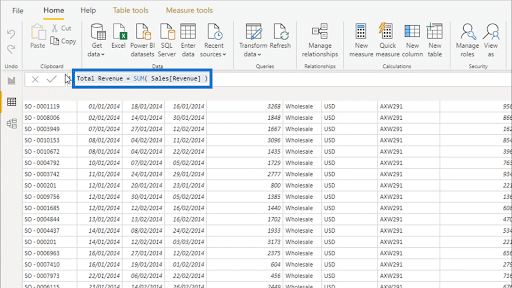
To get the Profit Margin, we want to divide the Total Profits by Total Revenue. We already have the Total Revenue, so we’re going to compute for the Total Profit.
Of course, we don’t have Total Profits in your table, either. We also have our Total Unit Costs, but we need the overall costs, which we can get by multiplying the Order Quantity by the Total Unit Cost.


To do that, we’re going to jump back into our report and create a new measure.
Some of you may want to create a Quick Measure, but I don’t recommend it. It’s always best to stick to simple measures.
I’m going to call this Total Costs and I’m going to use SUMX to calculate for it. So I’m using my Sales table then the Order Quantity.

Add that to the table, and we’ll have Total Revenue and Total Costs, both of which are dynamic.

Now that we have those two, we can start computing for the Total Profits by calculating the difference between Total Revenue and Total Costs.

Getting The Profit Margins
Once the Total Profits have been calculated, the next step is to get the Profit Margins. I’ll use DIVIDE for the Total Profits and Total Revenue. I’ll also add in a zero for alternative results.

Let me drag this measure into the table to show the corresponding Profit Margins for the data we already have.

Obviously, we would need that to be in percentage form. That’s something you can fix in Formatting inside your Measure Tools. In this case, let’s go for just one decimal place.

Now, you’ll see that your Profit Margins are in the proper format.

More Insights From Dynamic Profit Margins
Getting the Profit Margins is just the start. Once you have it, you can really dig deep and get better insights.
For example, we can do some conditional formatting to change the background color of your Profit Margins based on whether they’re among the highest or the lowest.

Your data will now look like this.

Once that formatting is in place, you can sort through the data either from highest to lowest or vice versa.

Now, let’s do some visualizations to get even more insights. You won’t need any of these intermediary calculations, so you can get rid of them.

Now, you’ll only have your Profit Margins in place.


From there, you can create a bar chart to properly visualize the data.

Here’s the problem. There’s too much data here, so it seems like all the names on your chart have the same numbers.
There’s an easy solution for this. I have talked about grouping techniques in past tutorials as well.
In this case, you can apply those grouping techniques. For example, instead of having individual customers, you can segment them into groups. You can group customers with the 50% to 60% profit margin, for instance. This will greatly improve the visualization.
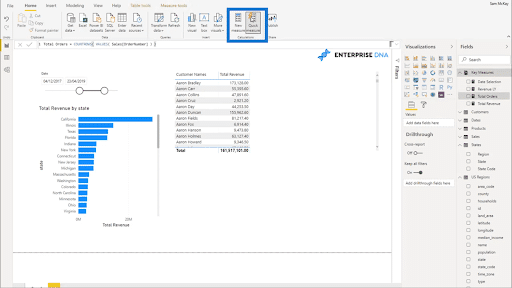
Aside from looking at individual customers, you can also check your Profit Margins per state.

This is the huge advantage that you have when your results are dynamic. You can change any filters that go into your model. You can even choose to see only the top 5 states here, or the bottom 5.
***** Related Links *****
Calculating Percent Profit Margins Using DAX In Power BI
Analyze Profit Margin Changes Overtime – Analytics with Power BI and DAX
Calculating Profit Leakage Using Power BI Analytics
Conclusion
These are some great DAX techniques that you could potentially use. These insights into Profit Margins are applicable across different scenarios and organizations.
Even better, you can replicate these techniques in your own Power BI reports even if you’re not dealing with Profit Margins. It’s just a matter of having an understanding of simple DAX formulas and measure branching.
The techniques that you see here are reusable in any sort of calculation as long as the circumstances are the same. You can even mix this technique with others where applicable.
All the best,
Sam


