In this tutorial, I’m going to show you how to calculate a dynamic Rolling Average in Power BI using the ALLSELECTED function. You may watch the full video of this tutorial at the bottom of this blog.
Rolling Averages can give you valuable insights into a variety of data, especially in Sales.
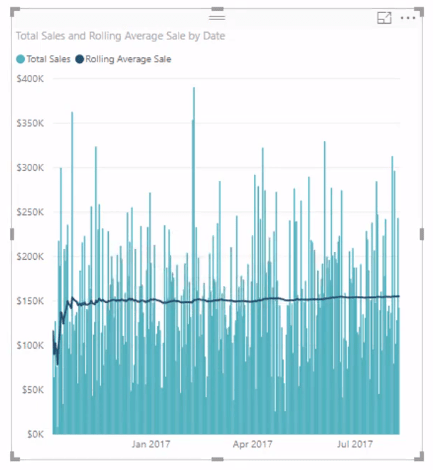
This dashboard shows how many sales are made per day and the amount of revenue earned

There’s a lot more volatility within the short-term period, but it eventually evens out in the long-term. It becomes a static line because the Average has more dates to work with over time.
This unique insight that you can get using Rolling Averages can hold a lot of value to certain scenarios.
Understanding The Formula Logic
Let’s go to the example.
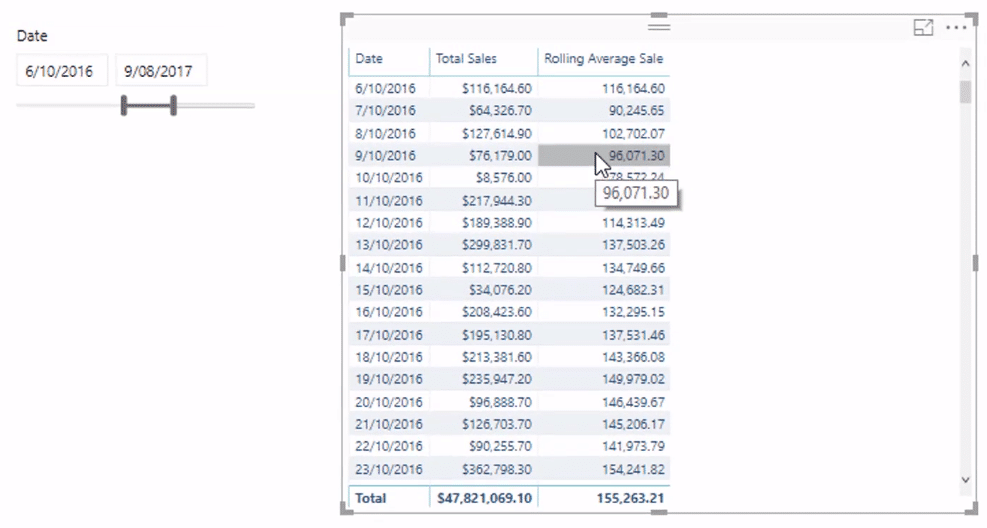
First, I’m going to set up my dates and turn it into a slicer. Then, I’ll create a table containing the Dates and Total Sales.

The table now shows Sales per day.
Getting your measures into table makes it easier to see what’s going on in the calculations.
I’m going to calculate a Rolling Average through time which updates automatically based on the selected time frame.
So, let’s go to the calculation.
This is the formula for the Rolling Average Sale:

Now, what you want to achieve is to be able to dynamically look back on every single Sales per day prior to a certain day and get their average.

And as you move down to the other rows, you need to create this time window endlessly. So, the time window essentially expands for every day as you go down the list in the table.
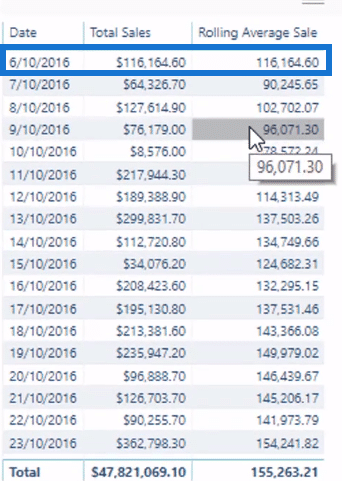
In the table you can see that the Rolling Average on the first day is the same as the Total Sales.

This is because there’s no previous value. The Total Sales will always have the same value as the Rolling Average during the first day.
But on the second day, it becomes the average of the first two days. On the third day, it’s the average of the first three days, and so on. This continues until the last row in the table.
DAX Functions In The Formula
This is the key part of the formula:

This opens up the specific time window. It works through every single date in the current selected context. This is what the ALLSELECTED function does.
Then, it works out if the Date is less than or equal to the MAX Date. The MAX Date is always the current date as you go down the list in the table. It works out which days evaluate to TRUE.
If they do evaluate to TRUE then it will generate the table that it’s going to iterate through.
For all those Dates that evaluate to TRUE, the formula calculates the Average of those Dates. So, you get every single result using the same calculation. The time window just becomes larger because you’re looking across a larger range of Dates.
The great thing about this calculation is it’s also dynamic because of the ALLSELECTED function.
In the chart, you can see that the dark blue line shows a big change from the start which then eventually evens out over time.

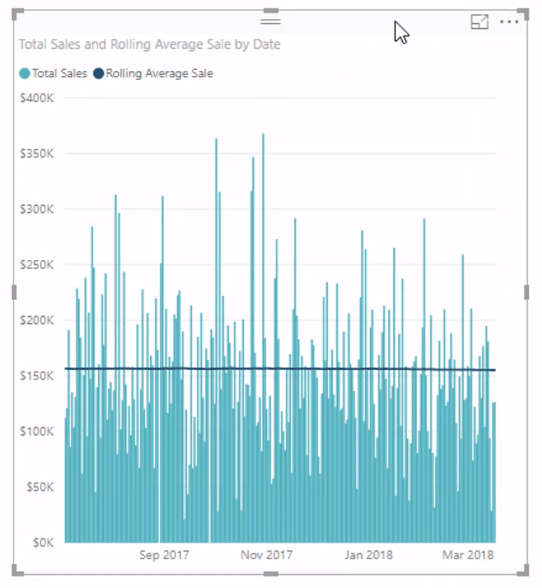
And if you change the date range, it will continue to show the similar trend.

The Average starts high but then evens out over time.
ALLSELECTED Vs ALL Function For Rolling Averages
When calculating a Rolling Average, use ALLSELECTED instead of using ALL.
Using the ALL function in the formula would give you weird results.

Here’s an example.

You can see the chart shows odd numbers. It also has a different y-axis. Making both of the axis start at 0 and adjusting the End value of the chart will give you a result with a flat line.
This happens because it’s working across every single day through time. The date selection is not being taken into account. It’s going back to the beginning of time.
That’s why ALLSELECTED is key.
***** Related Links *****
Running Totals In Power BI: How To Calculate Using DAX Formula
DAX Calculations: Total Of Average Results
Using Moving Averages To Show Trends In Power BI
Conclusion
The dynamic Rolling Average calculation in Power BI isn’t that difficult. It simply requires an understanding on what you can do with iterating functions and virtual tables.
This technique has many unique uses which you can apply across a wide range of scenarios.
Hopefully, you learned a lot about the logic behind how the dynamic Rolling Average works.
Talk to you soon,
Sam


