
Here I’m going to show you how you can calculate the amount sold between two different dates using the DATESBETWEEN function in Power BI. You may watch the full video of this tutorial at the bottom of this blog.
Another way to think about this is calculating rolling sales or running totals.
We need the calculation to be dynamic, so that as we move through time, we have a number that re-calculates based on the time frame window that we open.

In this blog, I show you how on any single day, you can isolate two dates and count up the amount sold between those two dates. This is ultimately how you calculate running totals in Power BI.
I’m going to dive in how you can do that with DAX formula, specifically the DATESBETWEEN function in Power BI. I’m not going to stop there, as I also want to compare running totals between different time periods.
Rolling Totals Using The DATESBETWEEN Function
There are a couple of ways that you could do this, but in this tutorial, I want to showcase how to use the Power BI DATESBETWEEN function.
This time intelligence function is incredibly flexible in terms of the logic you can put inside it to then create or calculate quickly a time-related calculation in a very unique situation.
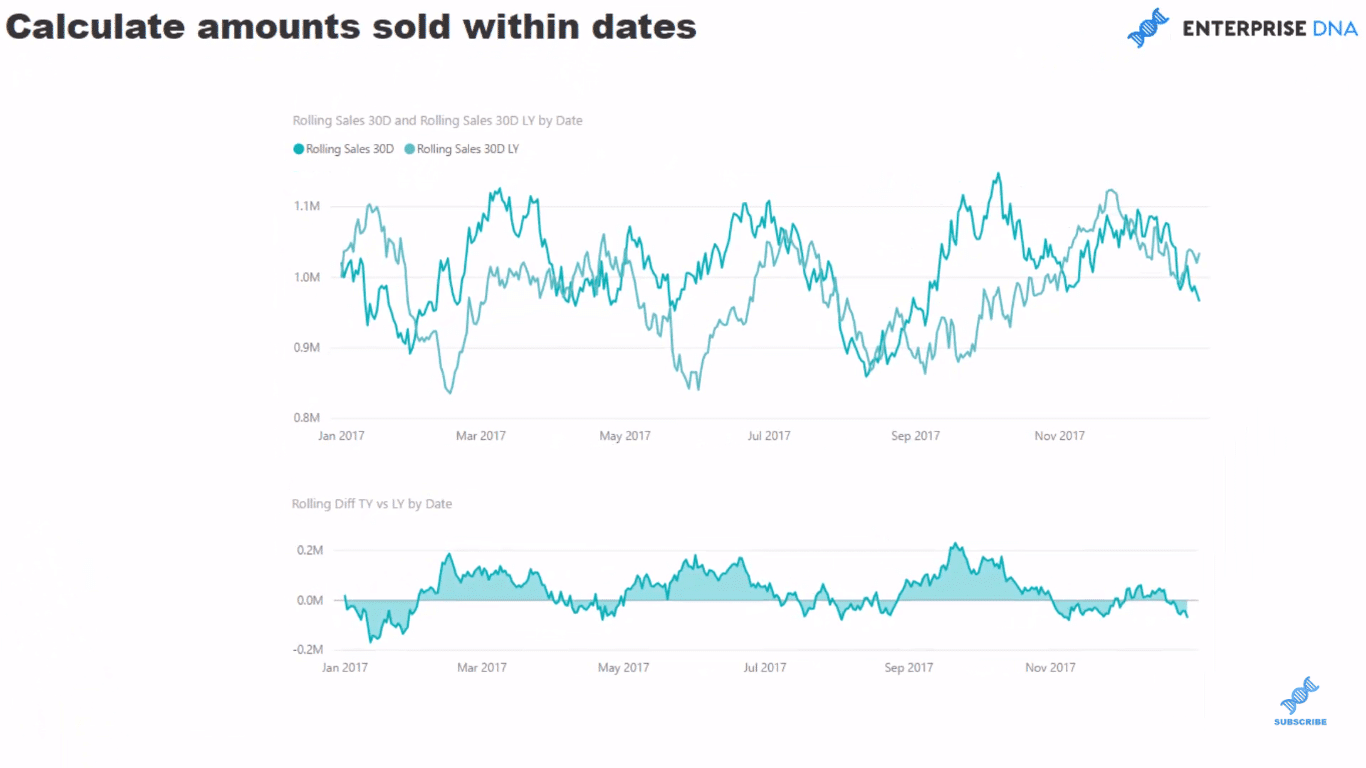
In this example, we are looking at rolling sales of the current year, and then we compare it to the previous year. The darker green line shows the rolling sales with 30 days, and we’re comparing that to the year before.
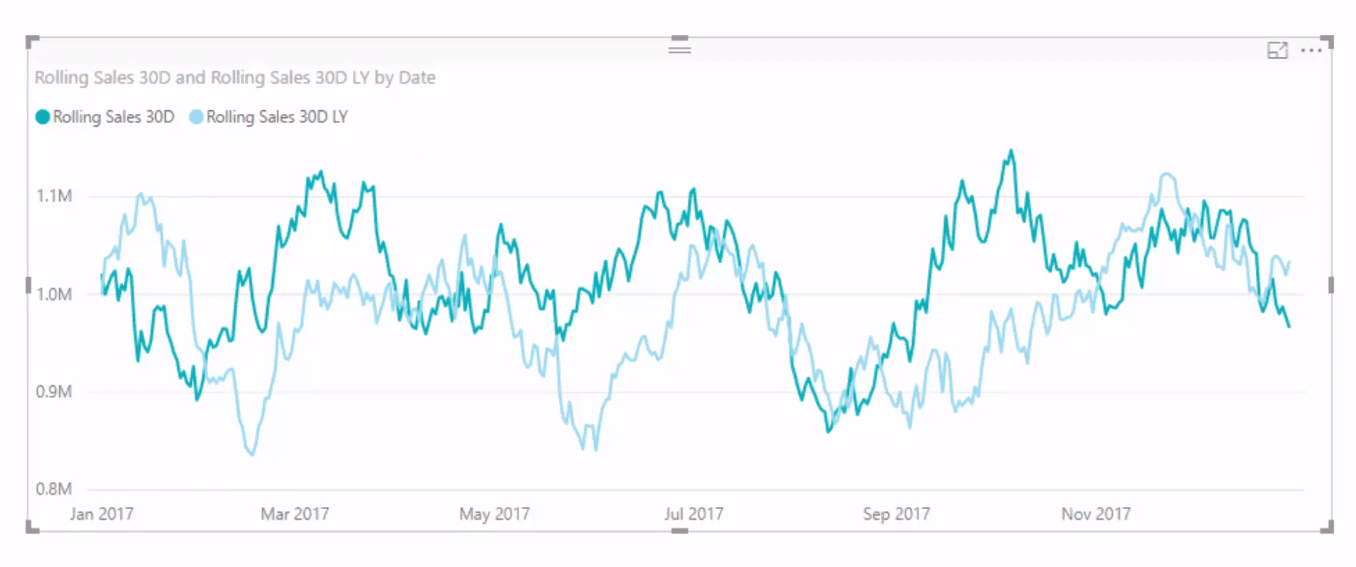
This would be perfect if you wanted to identify trends, for example, or inventory because inventory levels are a really good one to use for rolling calculations.
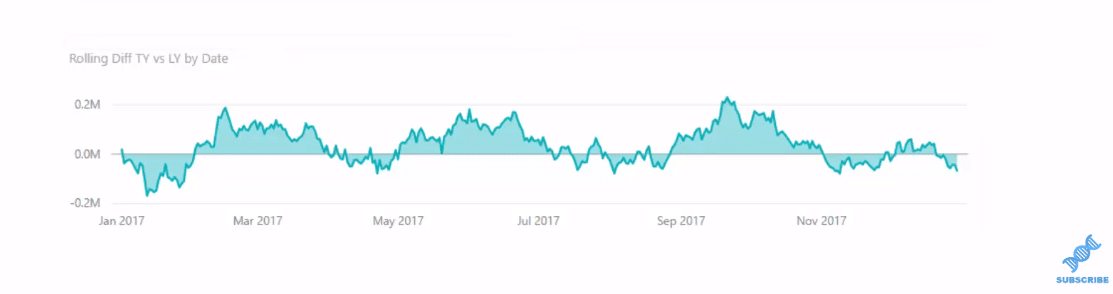
On this table below, you see that we’ve branched out and determined the difference. If you could identify quite a big difference in the trend here, then that would certainly tell you something, and perhaps will help you in your business decisions.

Now how I did this is the key to achieving these insights.
Calculations Using DATESBETWEEN
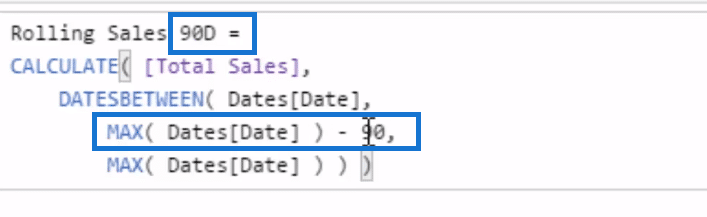
In this technique, we place the DATESBETWEEN inside a CALCULATE statement, but we have two parameters here that we can work with. First, we put in the Dates column just to recognize what columns look down.
Then, by these two parameters (MAX Dates), we can actually create any two dates or any time period between these two dates that we want. In other words, we could put absolutely anything in here.
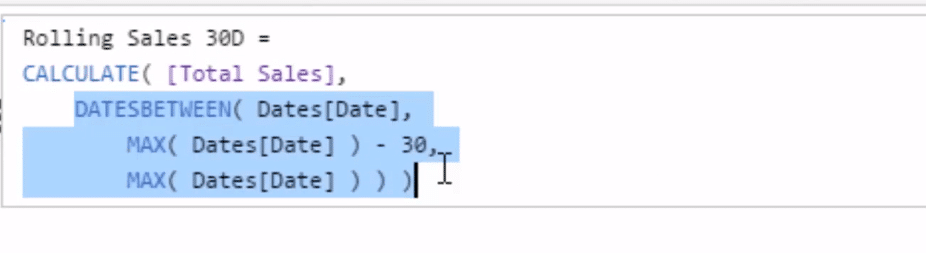
Here, the MAX (function) Dates brings up the current date minus 30 (days, as we have set here). It opens up a 30-day window every day, and looking from today backwards for 30 days, then counting up total sales.
So with this formula using the DATESBETWEEN function in calculating 30-day sales, what we’re doing is that we start from today and open up every single day back 30 days, and then just sum up the total.
Furthermore, with this formula, we could go easily into something else, say rolling 90 days instead of 30. All we have to do is change a few parameters here. Then, we can branch out into different time-frame calculations for this technique.
Now let’s look at another formula that uses DATESBETWEEN, which allows us to calculate the cumulative sales quarterly.
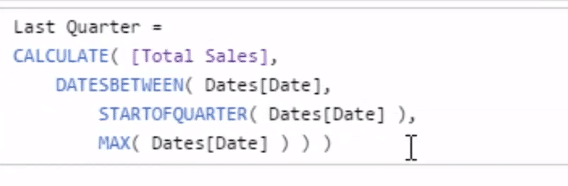
This might be a bit complicated for something that can be done easily, but I just want to show you that we can actually put anything in this formula. We can put FIRST NONBLANK or LAST NONBLANK, or anything that returns a date. And then, open up or create a date window or a time frame to calculate whatever core measure we want to, in this case, it’s Total Sales.
***** Related Links *****
How To Calculate A Cumulative Run Rate In Power BI Using DAX
Running Totals in Power BI: How To Calculate Using DAX Formula
Time Intelligence In Power BI: How to Calculate The Number of Transactions Made in the Last N Days
Conclusion
I hope that with this tutorial, you become familiar with the DATESBETWEEN function in Power BI because there’s a lot of really great applications for it.
What we’re doing in DATESBETWEEN is that we are creating a context between any two dates that we specify. There’s a variety of different applications of any calculation that we might want to do between two dates.
This is a great way to identify trends in your data or showcase outliers that may be occurring in real time in your datasets.
There are lots of techniques to extract out of this one tutorial, as well as plenty to learn about the DAX formula and how to implement it successfully. Jump in and learn as much as you can. Try to implement this in your own models ASAP to really get the most benefit out of it.
All the best,
Sam


