
In today’s blog post, I want to discuss how you can build additional data dimensions in Power BI.
These dimensions can help you filter your data in different ways. On top of that, these dimensions can help you come up with intuitive visualizations later on.
This is also the reason why you need to set up your data model in the best possible way. As I have mentioned in the previous tutorials, you should separate the lookup tables and the fact tables. This way, you can set up additional data dimensions when needed.

Adding Additional Data Dimensions
Now, I want to show you the scenarios where you need to add other dimensions.
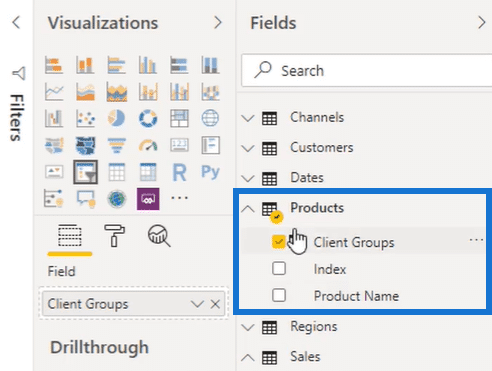
First, I have this Product Name column in the Products table. The products listed here are filtered by their product names.
However, there will be times when you want to group the products based on revenue or margins. Because of that, you need to add a new column and place it in a table. This is where you need to create additional dimensions that you can use to run intermediary calculations.
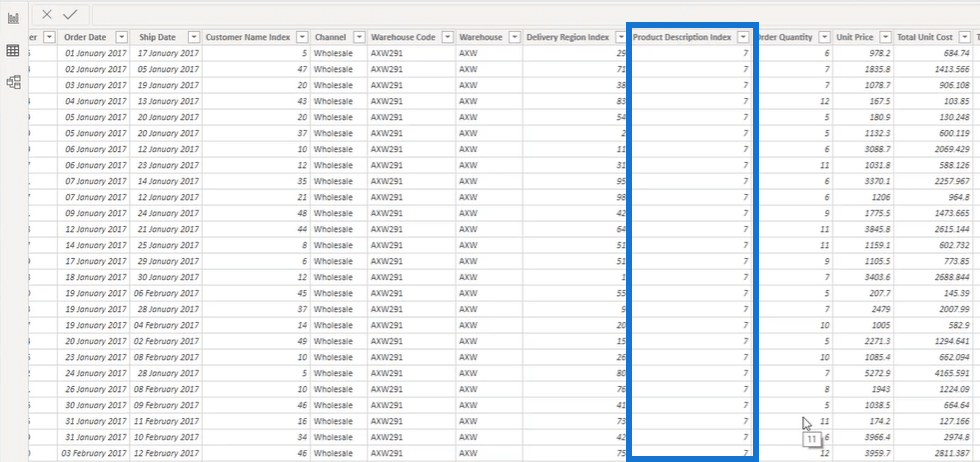
If you look at the table more closely, you can see that the only product-related column is the Product Description Index.
Therefore, you need to manually build the additional data that you need to calculate for total revenue. To do that, click the Modeling ribbon, and then click New Column.
After that, you should name it as Product Sales. This column will show the total revenue for each product under the Product Name column.

Now that you have the total revenue, you need to add another dimension for the product groupings.
Again, click New Column and name it as Client Groups. For this calculation, you need to use the SWITCH (TRUE) function. This function helps you determine automatically whether the product sales are greater than 10 million or not.
If the sales are greater than 10 million, you can classify them as Good Clients. If the sales are less than or equal to 10 million, you can classify them as Ok Clients.
Lastly, add BLANK in the last part to close the formula.
Since you have created the Client Groups column, you can now create a relationship to the Sales table.
You can now filter any calculation using the additional dimensions in the Products table. Without them, you will need to run your calculation using the thousands of rows in the Sales table.
Additional columns are important because they help you do more efficient calculations. They can also speed up Power BI’s performance compared to doing a calculation inside a huge table.
Dealing With Other Data Dimensions
Another way to deal with your dimensions is to hide irrelevant columns in the report view.
You can hide any column when you right-click and then select Hide in report view.
In this example, you need to hide the Product Sales table because you only need to show the different client groups in your report. You should also hide the Index column because it’s not relevant in the report for client groups.
In the report view, you only have to show the Good Clients and Ok Clients data. This means you’ll have to utilize the Client Groups column as a filter and slicer.
In the Client Groups slicer, you can make the report dynamic by selecting either Good Clients or Ok Clients.
Since the other columns are hidden, you can’t see it in the report view.
The hidden Index and Products column were only useful in creating the relationship for the other data dimensions, but it’s irrelevant to show them in the visualization.
You can apply this technique to other similar scenarios that you will encounter when creating visualizations.

***** Related Links *****
How To Use SWITCH True Logic In Power BI
How To Create Dynamic Lists of Dimensions using DAX in Power BI
Power BI Data Model For Advanced Scenario Analysis Using DAX
Conclusion
I have discussed a number of data modelling techniques that are important. I hope you get to master these techniques and apply them every time you work inside the data model area.
As I’ve said before, you need to build your data model in the best way possible so you won’t have any problems when doing your calculations.
Cheers!
Sam


