Today, I’m going to introduce the amazing things that you can do with the basket analysis technique. With Basket Analysis inside Power BI, you can try to analyze the customer sales of one grouping of products versus another grouping of products. You may watch the full video of this tutorial at the bottom of this blog
There’s plenty of application for this across Power BI. But for this tutorial, I want to share with you the best practices in using this type of technique.
By running this type of analysis, we can work out sales trends or purchasing behavior of the customers who are buying from us or in our stores.
By knowing and understanding these patterns we can manage many aspects of the sales process better. For example, better stock management, up-sell opportunities, more targeted marketing, and much more.
In this basket analysis, I’m basically trying to show the customers who purchased a certain group of products. And then, I’ll try to see if they have also purchased another group of products.
The results would be very helpful when you want to run a feature analysis around those customers who bought one group of products and not the other. Then, you can follow them up with some effective marketing and advertising.
Power BI Model For Basket Analysis
First of all, I’m going to jump to my model because this is where we can find the most essential way of getting the basket analysis right. A big tip when you’re running this type of analysis is that integrating selections like these baskets into your core model is a complicated way to do it.
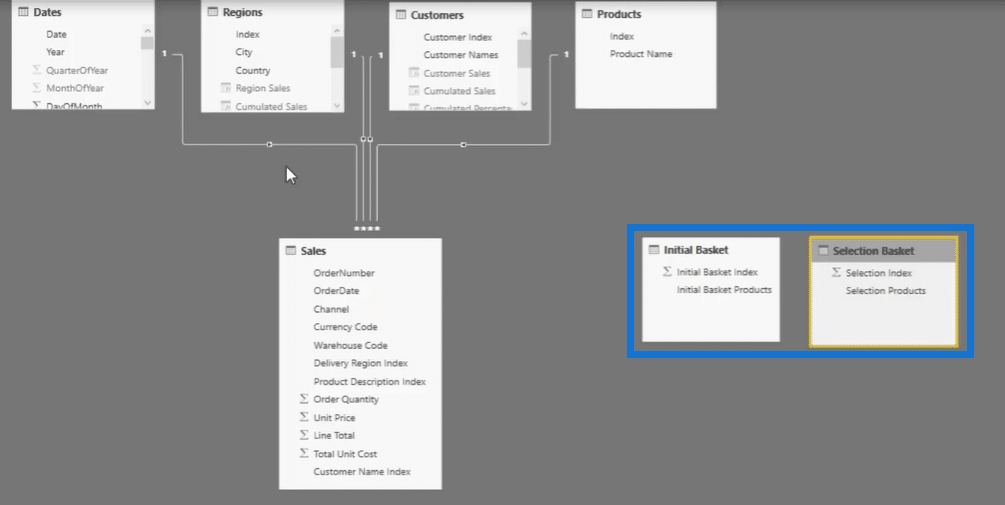
Take a look at my core model which is a very simple one.

Going back to my data, I replicated a very simple Products table. I just created two tables that are exactly the same, but with different titles. One is called the Initial Basket.

The second one is called the Selection Basket.

These baskets are what I call supporting tables. If you look at my model, these tables don’t have a relationship to any other tables.

I’m just going to integrate calculations from these tables into the core model. But it has to be done through a formula, not through relationships. Personally, I think doing this makes everything a lot easier and cleaner than over-complicating the relationships.
That’s one of my best practice tips for basket analysis. Create these baskets separately and use them as supporting tables to the side of the core model. Now let’s take a look at the formulas or calculations that I made and integrated into the tables.
Showcasing The Basket Customers
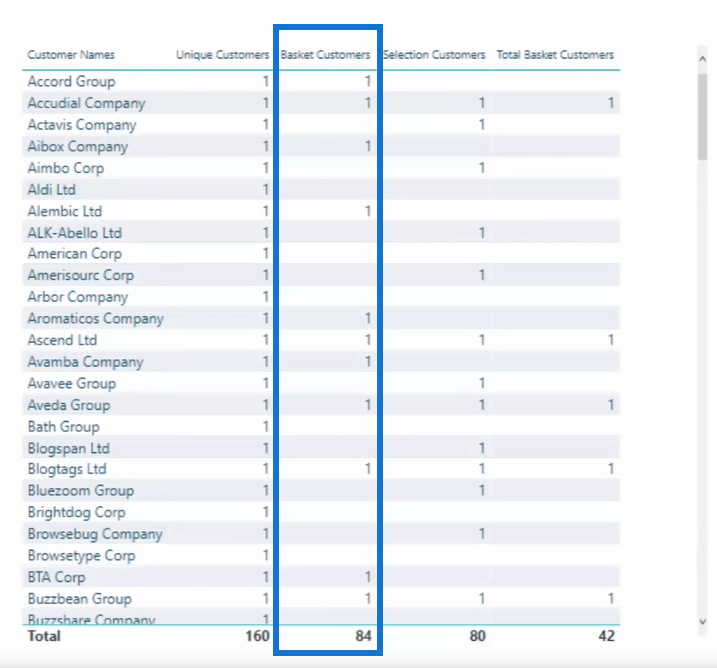
As you can see, I have named the baskets differently in the table. It’s now Initial Basket Products and Selection Products, then I can multi-select the products here as I put them inside a slicer.

After that, I’ve run some calculations for Unique Customers using the formula below.

Basically, I just run the DISTINCTCOUNT function of the Sales by each Customer’s name.
The Basket Customers column is where it starts to get a little tricky. This one calculates how many customers bought the particular grouping of products that I’ve selected under the Initial Basket slicer.

Since the table doesn’t have any relationship to the sales table where all the transactions are found, I need to use the formula below.

As I’m calculating the unique customers, I’m also applying a different relationship or context inside using the TREATAS function. It allows me to create a virtual relationship between the initial basket and Initial Basket Index as well as the Product Description Index in the corresponding sales.
Moreover, for the Selection Customers column, I just have to do the same thing and use exactly the same pattern. But this time, it’s evaluating a different subset of products based on my selection.

Identifying The Total Number Of Basket Customers
Now, I’m getting into the most essential basket analysis and this is where more advanced logic is needed in order to really compare the two baskets.
I want to compare all of the customers who purchased in the first set of basket to all of the customers who purchased in the second set of basket. That’s the reason why I’ve added the column for Total Basket Customers.
This is how I can do it here using this very advanced formula below.

The most important thing to consider here is that the TREATAS function is exactly the same as the previous calculation. But instead of creating scalar values, it’s going to create a virtual table using the CALCULATETABLE function.

So the formula is going to bring up a table for the customers based on the products selections I’ve made from the Initial Basket Products and Selection Products.
Then, I’ve used the INTERSECT function to evaluate which customers are part of the initial basket and are also included in the selected basket.

Finally, the COUNTROWS function finishes the job by returning the total count of customers present in both baskets.
Additional Tips and Techniques for Basket Analysis in Power BI
The great thing about this basket analysis technique is that you can actually reuse the formula when you want to bring a different context.
For example, I want to include the context for Country here; I just have to bring this to the table for a different visualization and add the Total Basket Customers formula inside the new visualization.

So now, I’m able to show the total number of basket customers for all these different countries. This is very much applicable in retail stores and it can be narrowed down into more specific regions or customer sets.
As you can see, there are so many ways of enhancing your basket analysis. This tutorial is only an introduction to the wonderful power of basket analysis.
***** Related Links *****
Basket Analysis Example – Power BI Advanced Analytics
Analysing Customer Trend Using DAX In Power BI
Using Moving Averages To Show Trends in Power BI
Conclusion
This is definitely worth diving into in great detail if this specific analysis is what you’re looking for or require in your own models.
This enables many high level insights where you can redistribute your resources or your funding into the most appropriate areas for your business.
Watch out for more in-depth sessions about basket analysis in the upcoming videos of Enterprise DNA. If you like to see more advanced analytical examples, you can certainly check out this module at Enterprise DNA Online – Advanced DAX Combinations.
Good luck with this one!
Sam
***** Learning Power BI? *****
FREE COURSE – Ultimate Beginners Guide To Power BI
FREE COURSE – Ultimate Beginners Guide To DAX
FREE – 60 Page DAX Reference Guide Download
FREE – Power BI Resources
Enterprise DNA Membership
Enterprise DNA Online
Enterprise DNA Events


