This Power BI Showcase focuses on bank risk analysis and the key factors to look for in a bank. These factors could be deposits, loans, interests, or floats. You may watch the full video of this tutorial at the bottom of this blog.
A float is the difference between the deposits and loans caused by delays in processing checks.
Ordinarily that would be in the bank’s equity fund. It could come from several different locations, and also be capitalized on a stock market.
Here are the reports under this showcase:
Client Summary
In this first report, we’re looking at the key banking relationships across different areas of the bank.
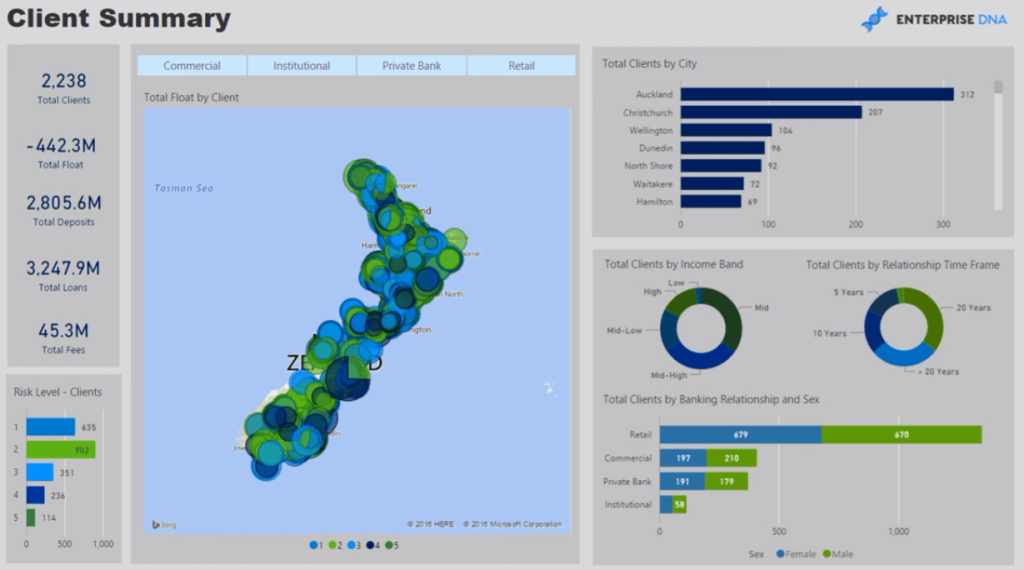
There’s commercial, institutional, private bank, and retail. With this, we’re able to quickly have a look at the current risk per region.
We’ve associated a risk weighting on each client, which would ordinarily be the case in a banking setting.
The credit department would then identify whether a person is a low credit risk or a high credit risk.
In this case, we’ve termed “high credit risks” as “5”.

By selecting a bank area and client, we can further dive into a detailed outlay of their status and associated risk.
In this example, we’ve selected the Commercial area and the clients based in Auckland.
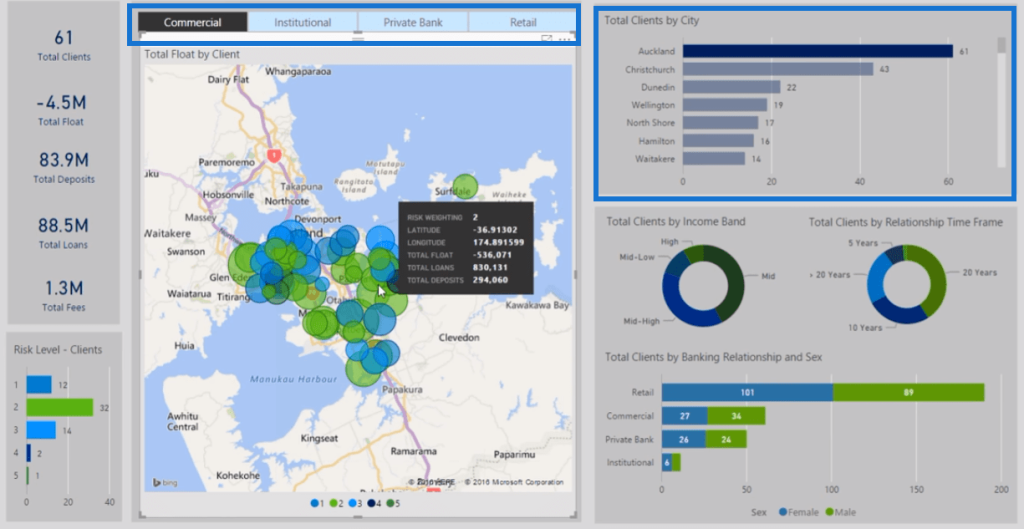
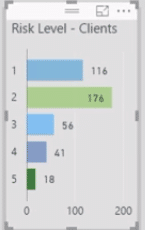
Most of the clients within this range have a risk weighting of level 2.
Clicking on the charts makes it easy to jump into the information of different countries or regions. Power BI dynamically gives us the data we need.
We can further dive into the information concerning our high-risk clients.
By zooming in on the map, we can easily monitor our clients’ business status.
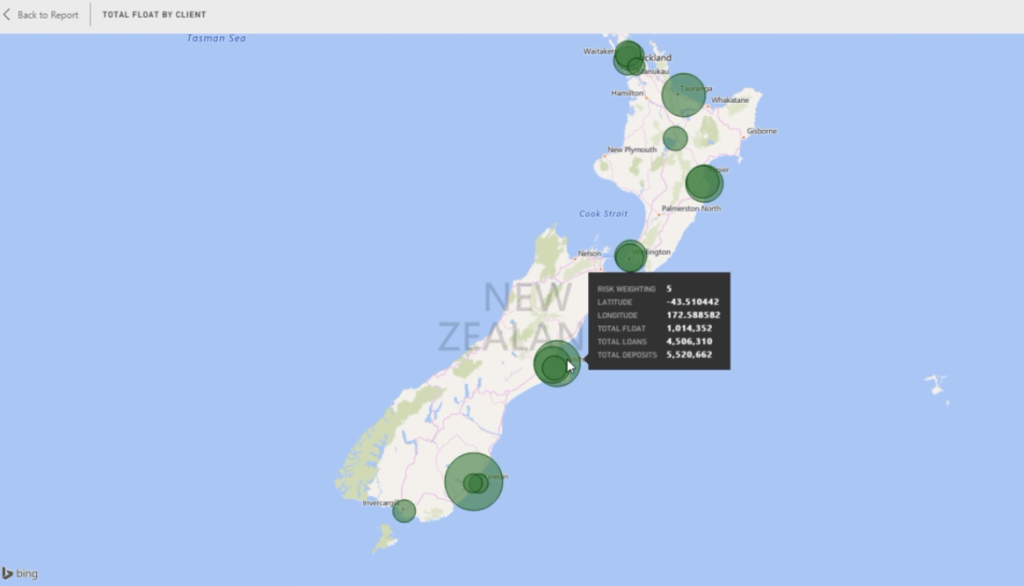
We can easily look at their financial information, such as, income, and assets. This is a great source of analysis for a commercial manager.
The quick snapshot we get from this report helps identify where we should be directing our resources to maximize our performance.
Client Details
The second report provides a more granular perspective on each client.
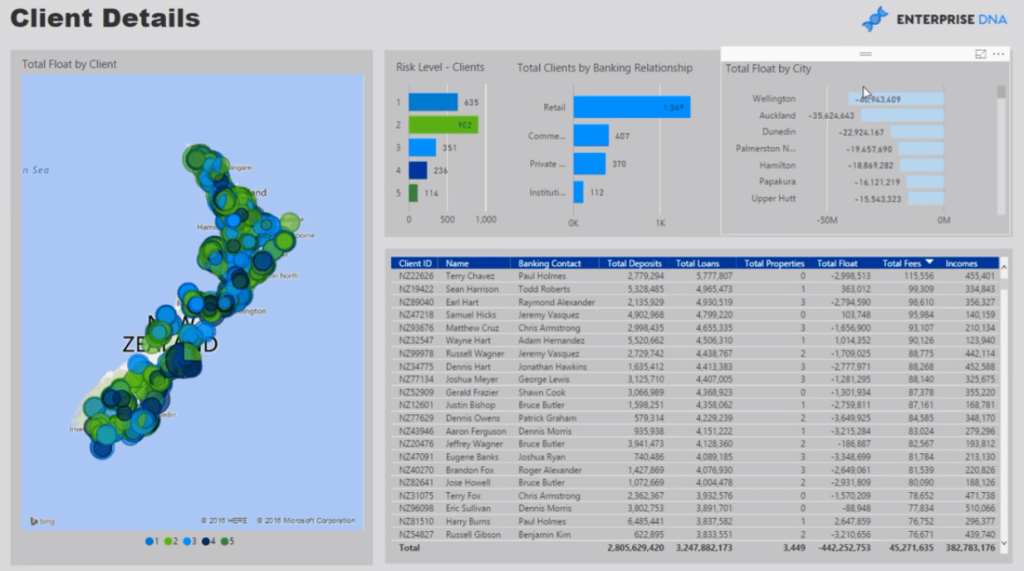
Similar to the previous report, we’re using 1-5 as a gauge of the different risk levels.
We can also see a simple summary of our banking relationship and float by city.

This gives us a breakdown of where we should allocate additional funding from the bank’s equity.
If we dive into a specific city, we quickly get a list of all the client details. This includes their Total Deposits, Loans, and Properties.
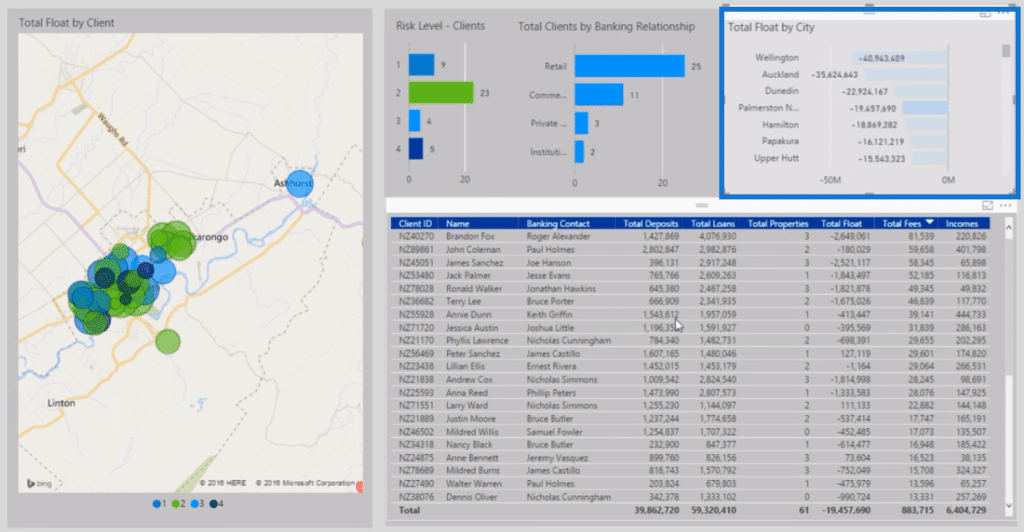
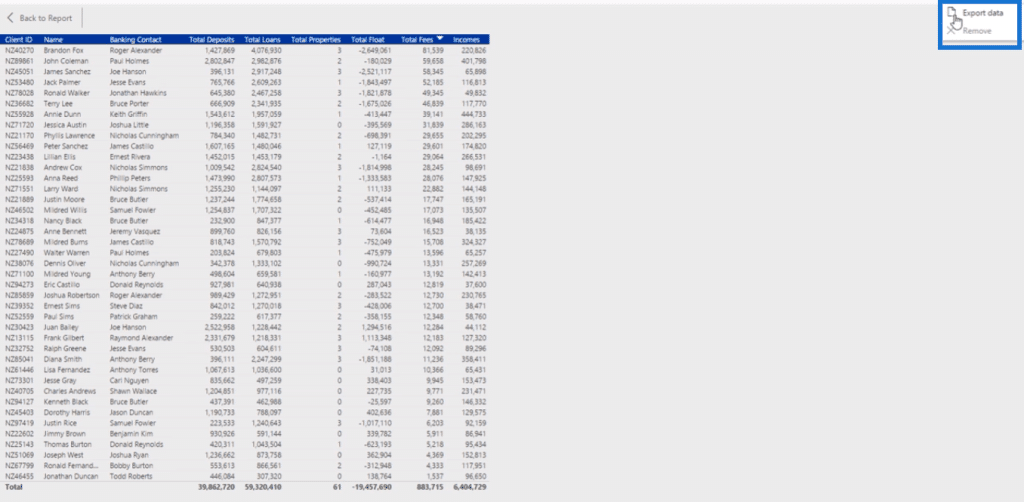
If we want to follow up on each client, we can easily export the data from Power BI to an external file.
Reports On Specific Key Business Areas
The next three reports give focus on each specific key business area.
1. Retail
This report focuses on Retail.
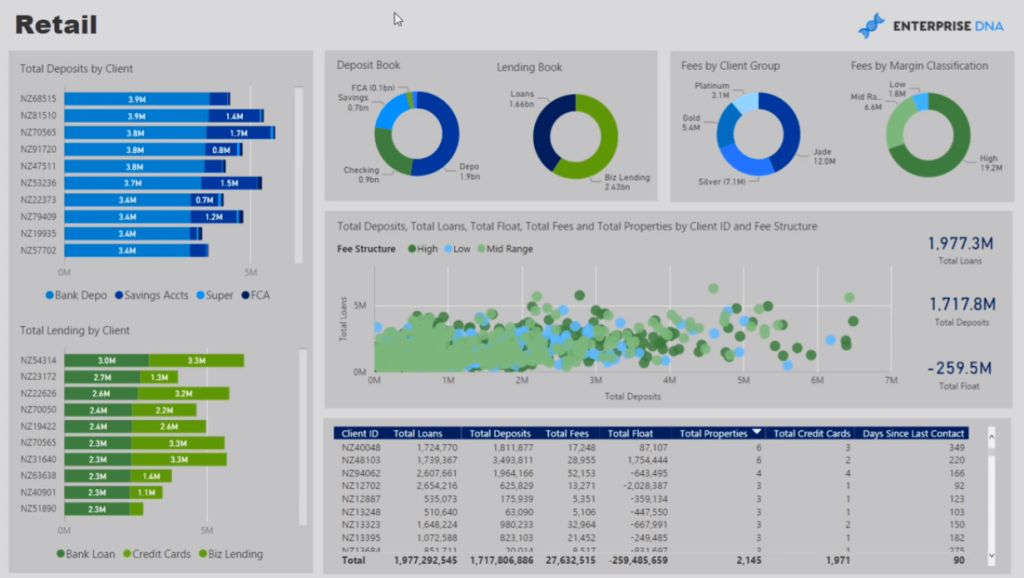
We can look at the breakdown of all the bank deposits by client, along with their loans.
In this chart, we get a good look at the cluster of our deposits versus loans.

We can click into each client or look at the data with a group perspective.
2. Commercial
This next report focuses on the Commercial area of the business.
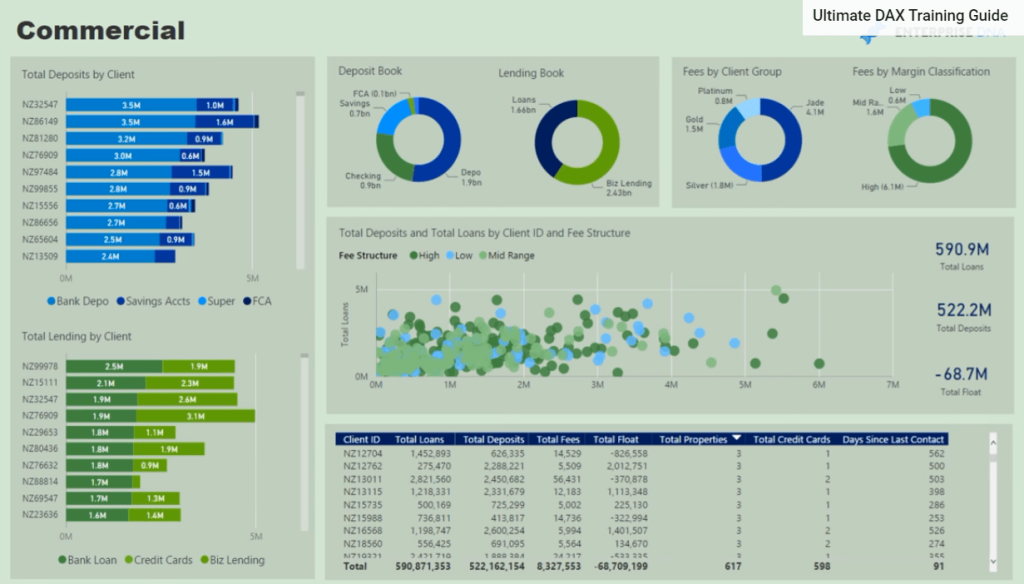
It has a similar layout to the previous report. This makes it easy to make comparisons between key business areas.
3. Institutional
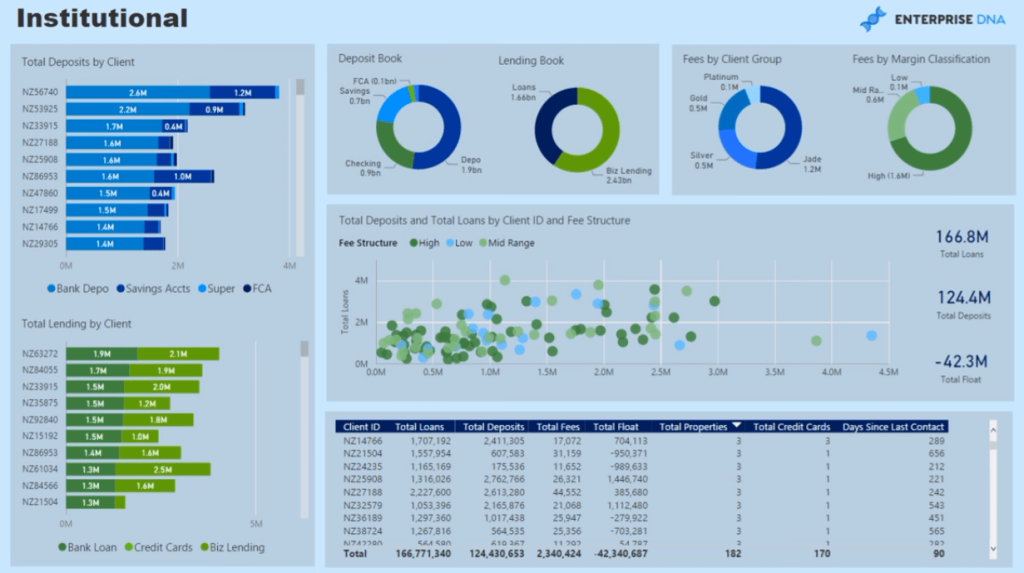
The last report in this showcase focuses on the Institutional area of the business.
***** Related Links *****
Dynamic Segmentation With Dynamic Parameters – Advanced Power BI & DAX Technique
Extracting Unique Insights In Power BI Using Ranking DAX Measures
Discover Where Your Profit Growth Comes From: A Power BI Tutorial
Conclusion
This bank risk analysis Power BI Showcase is a great guide for businesses that are closely involved in the banking industry.
Reports like these are reliable sources of information on the status of an organization’s deposits, loans, and floats which make it easier to perform in-depth bank risk analyses.
All the best,
Sam


