
I want to show here how incredible Power BI is as an analytical tool. I’ll teach you how to develop a Power BI data model for an advanced scenario analysis. You may watch the full video of this tutorial at the bottom of this blog.
With Power BI, we can achieve so much that we might never have thought possible.
Developing scenario analysis logic within a Power BI data model is probably my favorite technique to use, mainly because it can be so valuable to the business.
Rather than just looking back and reporting on historical information, what we can do with scenario analysis is almost predict the future. We can pull levers in our metrics and across our data and see how it impacts the final results. The opportunities become endless!

Almost any data set that explores information over time can use this technique or a form of the techniques that we’ll go through in this tutorial. We’ll also go into measure branching, how to use parameter tables, how to insert variables into measures, and much more.
Sample Scenario Analysis: Impact Of Price Change
In this tutorial, we’re going to analyze the impact of price changes on our total revenue. We’re going to set up our model, shock the prices of particular products, and then see its impact on the entire sales portfolio that we have.
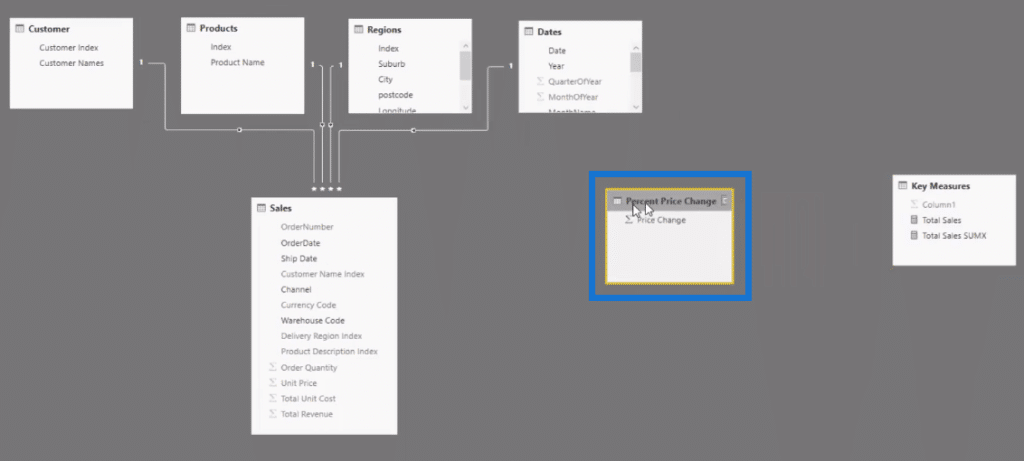
In our data model, we have our Customers, Products, Regions, Dates, and Sales.
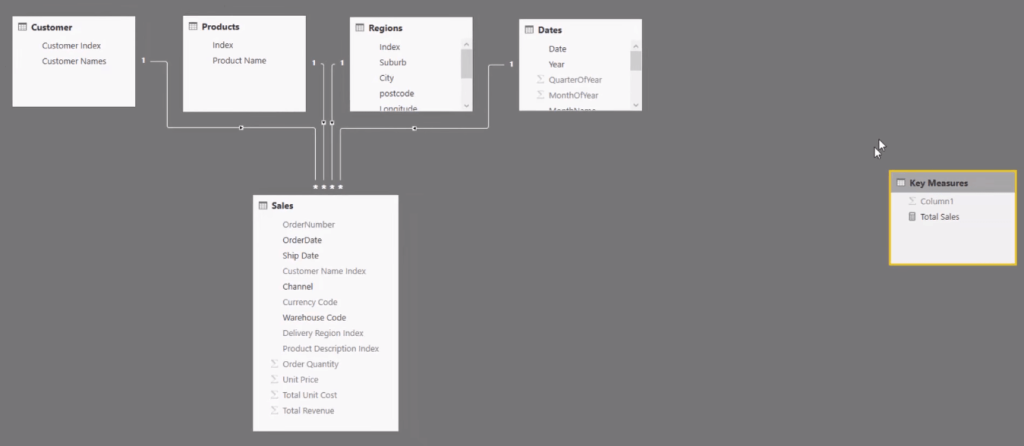
In our Sales table, which is a fact table, we have here our Unit Price.
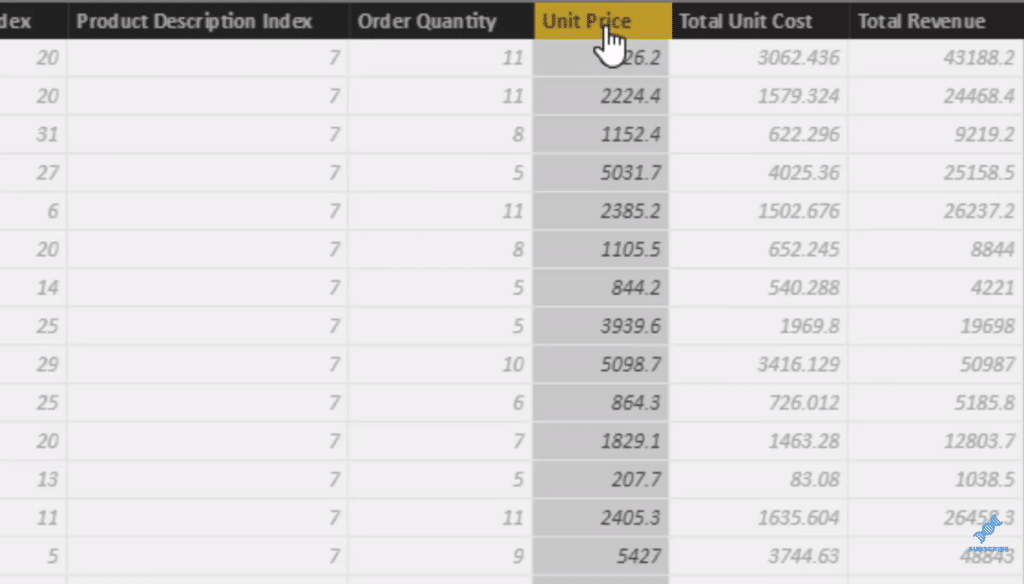
We need to isolate this Unit price, which gives us our Total Revenue and somehow shock it with a scenario. For instance, we want to increase our prices by 10% or 20% and we want to see the impact of the price change.
Total Sales With SUM vs Total Sales With SUMX
First, we look at our Key Measure here called Total Sales.


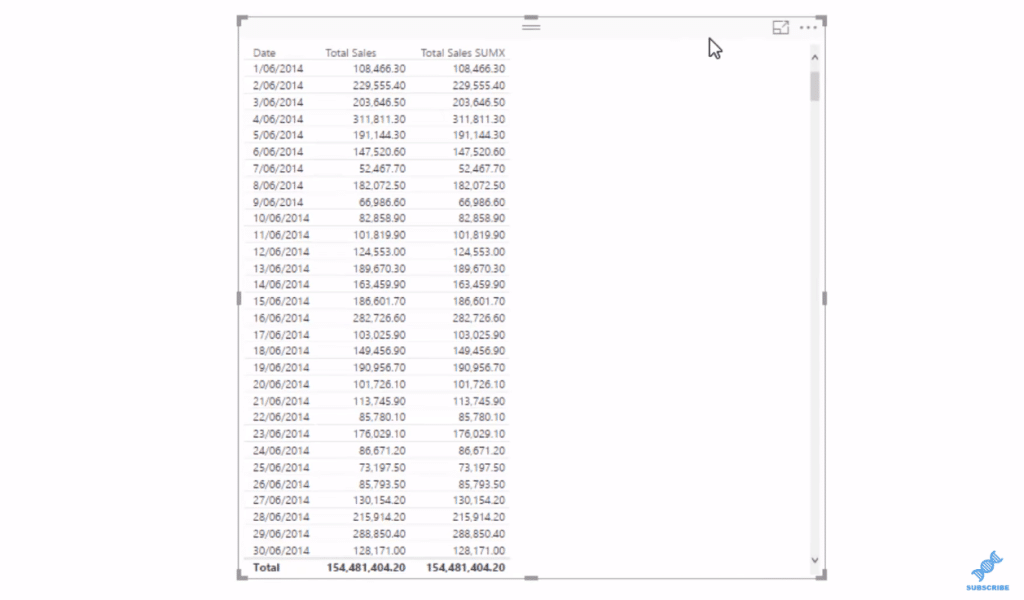
It’s a simple measure that just sums up the Total Revenue column and it’s not enough to run this analysis. Total Revenue has already taken into account this Unit Price. So we need to work out the Total Revenue but use the Order Quantity and the Unit Price, and we can do that by using SUMX.

This formula goes through the Sales table. For every row in the Sales table, it multiplies Order Quantity by the Unit Price for every row. We put this on a table with our Dates and we can see that we get exactly the same result, but it’s only calculating in a different way.
This Total Sales SUMX formula is where we’ll build our scenarios because we can isolate the Unit Price and we can now shock it. The next thing we need is the percentage change in price, which doesn’t exist in our data model, so we have to create it.
Creating A Supporting Table To Show Price Change Percentage
To create a new table, which will show the price changes, we go Enter Data and fill in the columns.
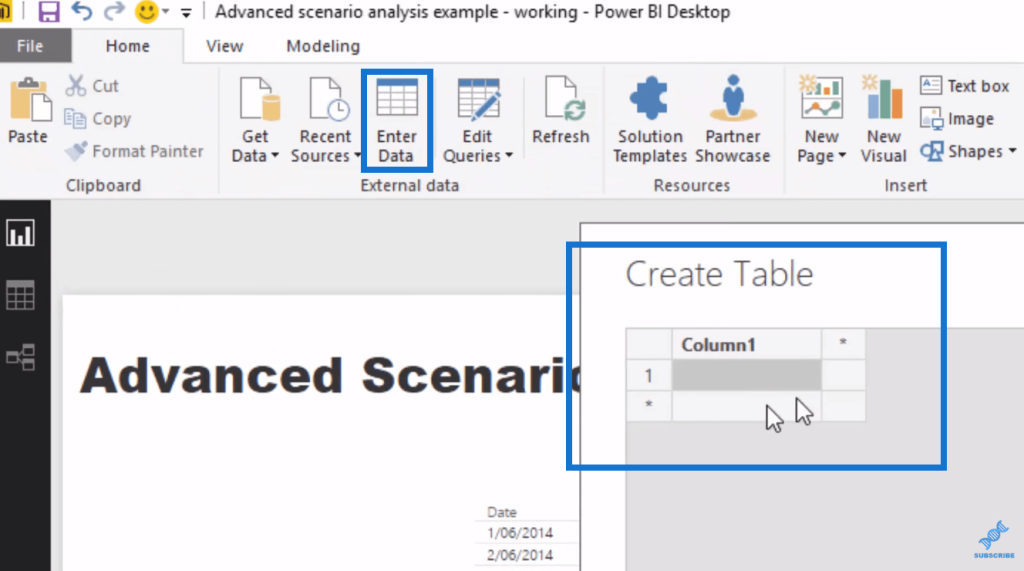
We enter the price changes that we want, such as 2%, 5%, 10%, etc.
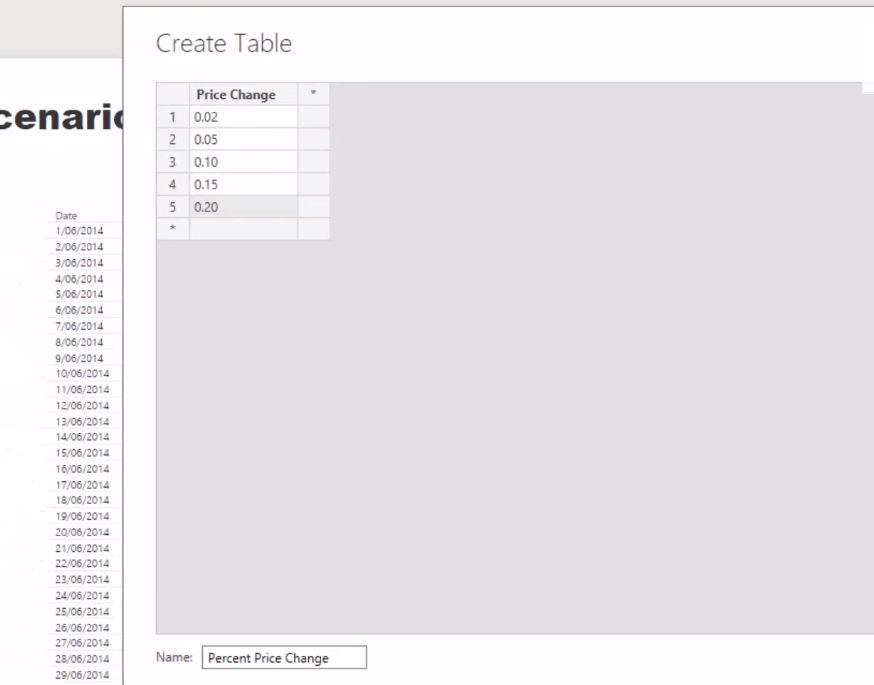
Once we load it in, it’s going to create a table for us, but this table has no relationship to our data model.
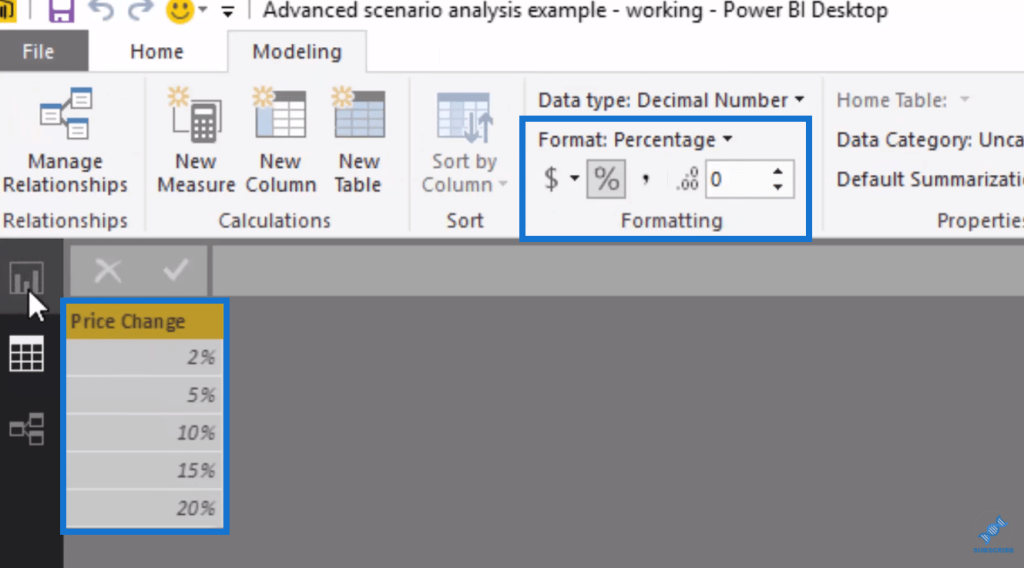
Then, we make sure to format this into a percentage.
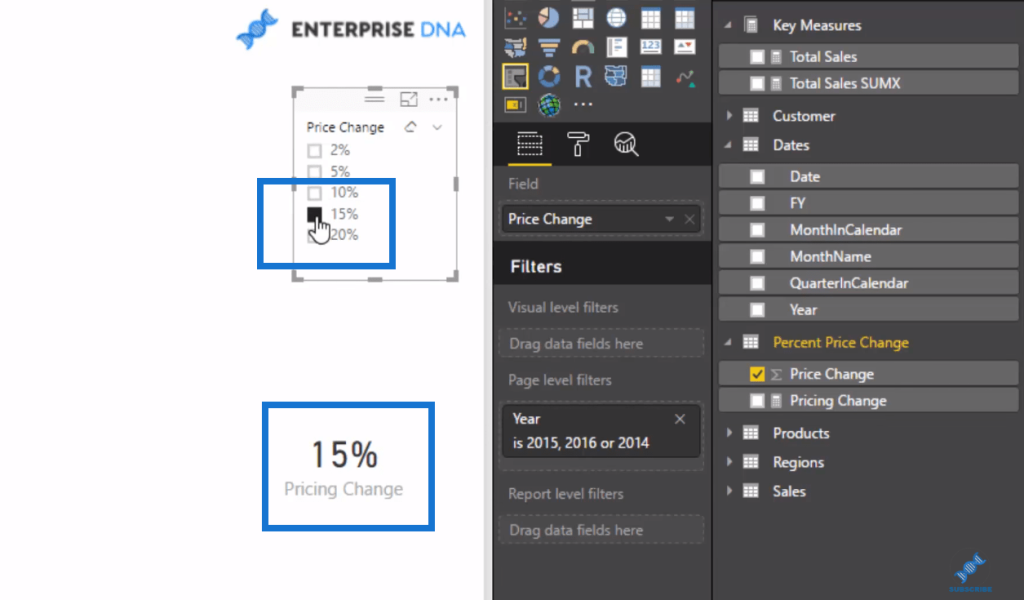
Now that we have this supporting table, we can bring it in and turn it into a slicer.
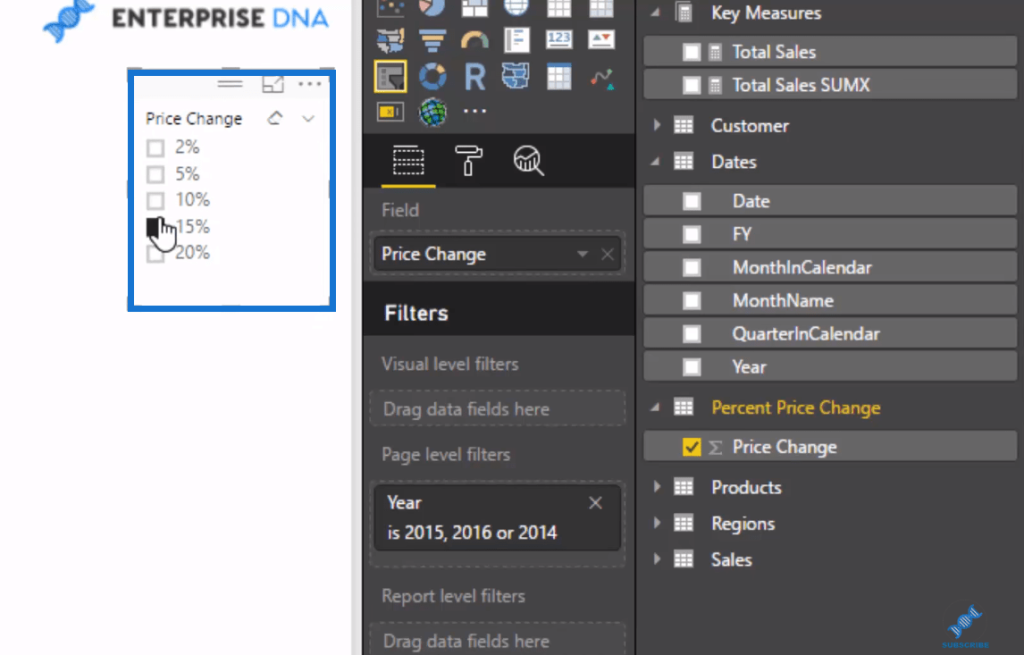
This enables us to make a selection on how much price change we want to run and make an analysis. Then, we’ll have to create a measure that will harvest the price change percentage being selected in the slicer.
Harvesting The Price Change Percentage Selected
In this formula (Pricing Change/Pricing Scenario), which will harvest the price change percentage selected, we’ll use IF HASONEVALUE with our Price Change. Then, with VALUES, it will equal to the Price Change Percent. If it’s not, it’ll be zero (0) change.

With this measure, we’re now getting the pricing change based on a selection.
When we select nothing, it shows 0%, so that’s great. No error.
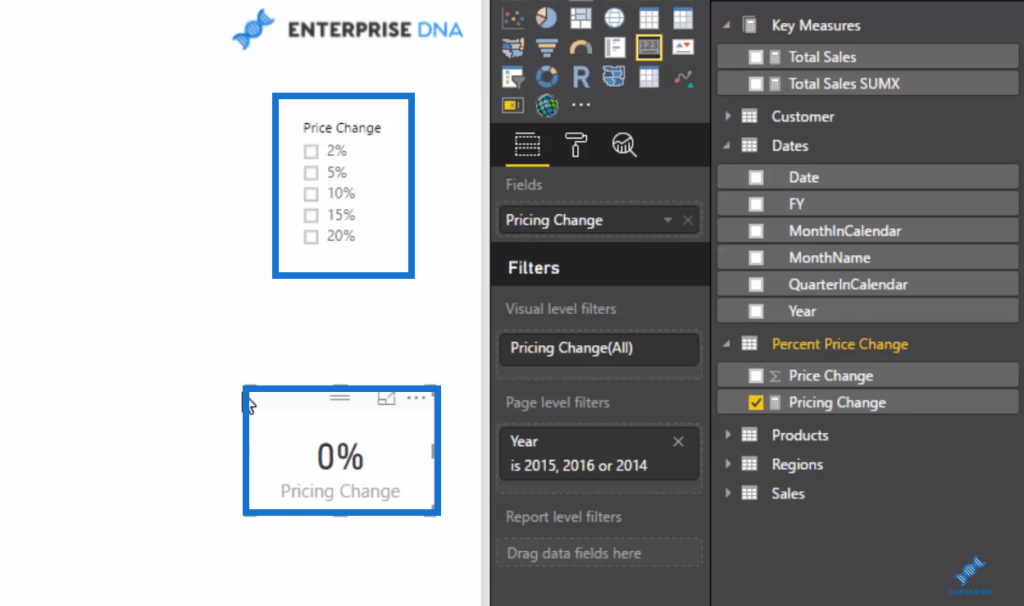
We can now integrate this into our calculations.

We drag this in and we have this dynamic Scenario Sales based on the percentage change.
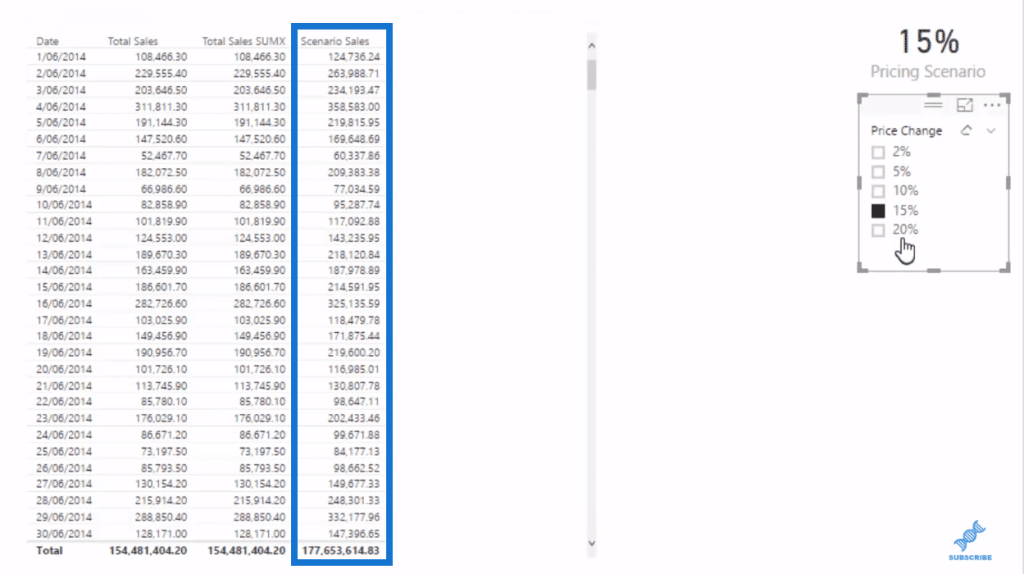
If nothing’s selected, it’s going to be exactly the same.


Showing All Sales Impact Of Selected Products
There’s a bit of a problem here, though. When we select three of these products, for example, it impacts everything. All the context has changed and now we’re only seeing the Scenario Sales for just these three products.
In this analysis, we want to see the impact on all our sales based on just the pricing change of certain products. So regardless of any selection made, we want to get the results in our Total Sales that don’t change based on the selection.
To do this, we’ll create another measure and call it All Sales. We’ll use the CALCULATE function to our Total Sales, so we’re still calculating total sales, but we’ll go ALL Products.

We drag this into our table and if we select a product, the Total Sales results stay exactly the same, which is shown in the All Sales column.

Showing Sales Of Selected Products
Furthermore, we want to figure out the total sales of whatever product or products we select. In this case, we’ll create a separate calculation just to make sure there’s no issue in our calculations. We can have an additional slicer but it could adjust the calculation. We want to make sure that filters are on or off the correct selections.
This is how we write the measure or formula.
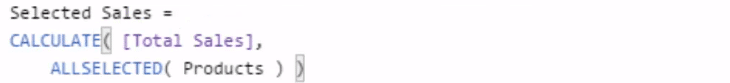
We’re using CALCULATE Total Sales once again. Next, go to ALLSELECTED Products. If we place this inside our table, we’ll see that as we select the product it’s only giving us the sales for that specific selection.

Working Out The Master Calculation
Now we can create our master calculation to complete our analysis. We’ll use our existing key measures to build this calculation.

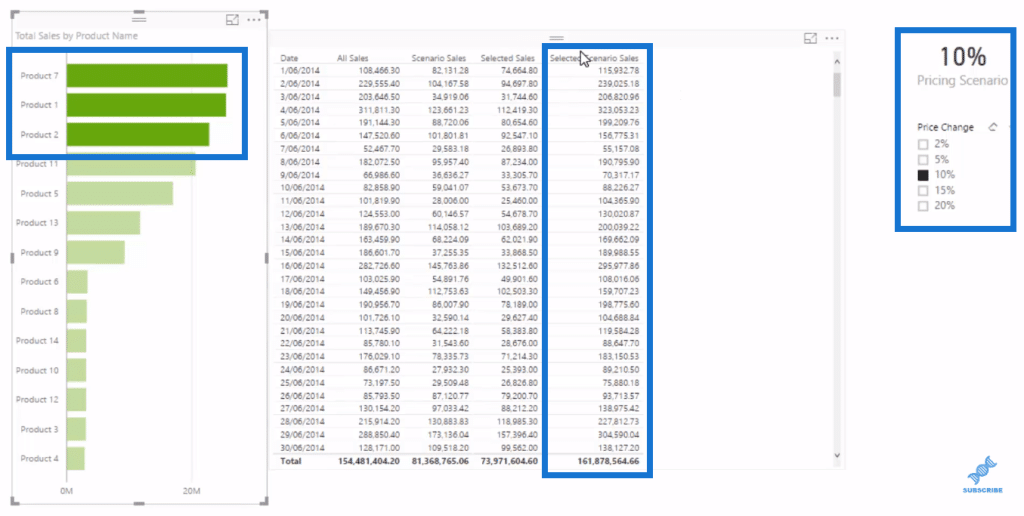
So we start with our All Sales and we subtract Selected Sales, which is the sales with no impact to it. Then we add back the Scenario Sales.

If no product is selected, the change in our Selected Scenario Sales is going to be exactly the same as our Scenario Sales.

But if we select some products, the Selected Scenario Sales results are different because the Selected Scenario Sales formula is calculating the entire portfolio by increasing the selected products by the selected percentage.
Branching Out Into More Measures For More Insights
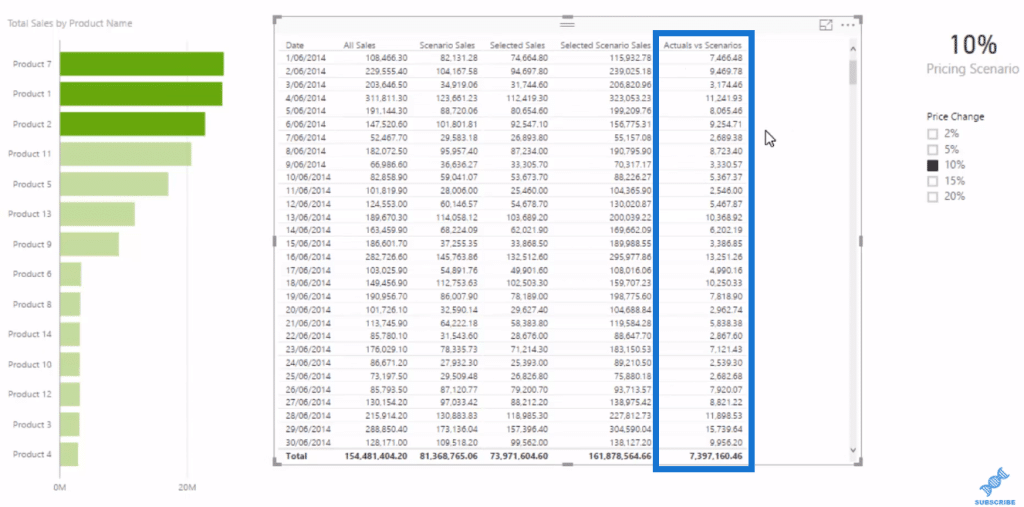
From this, we can go even further. We can have Actuals versus Scenarios, where we subtract All Sales from Selected Scenario Sales.

So if we can add this into the table, we can see the additional revenue per day that we would potentially achieve by increasing the price by 10%.
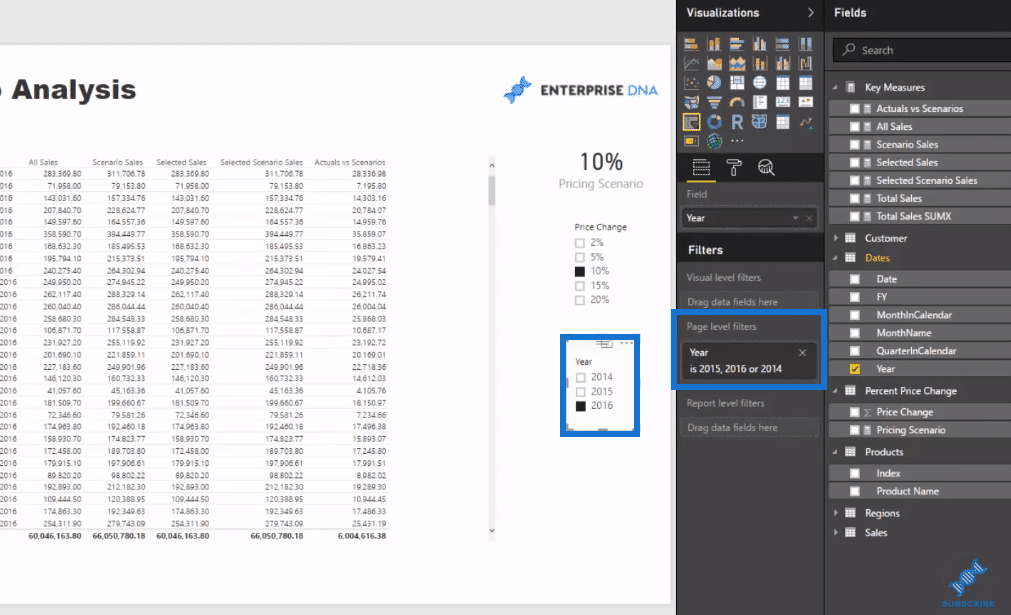
We can also add a different time frame if we only want to look at a specific year, for example.
Moreover, we could look at the percentage change of our Actuals vs Scenarios. We can get this by dividing (using the DIVIDE function) Actuals vs Scenarios by All Sales, and then we’ll place zero as the alternative result.

If there’s no product selected, it’s going to give the Pricing Scenario selected, which is 10% in this case.

But when we select these products, for example, the results are different because we’re only increasing the price of these three products.

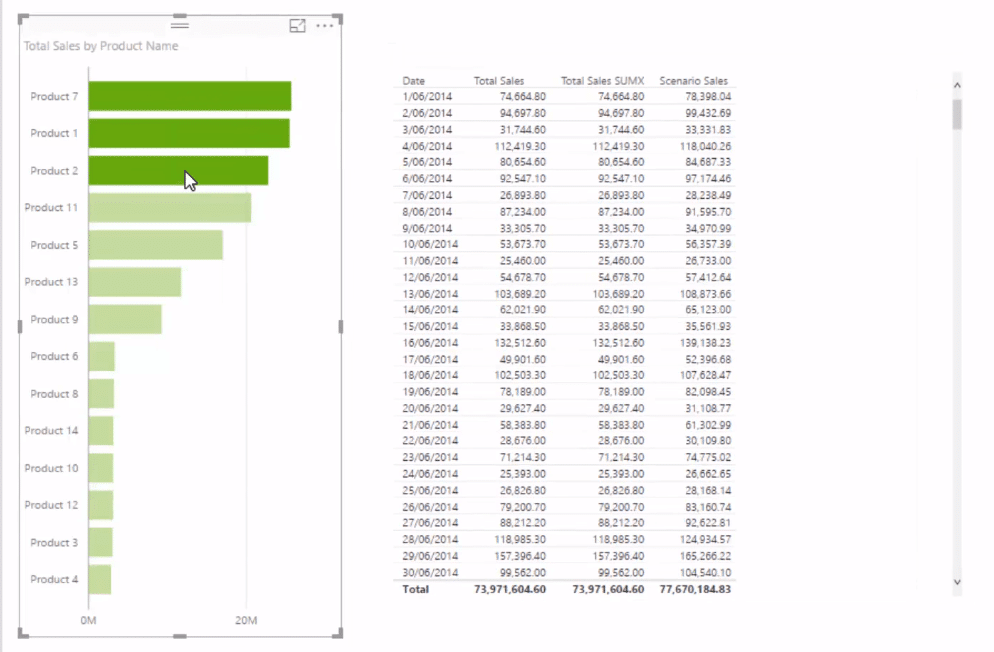
Creating Compelling Visualizations To Showcase The Results
Now that we’re done with our calculations, we can set up some visualizations to make this look more compelling. We’ll add in some colors to make it more visually appealing.

We can also add some Data labels.
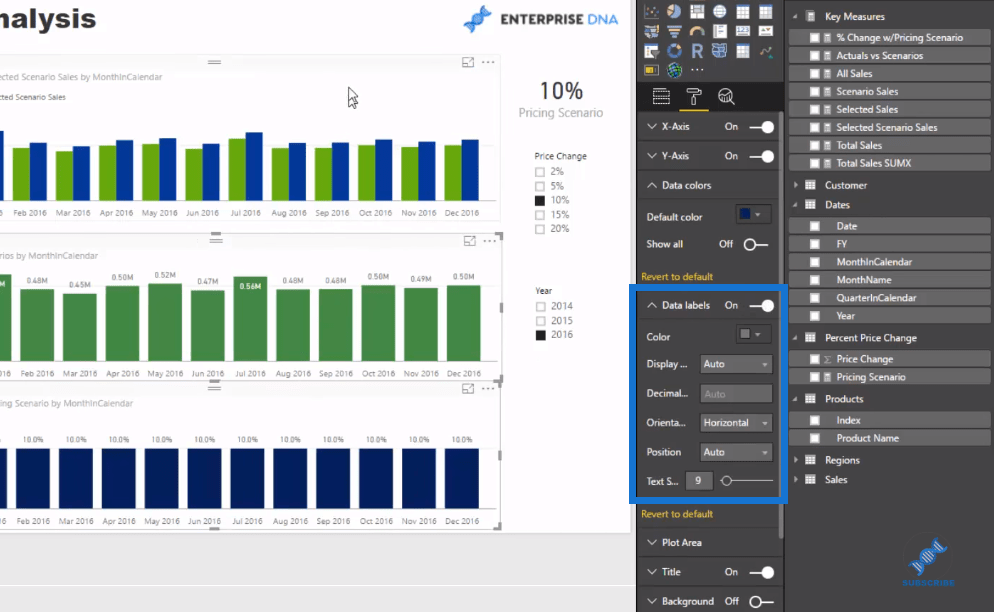
With this visualization set up, we can dynamically shock any of our products by any price change that we have in our slicer.

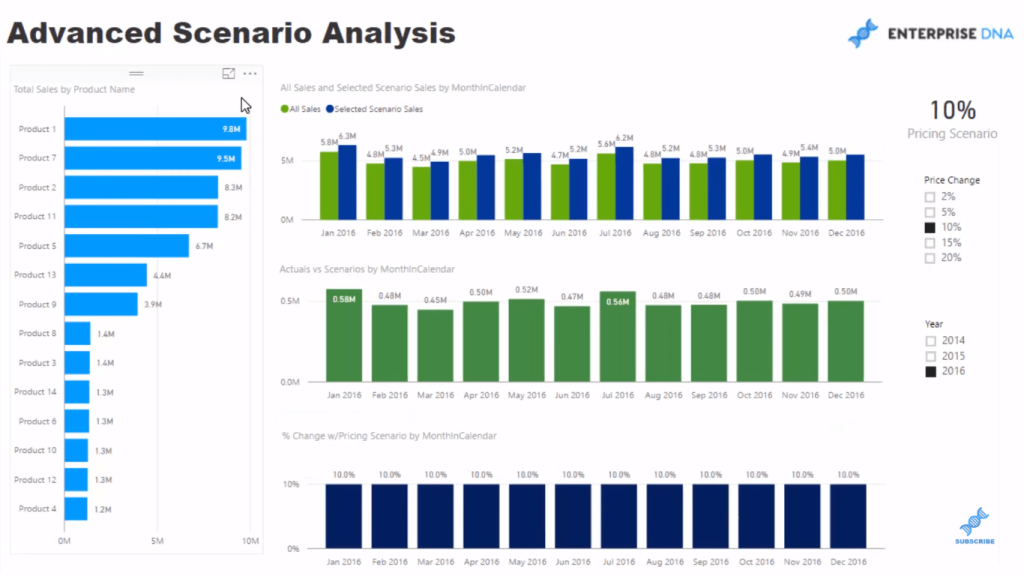
We might want to add one more card as well, which will give us a summary metric.
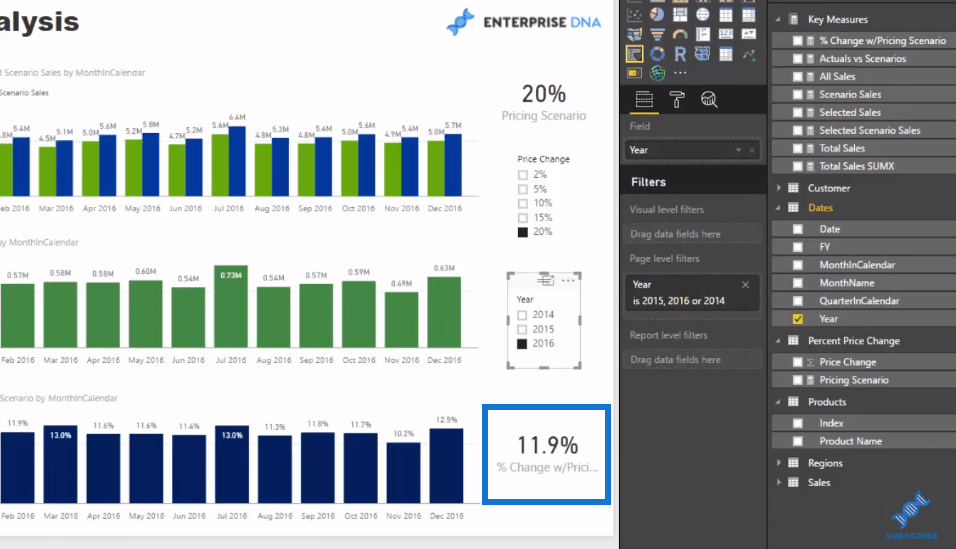
So for instance, we want to increase the price by 20% of our top four products, the results in our visualizations will change dynamically as we select the price change and the products.
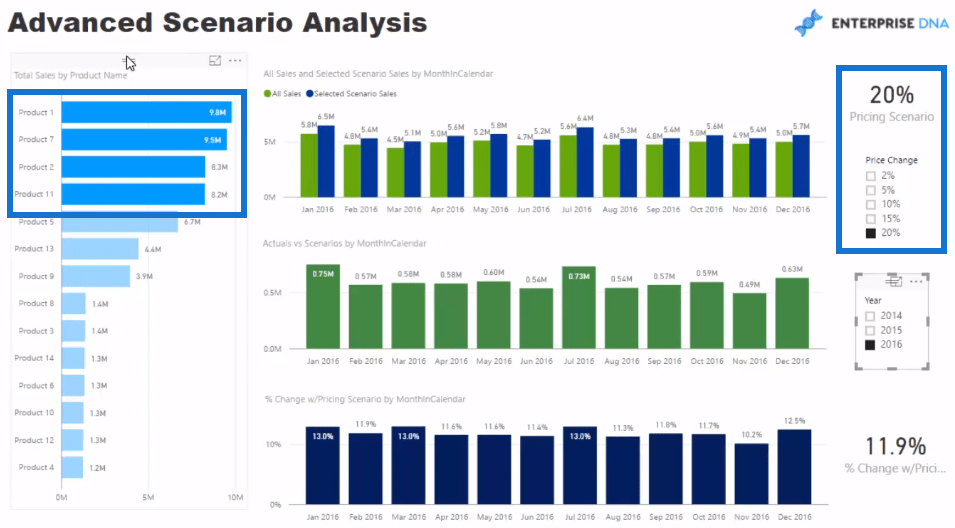
And that’s how we build a Power BI data model specifically for an advanced scenario analysis.
***** Related Links*****
Using Multi-Layered Scenario Analysis in Power BI
Scenario Analysis Techniques Using Multiple ‘What If’ Parameters
Advanced Analytics in Power BI: Layering Multiple ‘What If’ Analysis
Conclusion
This is quite advanced but very achievable. It just takes a lot of practice and also really makes you focus on your data. It makes you think hard about the sort of insights you want to test around your future results. Try to identify the variables sitting in your data sets or calculations that you could ‘shock’ or tweak to review their impact on your underlying performance.
I highly recommend this Power BI data model development technique. Be sure to try to incorporate it into your models so you embed the concepts in your mind and take them even further.
Good luck on this one!
Sam
***** Learning Power BI? *****
FREE COURSE – Ultimate Beginners Guide To Power BI
FREE COURSE – Ultimate Beginners Guide To DAX
FREE – 60 Page DAX Reference Guide Download
FREE – Power BI Resources
Enterprise DNA Membership
Enterprise DNA Online
Enterprise DNA Events
[youtube https://www.youtube.com/watch?v=RY47z5pvaEc&w=784&h=441]


