
dplyr is a popular R package for data manipulation, making it easier for users to work with data frames. A common task when working with data is renaming columns, which dplyr handles efficiently using the rename() function.
The rename() function in dplyr is particularly useful when dealing with datasets that have columns with unclear or ambiguous names. By providing a simple and intuitive syntax for renaming columns, dplyr makes it easier for users to understand and maintain their code.

Additionally, this function can be easily combined with other dplyr operations, such as filtering and summarization, to create a seamless data manipulation workflow in R.

These features are also available in Power Query, so they aren’t unique to the R program. However, R is better at handling them.
In the following article, we will explore the details of dplyr’s rename() function and its various applications, exemplifying how effective it can be in managing data frames.
We will also learn how to add and remove columns in R using dyplr.
By learning these techniques, users can enhance the practicality of their data manipulation efforts, produce more robust and error-free analyses and have fun along the way!
Let’s get into some data science, it’s time to tibble, or should we say, bring on the base R!
Understanding Dplyr Rename
The dplyr package in R is a popular tidyverse package for data manipulation that offers a set of useful functions for transforming and organizing datasets. Among these functions, the rename() function is particularly handy when it comes to modifying column names in a data frame.
To use the rename() function, simply provide the new column name followed by the old one, like this: new_name = old_name. For instance, let us consider a sample data frame where we want to change the column name “old1” to “new1”. The syntax would look like this:
library(dplyr)
df %>% rename(new1 = old1)
Additionally, the rename_with() function allows you to rename columns using a specified transformation function. For example, you may use the toupper function to convert all column names to uppercase:

df %>% rename_with(toupper)
If you need to rename multiple columns at once, dplyr provides two methods. The first one involves using the rename() function, providing multiple new and old column names as arguments:
df %>% rename(new1 = old1, new2 = old2)
The second method involves using the rename_with() function, where you define arrays of old and new column names:
new <- c('new1', 'new2')
old <- c('old1', 'old2')
df %>% rename_with(~ new, all_of(old))
Both methods, as shown in the examples above, will produce the same result.
Installing and Loading Dplyr
To begin using the dplyr package for renaming columns, you must first install and load the package in your R environment. Installing dplyr is a simple process that can be carried out using the following command:
install.packages("dplyr")
After the installation is complete, you can load the dplyr package in your R script using the library function:
library("dplyr")
With the dplyr package installed and loaded, you can now utilize its powerful data manipulation functions, including the rename() function to rename columns in your data frame.
Here’s an example of using the rename() function with the well-known iris dataset. Suppose you want to rename the “Sepal.Length” column to “sepal_length”. You can achieve this using the following code:
iris_renamed <- iris %>%
  rename(sepal_length = Sepal.Length)
In this code snippet, the %>% operator is used to pipe the iris dataset into the rename() function. The new column name “sepal_length” is assigned to the old column name “Sepal.Length”. The resulting data frame with the renamed column is then assigned to the variable names, iris_renamed.
The rename() function can also handle multiple columns renaming at once. For example, if you want to rename both “Sepal.Length” and “Sepal.Width” columns to “sepal_length” and “sepal_width” respectively, you can use the following code:
iris_renamed <- iris %>%
  rename(
    sepal_length = Sepal.Length,
    sepal_width = Sepal.Width
  )
This code snippet demonstrates how easy it is to rename multiple columns in a data frame using dplyr’s rename() function.
Using Dplyr Rename Function
The dplyr package in R is a powerful tool for data manipulation when working with data frames. One of the many useful functions it provides is the rename function, which allows you to easily rename columns in your data frame.
Basic Syntax
The basic syntax for using the rename function in dplyr is as follows:
library(dplyr)
your_dataframe %>% rename(new_column_name = old_column_name)
This command will rename the specified old column to the desired new column name, without changing any other columns in the data frame.
Renaming Multiple Columns
You can also rename multiple columns at once using the same rename function. To do this, just separate each column by renaming the pair with a comma:
your_dataframe %>%
   rename(new_column1 = old_column1,
          new_column2 = old_column2,
          new_column3 = old_column3)
Using this approach, you can rename as many columns as needed in a single statement.

Alternatively, you can use the rename_with() function to apply a transformation to column names. This function takes a data frame and a function that will be applied to the column names to generate the new names. For example:
your_dataframe %>%
  rename_with(.cols = c("old_column1", "old_column2"), .fn = toupper)
This will convert the specified column names to uppercase.
Chaining with Other Dplyr Functions
One of the strengths of dplyr is its ability to chain multiple actions together using the %>% operator. This allows you to perform a series of data manipulations in a concise and easy-to-read manner. When using the rename function, you can chain it along with other dplyr functions such as filter(), mutate(), and summarize() :
your_dataframe %>%
  filter(some_condition) %>%
  rename(new_column_name = old_column_name) %>%
  mutate(new_column = some_expression) %>%
  summarize(some_aggregation)
This example demonstrates a series of data manipulations where data filtering is done first, followed by renaming a column, creating a new column using mutate, and finally summarizing the data with an aggregation function.
By leveraging the power of dplyr’s rename function and chaining capabilities, R users can perform efficient and readable data manipulations on their data frames.
Common Dplyr Rename Use Cases
Dplyr is a powerful package in R that provides a set of functions for performing data manipulation tasks. One common task is renaming columns in a data frame. In this section, we will discuss some common use cases for the rename feature in dplyr.
1. Simple column renaming:
Renaming a single column is straightforward using the rename() function. The syntax is rename(dataframe, new_name = old_name). Here’s an example:
library(dplyr)
dataframe <- dataframe %>% rename(new_column_name = old_column_name)
2. Renaming multiple columns:
You can also rename multiple columns in one function call by providing additional column mapping inside rename() function. Here’s an example:
dataframe <- dataframe %>%
  rename(new_col_name1 = old_col_name1,
         new_col_name2 = old_col_name2)
3. Renaming columns using string functions:
You can rename columns using string functions, such as tolower() or toupper(), by using the rename_with() function. According to Stack Overflow, this function replaces the now superseded rename_if, rename_at and rename_all functions. Here’s an example:
dataframe <- dataframe %>%
  rename_with(tolower)  # Converts column names to lowercase
4. Renaming columns based on a condition:
With rename_with(), you can apply custom renaming functions and even use conditions. The following example demonstrates renaming columns based on whether they contain a certain string:
rename_function <- function(x) {
  if (grepl("Length", x)) {
    return(paste0(x, "_length"))
  } else {
    return(paste0(x, "_default"))
  }
}

dataframe <- dataframe %>% rename_with(rename_function)
Handling Errors and Edge Cases
While using the dplyr rename function to modify column names in a data frame, you might encounter some errors or edge cases due to duplicate column names, spaces in column names, or incorrect syntax. This section provides guidance on how to address these issues.
When dealing with duplicate column names, dplyr cannot rename the columns with the same output name. However, a workaround to unduplicate column names is to use the rename_all function from the dplyr package along with paste0:
d %>% rename_all(~paste0(., 1:2))
This code will append a number from 1 to 2 to each column name, ensuring there are no duplicates. More details can be found in this Stack Overflow discussion.
In case there are spaces in column names, you can use backticks to enclose the column names like this:
df %>% rename(foo = `test col`)
Finally, if you face issues related to dplyr not accepting the paste0() function as the old_name in rename(), a possible solution is to construct the new column names outside of the rename() function and then use them as input. A relevant discussion on a similar issue can be found in this Stack Overflow question.
By addressing these errors and edge cases, you will be better equipped to handle complex renaming scenarios in dplyr.

In this final section of our article about dplyr rename, we have discussed its importance in data manipulation tasks. The rename() function allows users to alter column names efficiently, leading to clearer and more concise data frames. This becomes particularly useful when dealing with large datasets or during data preprocessing steps.
Using the dplyr package, renaming columns in R is straightforward, it isn’t hard data science, check out the below:
rename(new_column_name = old_column_name)
This simple syntax lets you replace old column names with new ones, improving readability and ensuring consistency in your data. Additionally, the rename_with() function can be employed to modify column names using a specific function. This offers greater control and customization of your data manipulations.
By harnessing the power of dplyr and the rename function, you can confidently manipulate your data and improve overall data processing capabilities. Remember to always use reliable sources when learning new R programming techniques, such as this great R course.
With dplyr rename in your toolkit, you are well-equipped to tackle a variety of data manipulation challenges and continue advancing your R programming expertise.
Further Real-World Examples -Adding, Removing & Renaming Columns
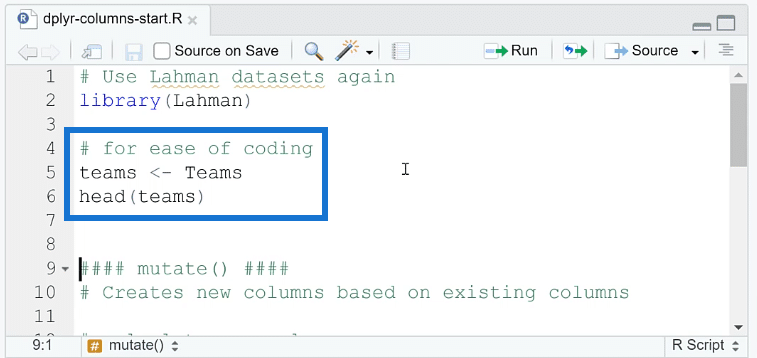
Column operations allow you to calculate, add, remove, and rename columns in R using dplyr. Open a new R script in RStudio. If you don’t know how, click on the links to find out how to install RStudio and create an R script.
For this demonstration, the Lahman dataset package is used. This contains baseball records dating back over a hundred years. It’s a good dataset to use for practice. You can download it by doing a quick google search.
Moreover, the Lahman package has a dataset labeled Teams, with a capital T. A best practice for naming conventions in R is using lowercase letters. So this needs to be converted first to teams, as seen in the image below.
Basic Functions For Column Operations
1. Add New Columns In R
The first function is mutate ( ). This creates new column based on existing columns.
If you want to calculate a new column, you can use the mutate function following the argument:
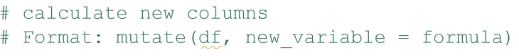
df is a stand-in name for any kind of data frame. So when in actual use, replace df with the name of the data frame you want to mutate. Then, you place the new variables that need to be named along with the formula for deriving the new column.
As an example, the mutate function will be used to find the winning percentage for each column. In the Lahman dataset, there’s a Win and Loss column. To get the percentage, divide Win by the sum of Win and Loss. But before you can do that, you need to bring in the dplyr package.
Here’s what happens if you run the mutate function without dplyr:
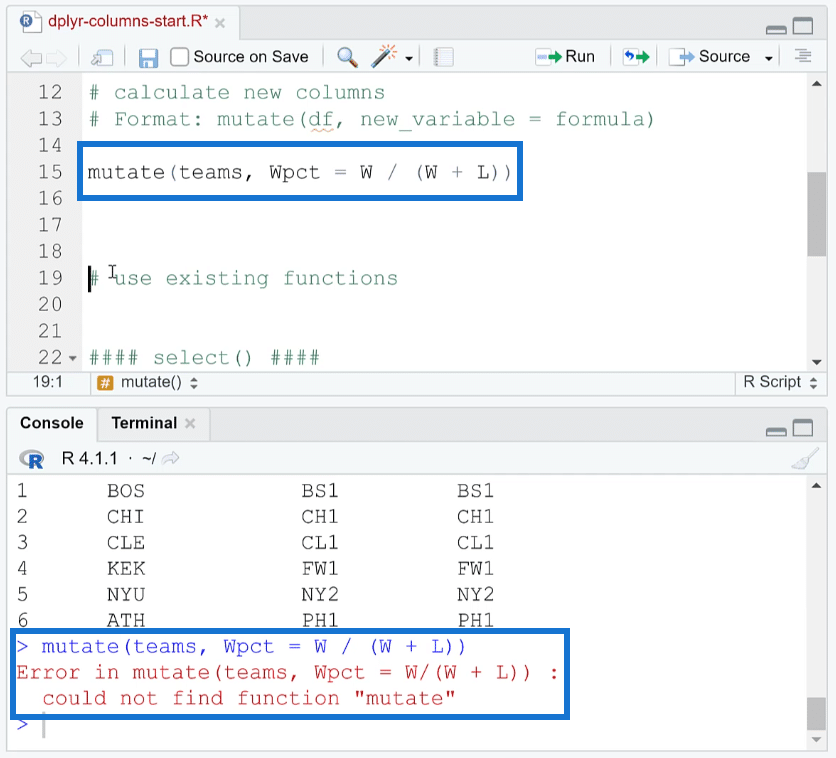
You’ll get an error saying “could not find function mutate”.
So, here’s how to bring in dplyr into R. You only need to run library (tidyverse).
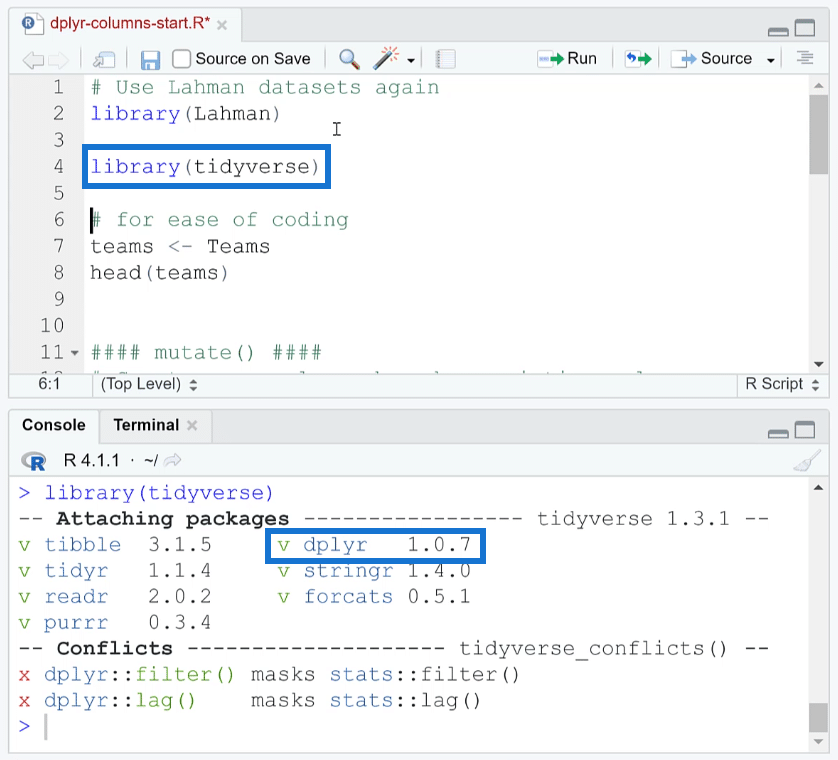
You’ll see that dplyr is among the many functions in the tidyverse package. Another option is to run library (dplyr).
Now if you place your cursor on the code with the mutate function and run it, you’ll then see the Wpct column containing the winning percentages.
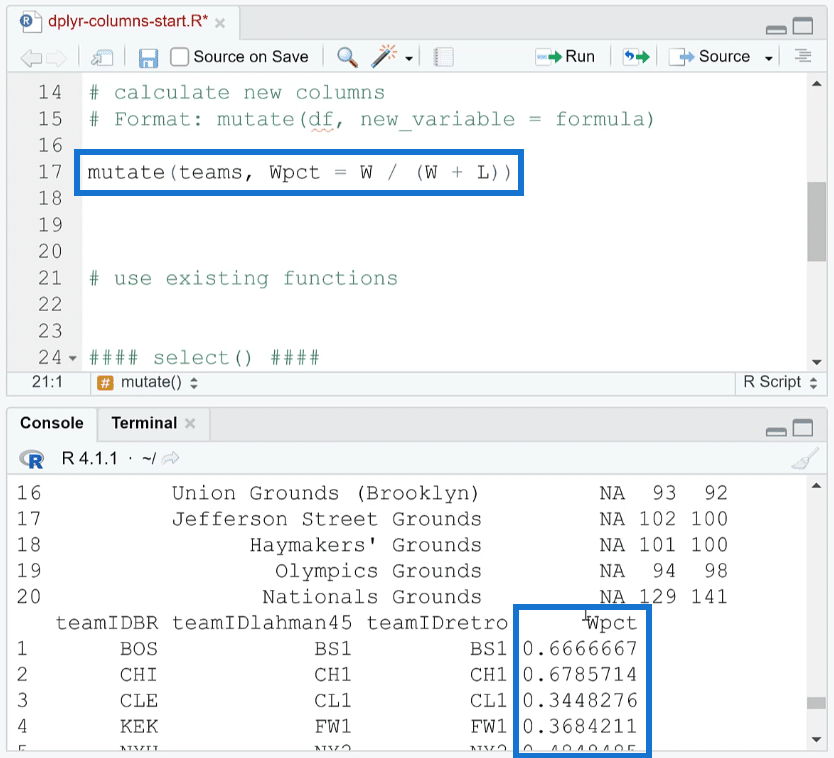
In this instance, the result of the mutate function was only ran; it didn’t assign to the data.
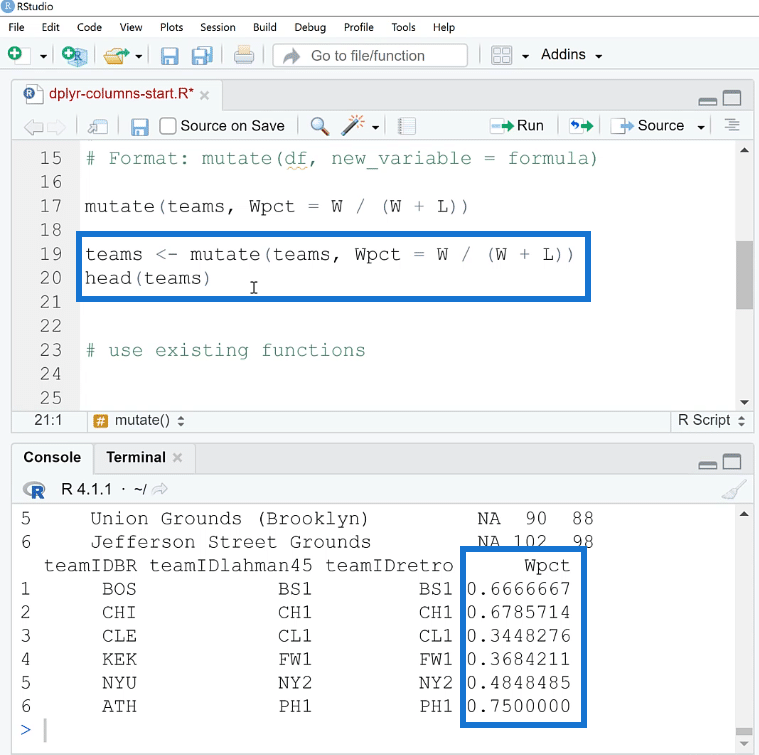
If you want to assign the result of the mutate function to the data teams, you need to use the assignment operator ( <- ). Once done, run it. Then in another line, run head (teams). This will assign the result to the teams dataset.
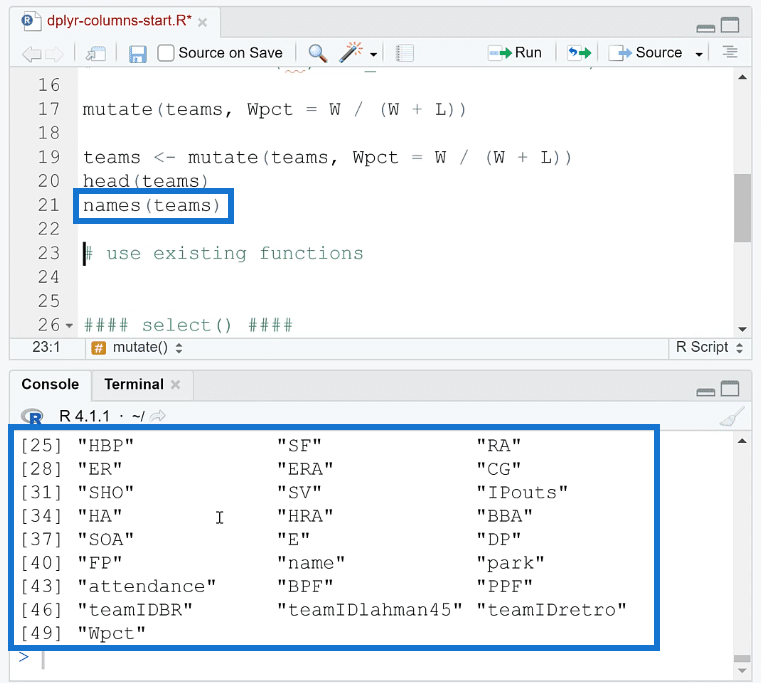
If you want to check what columns are available in a data set, use the names ( ) function. This will list all of the column names in the data.
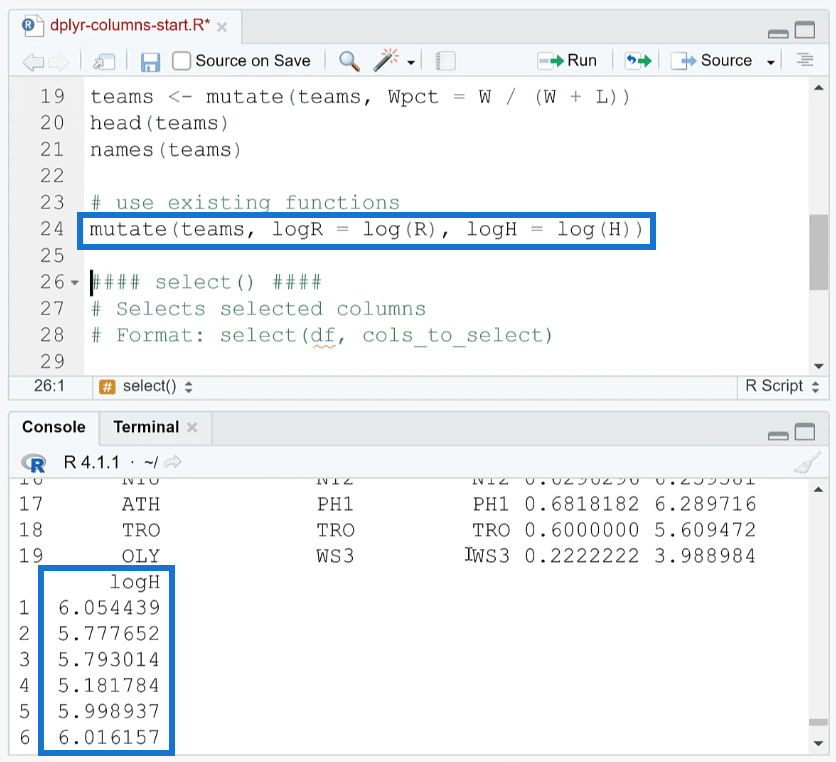
You can also use existing functions as part of the mutate function. For example, you can take the log of a specific dataset using the log ( ) function.
2. Select Columns In R
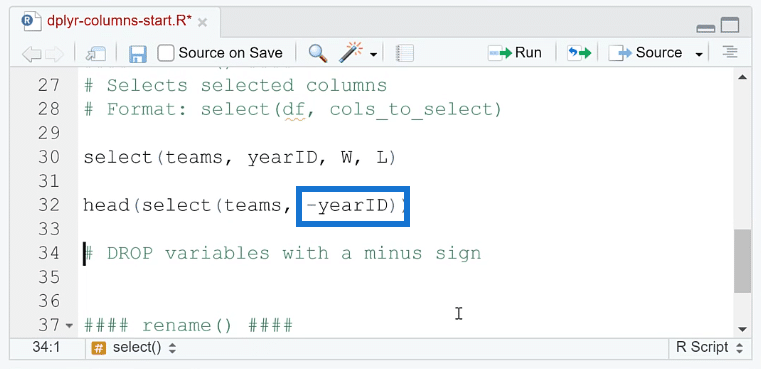
Another function in dplyr is select ( ). It either drops or selects given columns. Its basic algorithm is:
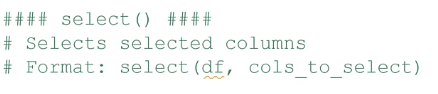
You need to input the data frame name and then the columns you want to select.
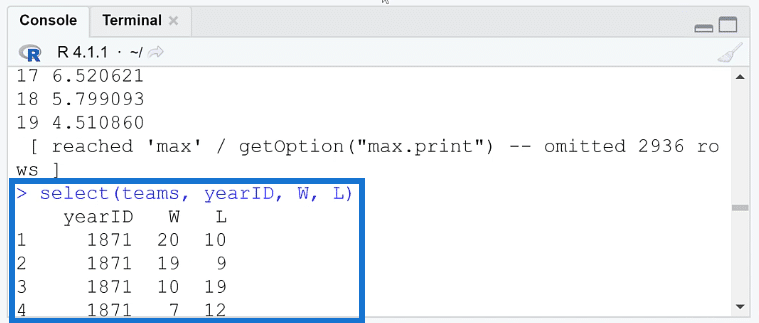
For example, if you want to keep the yearID, wins, and loss columns in the dataset, you only need to run:
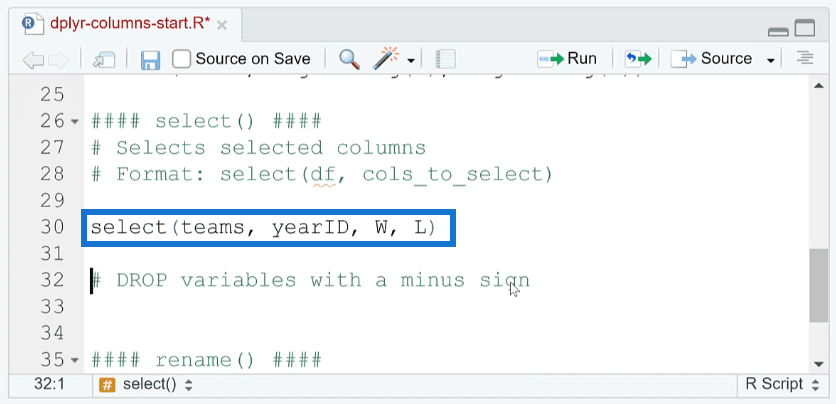
You’ll then get the result you want:
However, if you don’t use the head ( ) function, the result will show the bottom rows of the columns. So if you’re dealing with multiple rows of data, you’ll need to continuously scroll up to get to the top of the column.
A best practice is to use the head function along with select. So that when you run the code, the result will show the top rows of the column first.
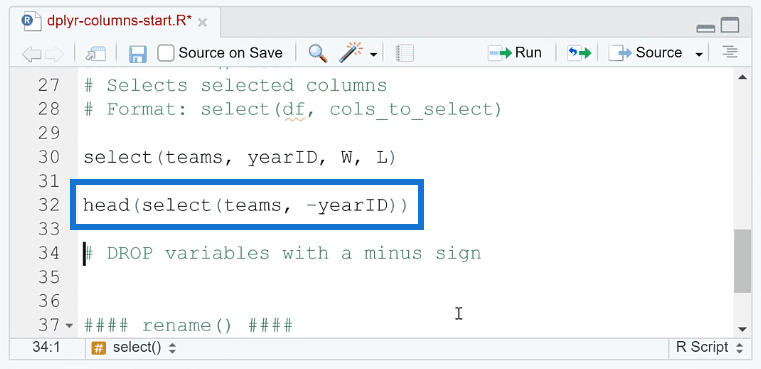
Now if you want to remove columns from the dataset, you only need to place a minus sign ( – ) before the column name.
To check if a column has indeed been removed, you can compare the new dataset from the old one. Here’s how to do it:
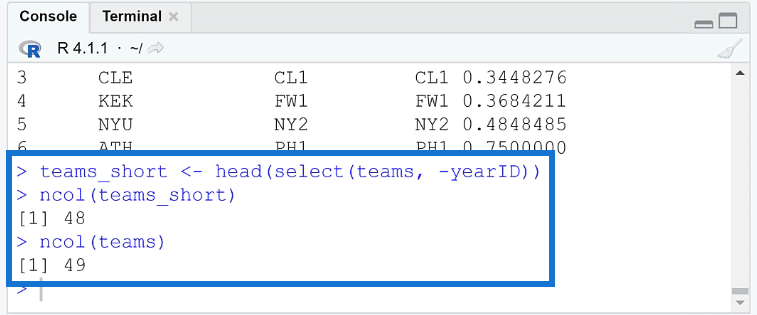
First, assign the R code with the select function to an object. In this example, it’s been assigned to teams_short. To count the number of columns, use the ncol ( ) function. Run the ncol function for both teams_short and teams.
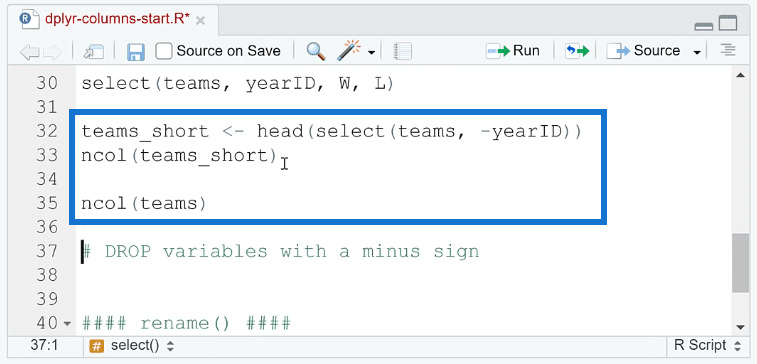
You’ll then see that one column was removed from the dataset.
3. Rename Columns In R
The last column function in dplyr is rename ( ). And as the name suggests, it can rename selected columns in R.
This is its basic algorithm:
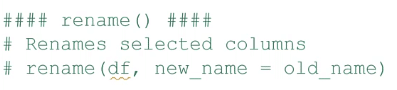
And you’ll notice that it’s a bit counterintuitive; the new name comes first while the old name comes after that. So make sure to not get those mixed up.
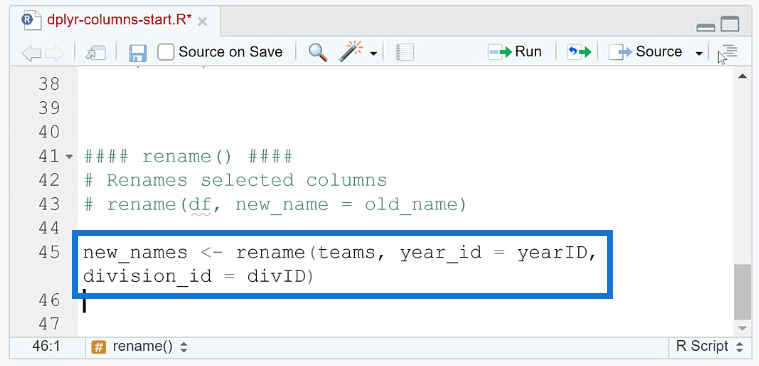
As an example, the current yearID and divID columns will be renamed to year_id and division_id, respectively. Before running the code, make sure to assign this to a new object so as to not disrupt the original dataset.
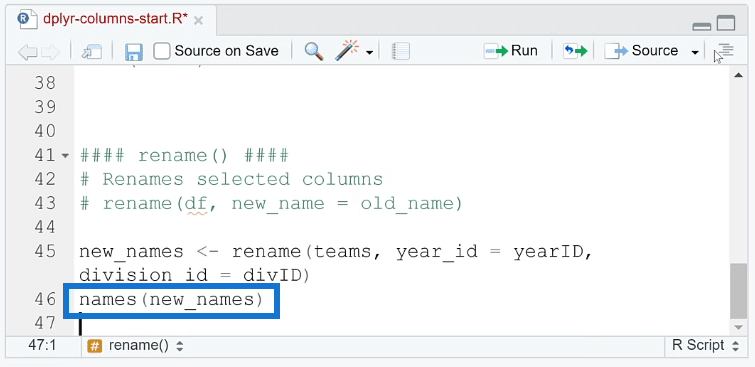
To check if these selected columns had their names successfully changed, use the names ( ) function.
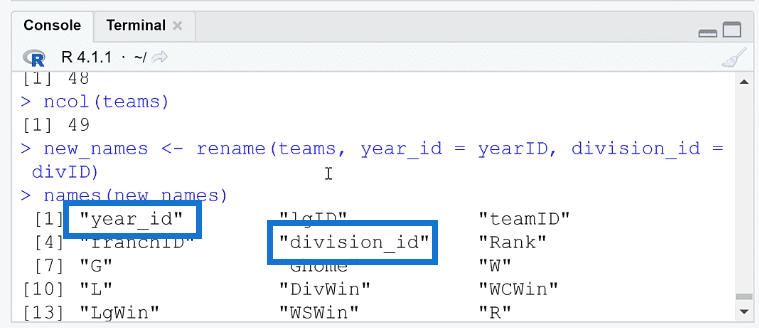
You’ll see that the columns have indeed been renamed.
Ever wondered how powerful R is when used with Power BI, check out this awesome technique, it will save you a tonne of time.
The Final Word
This tutorial has discussed three basic dplyr functions you can use to perform column operations. Specifically, you learned how to add, remove, and rename columns in R.
There are still other functions that you’ve yet to explore. But it’s important to know and be familiar with mutate ( ), select ( ), and rename ( ) as they are the most common.
These column editing techniques can also be done in Power Query. But it’s great to have knowledge of how to do this in dplyr, too. This will surely assist you when you move to analyzing statistical data sets.
George
FAQs
What is the difference between R and Python?
For starters, both R and Python are programming languages, but python is more of a general use language and R is a statistical programming language. Python is a more commonly used, understood and versatile language.
What is str?
str simply displays the structres of r objects
What is Petal.Length in R?
Petal.length is a format used throughout R for recounting relationships we are testing.
What is a DataFrame in R?
An R Data frame is a tabular data structure that is commonly used to store values of any type of data.
What does dbl stand for?
Dbl stands for “double class” it’s a data type used to hold numeric values containing decimal points.


