
In this tutorial, we’ll be looking at how to use the DAX function CALCULATE in Power BI. You can watch the full video of this tutorial at the bottom of this blog.
CALCULATE is one of the most dynamic functions that can help you add deeper insights to your reports. But to truly understand it, it’s necessary to have a good grasp of row and filter context as well.

Sample Data Used
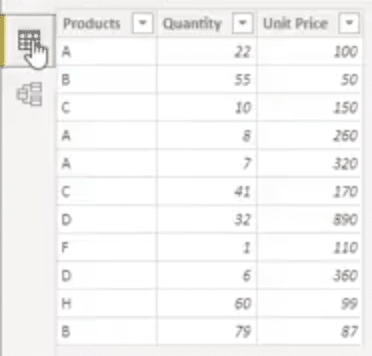
For the purpose of this tutorial, let’s use a simple dataset that shows Products, Quantity, and Unit Price.
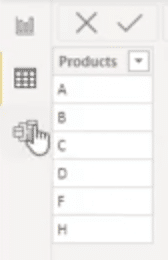
We also have a dimension table that only contains Products.
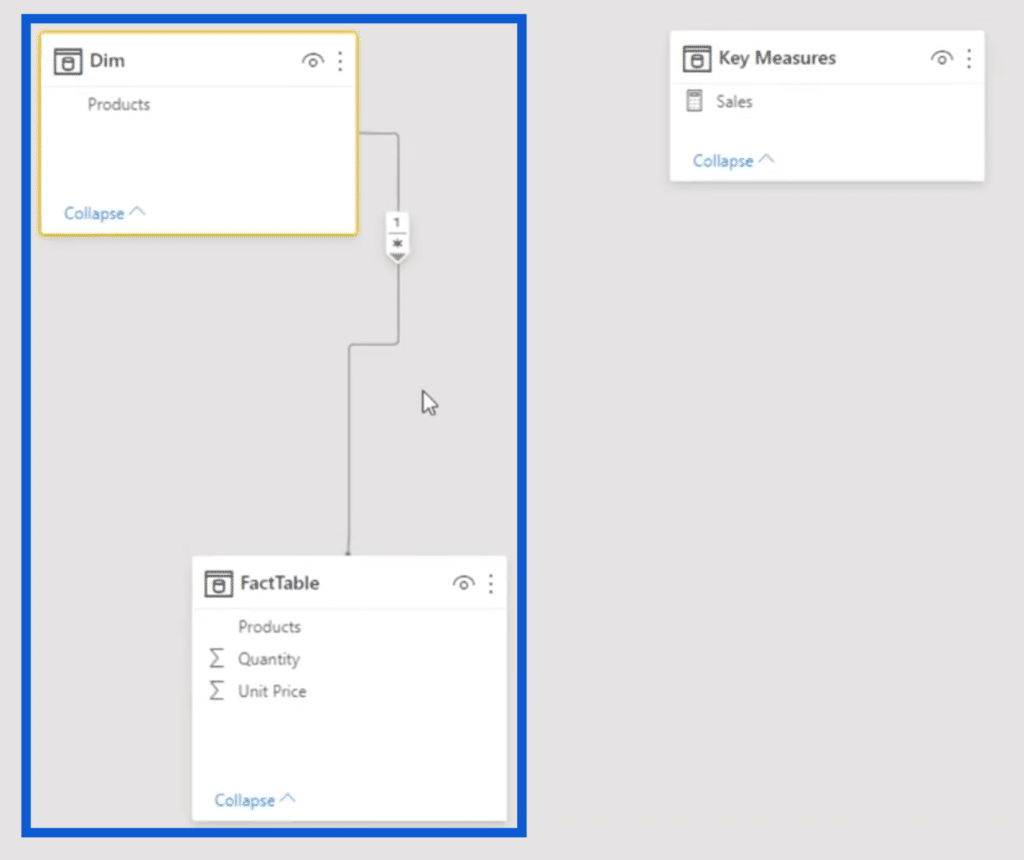
If we look at the model, we can see that the Products, which appear in our dimension table, are linked to the fact table through a many-to-one relationship.
Row Context Through CALCULATE In Power BI
Row context is one of the primary concepts you have to understand to truly understand what CALCULATE is all about. To help make this clearer, let’s first look at how our dataset looks like in Excel.
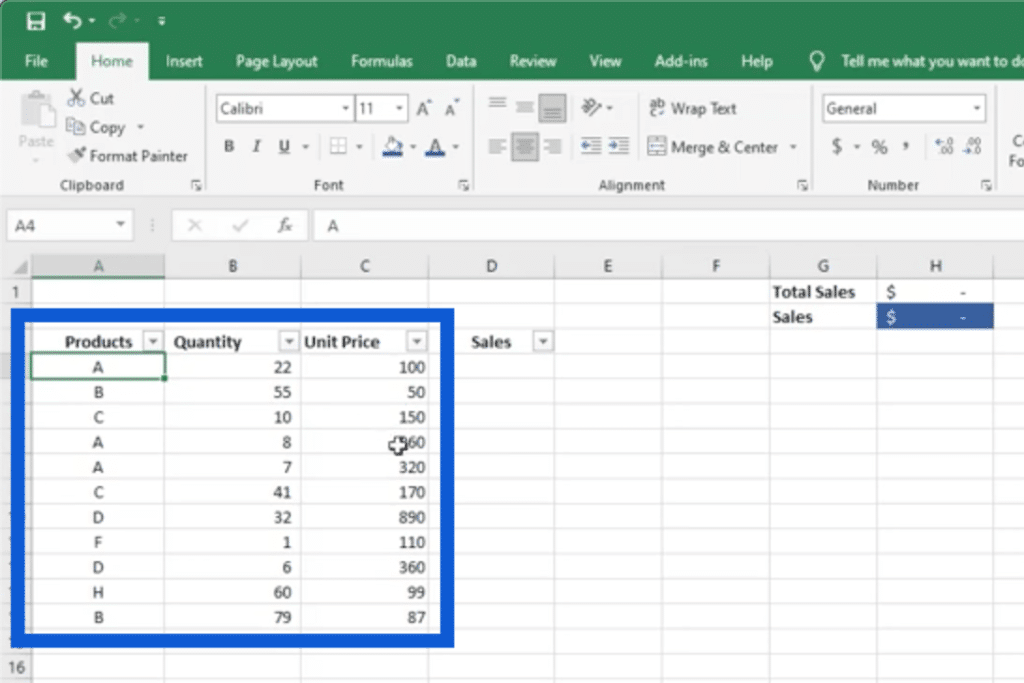
Basically, the row context defines what’s happening to every single row. If we were to get the Sales for product A, for example, we would simply put an equal sign, then multiply the values under Quantity and Unit Price.
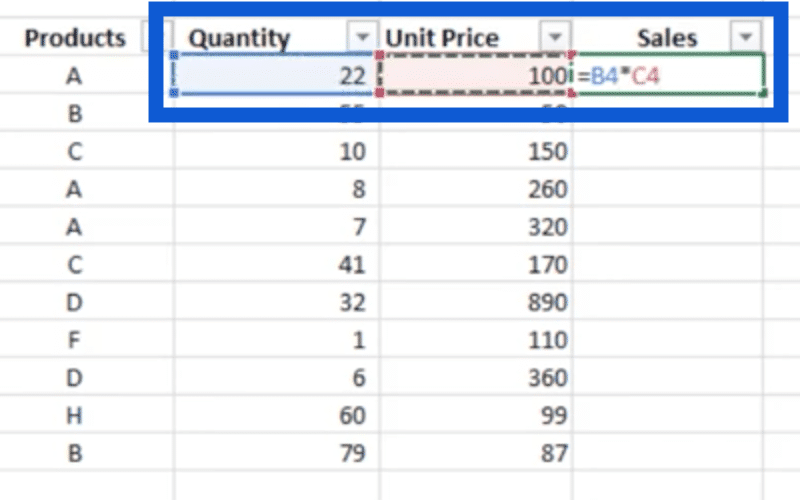
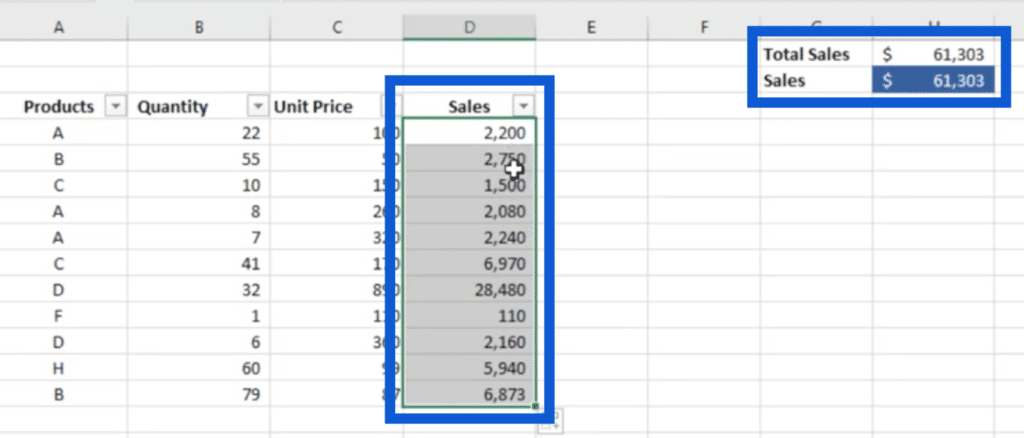
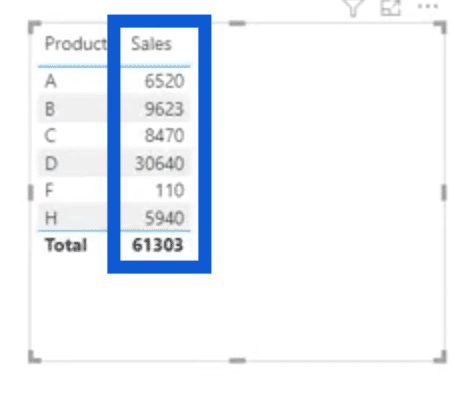
If we apply that same logic row after row, we get the amount of Sales for each row, allowing us to come up with the Total Sales.
Now, let’s switch to Power BI.

Remember that the same calculation was iterated row by row. There are a number of iterating functions in Power BI, most of them ending with an X. For example, the iterating function for SUM would be SUMX.
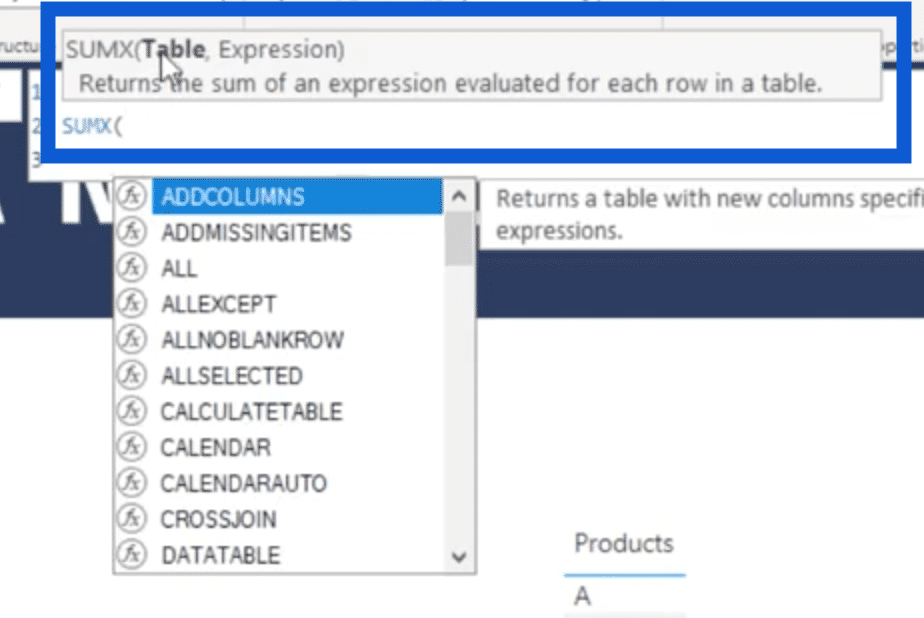
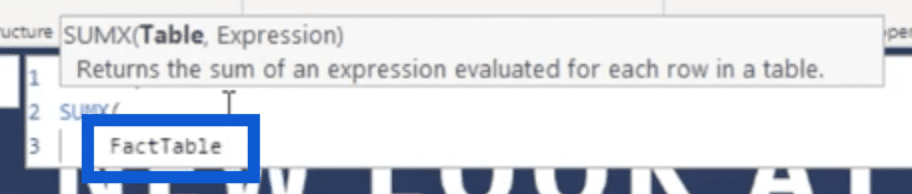
As you can see, SUMX requires a table to be referenced, so we’ll use our FactTable where our data is stored.
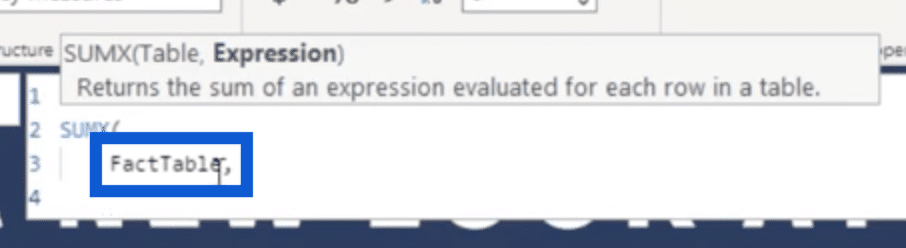
Then, we’ll multiply the required columns from the FactTable, which are Quantity and Unit Price.
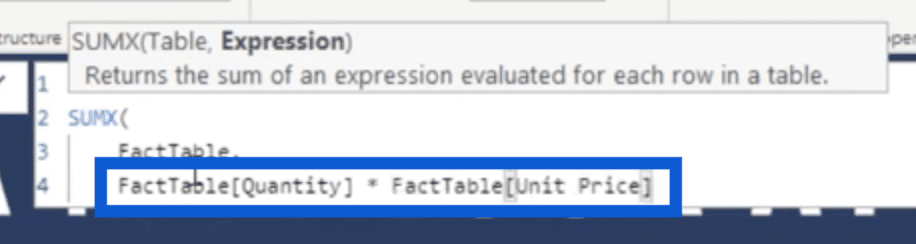
When I hit enter, it will give us our Sales.
Filter Context Through CALCULATE In Power BI
The second thing we have to look at is our filter context, which is another critical component of CALCULATE.
Using CALCULATE means modifying the filter context applied to an expression. So first, we’ll look at how to modify the filter context. This simply means changing the filters on the report.
When applying it to an Excel report, it’s as easy as clicking on the dropdown arrow beside the column name and choosing the filters that you want to apply.
If, for example, I only need the data for Product A, I simply need to tick off A on this filter.
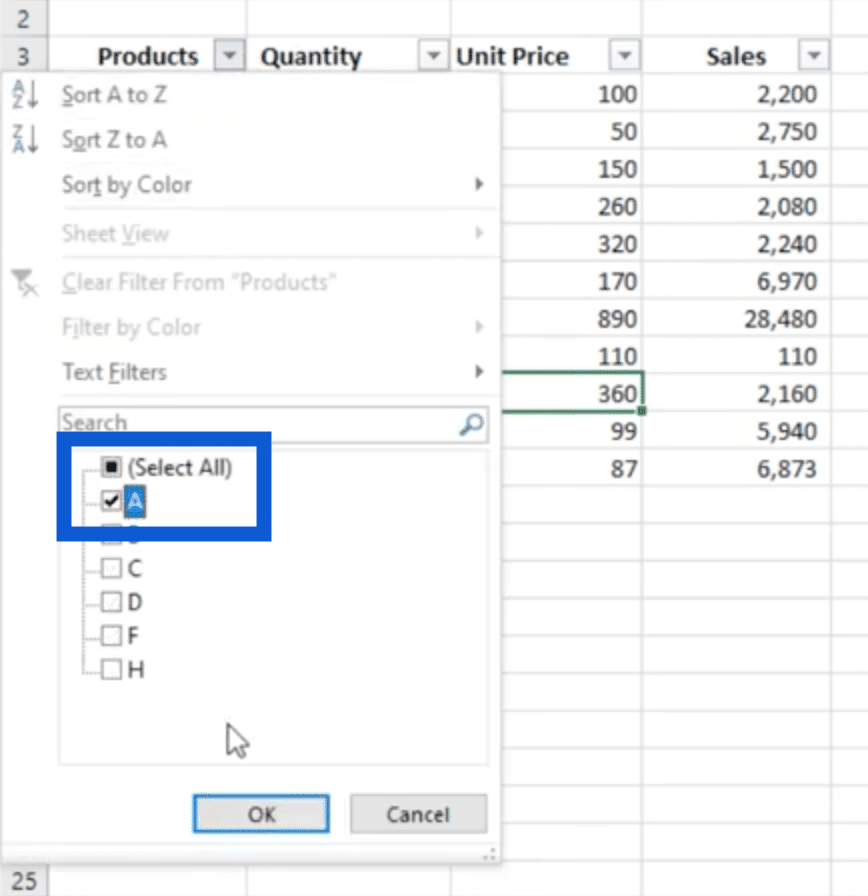
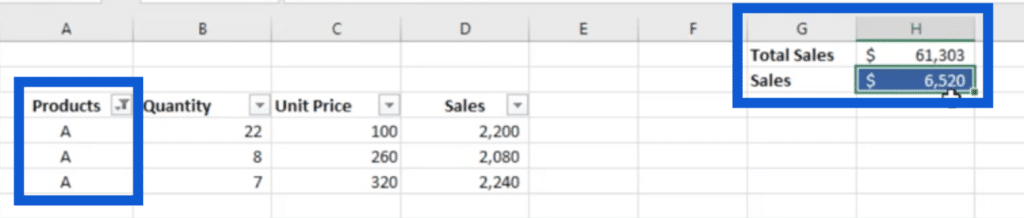
Once I click OK, the report will only show the Sales for Product A.
That’s the second part of the process, which is applying the filter to an expression. In this case, the expression is Sales.
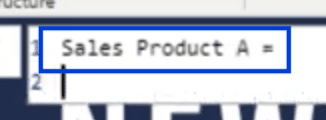
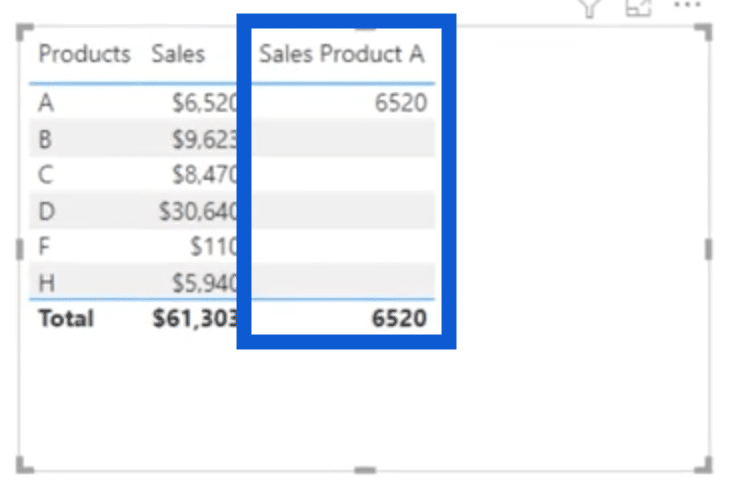
Going back to Power BI, we will need to use CALCULATE to do the same thing. Let’s start by creating a new measure for Sales Product A.
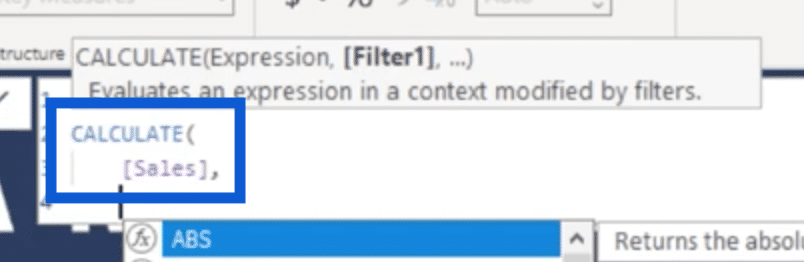
Then, we’ll use CALCULATE and apply the expression, which is Sales.
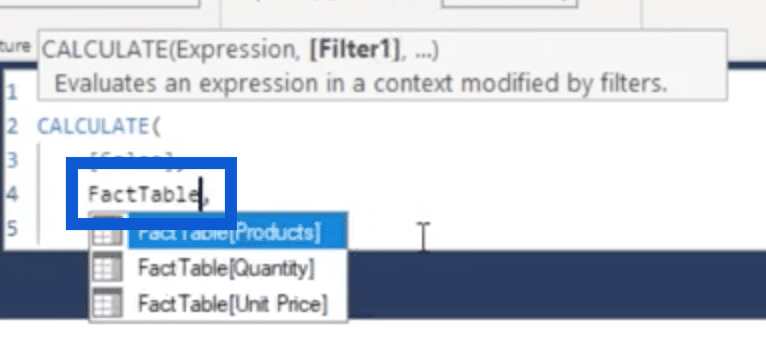
Next, we’ll modify the filter context by referencing our FactTable.
Then, we’ll have to specify that from the Products column, we only need the sales related to product A.
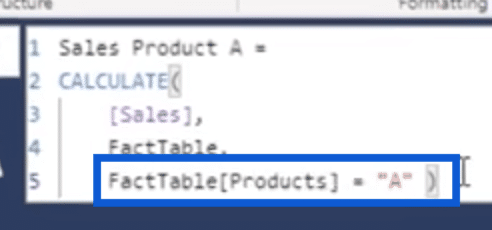
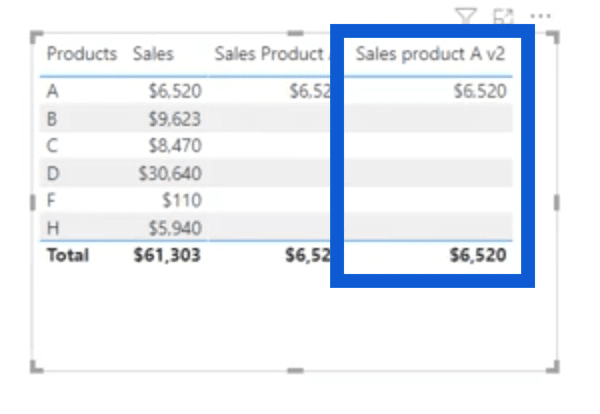
Now, we have the sales for product A, which is 6,520 – which is the same results we got from our Excel table.

Applying Filter Context Using SUMX
Although our main focus here is CALCULATE, it’s also important to know that this can also be done using other functions. For example, the filtering we did is just like using the Excel function SUMif. But when doing it on Power BI, we can use SUMX.
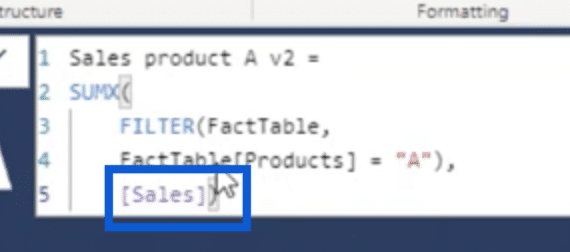
To do that, let’s create another measure called Sales Product A v2.

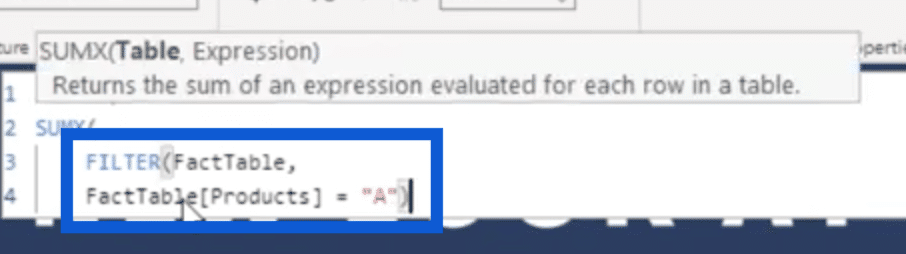
We want to go row by row to find any details about Product A, so we’ll apply SUMX. Normally, our first instinct would be to reference our FactTable because that’s where our data will be coming from.
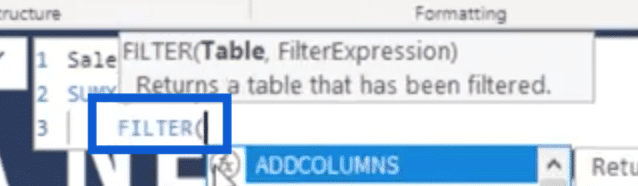
But if we do this, we won’t be able to apply any filters anymore. So instead of referencing the table first, we need to prioritize using the FILTER function. FILTER is another iterator that allows us to look at data row by row.
Once we have the FILTER function in place, that’s the only time we reference the FactTable. Then, we’ll specify what filters we want to use, so we’ll reference items from the Products column relating to product A.
Next, we specify the expression, which is Sales.
If we bring in this measure to our results, you’ll see that it shows the same Total as the previous measure we created.
Now, you’re probably asking why we need CALCULATE if there are other functions we can use. The truth is, CALCULATE has a lot more uses than what we’ve discussed so far.
Other Uses For CALCULATE In Power BI
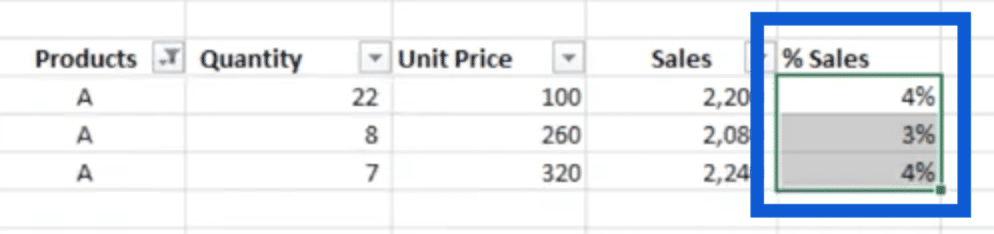
To show you other ways to use CALCULATE, let’s add another column to our dataset for percentage sales. On Excel, that means dividing the Sales by the Total Sales.
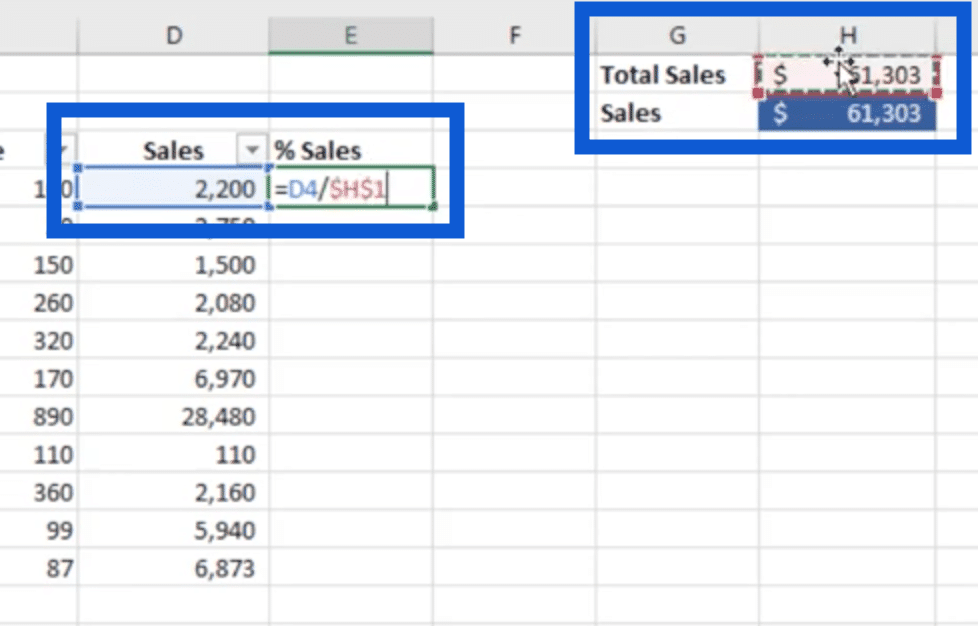
I will also have to lock the cell for Total Sales so that the same figure is applied to the rest of the cells in the column.
Once I hit Enter, we’ll see percentages that would add up to 100%.
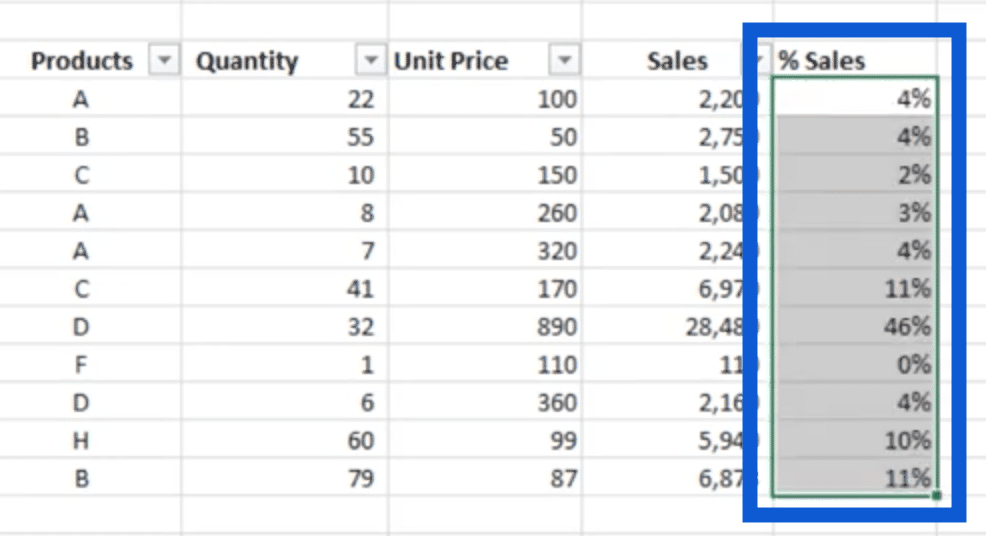
If I change the filters and only get the data for product A, you’ll see that the column for percentage sales still retains the same percentages.
When you switch to Power BI, you can do something like this through the use of CALCULATE.
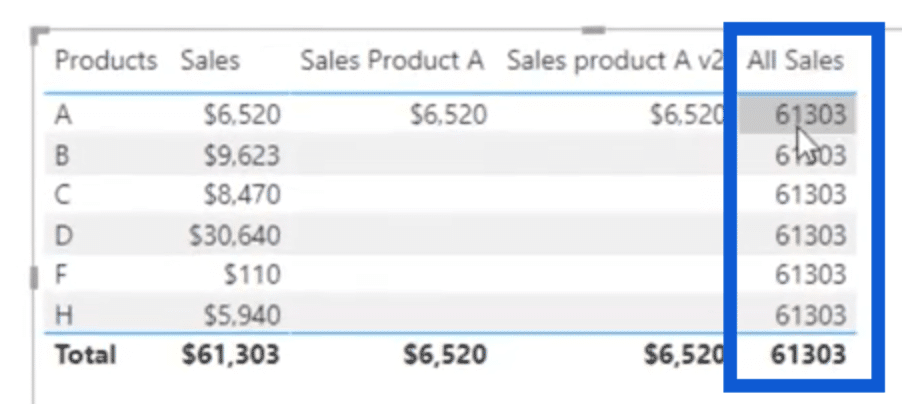
Let’s create a new measure under our key measures. We’ll start with All Sales first, which is equivalent to Total Sales on our Excel report. We’ll use CALCULATE for this.
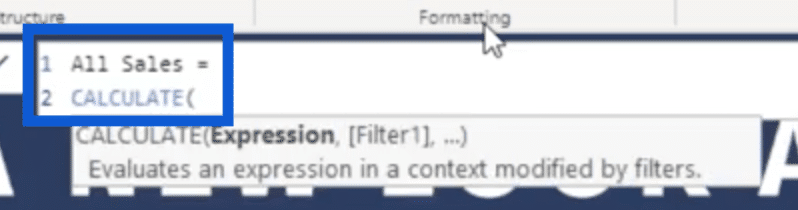
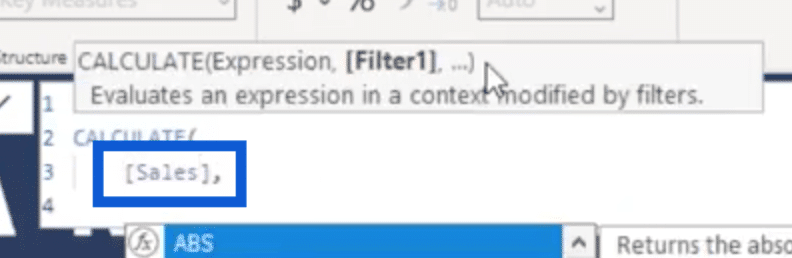
Then, we’ll use Sales as our expression.
Looking back at our Excel table, remember that we had to lock the cell containing Total Sales to make sure that despite the filtering, we will still be using the same Total across the entire column. In our Power BI report, we’ll use ALL to do that.
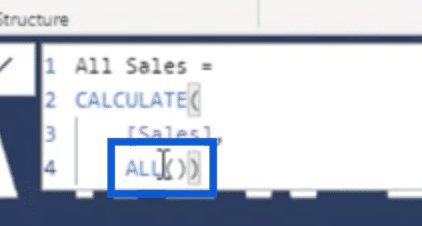
Once I click enter, we bring in all the sales for all the products.
This makes it easier to get our percentage sales. So let’s create another measure for that.
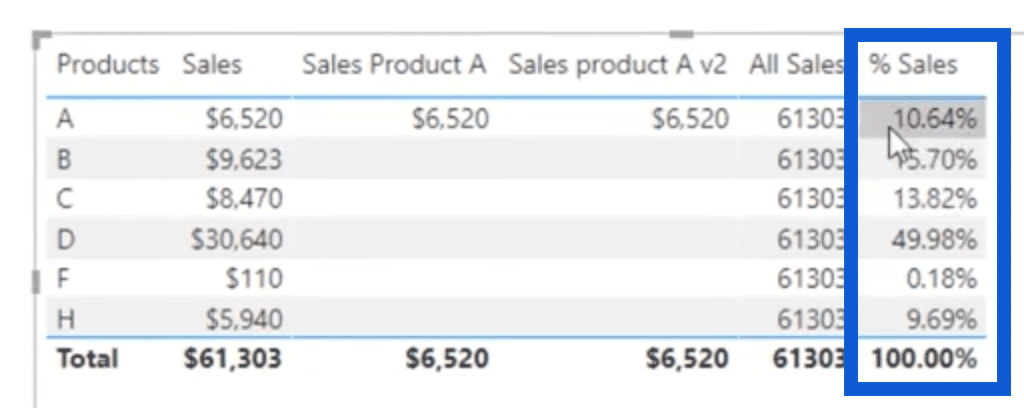
Then, we’ll use DIVIDE, again dividing our Sales with All Sales the same way we did in Excel.

Once we hit enter, we’ll have our percentage sales, which adds up to 100%.

Conclusion
These are just some of the many uses of the CALCULATE function. In fact, it can also be used in time intelligence calculations.
You can go through our other tutorials that show these other uses. It is basically one of the functions that we can’t do without if we want our reports to show as much insight as possible.
All the best,
Mudassir
[youtube https://youtu.be/LLgkuW_jCts?rel=0&w=784&h=441]
***** Related Links *****
Power BI CALCULATE: Key To Advanced DAX Formulas
Using Calculate Function Inside Power BI
Calculate Percentage Margin In Power BI Using DAX
***** Related Course Modules *****
DAX Formula Patterns
Mastering DAX Calculations
Time Intelligence Calculations
***** Related Support Forum Posts *****
CALCULATE Function With Several Filters
Calculate Function Not Working
How To Utilise A Boolean Expression Within The CALCULATE Function
For more on CALCULATE function, please see here…


