
In this blog post, I’ll go over problem #2 from the ongoing Problem of the Week at the Enterprise DNA forum, where we discussed how to sort messy data into a clean dimension table. This is the second iteration of this new initiative that we’re hosting at Enterprise DNA. I’m especially passionate about this series because it provides everyone the chance to get more practice on a regular basis. You can watch the full video of this tutorial at the bottom of this blog.
On the first Wednesday of each month, there’s a DAX challenge and on the third Wednesday, there’s a power query challenge.
This is a great opportunity to explore, discover, and learn new things about these languages that you need to leverage inside Power BI.

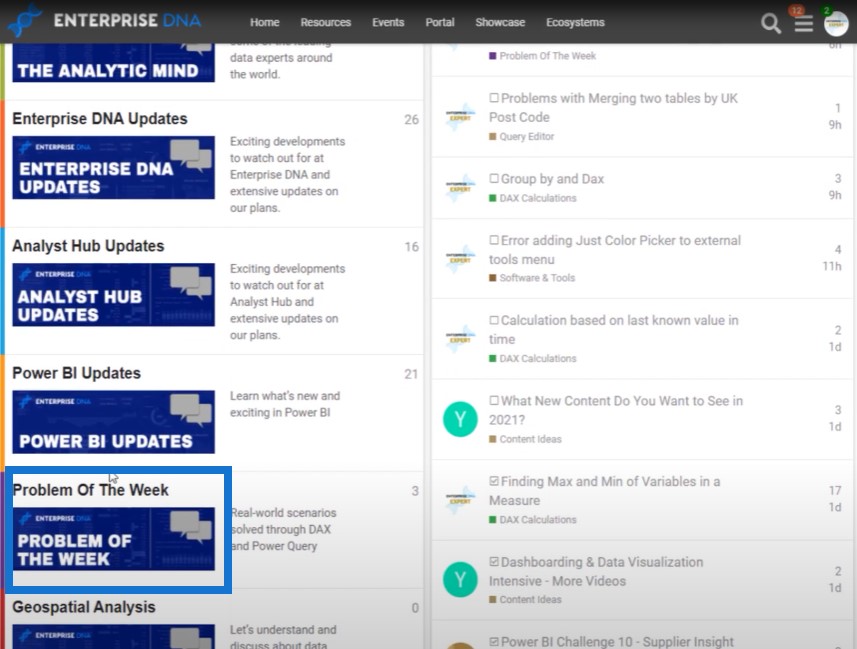
You’ll find a category on the Problem of the Week at the Enterprise DNA forum.
The primary focus is all about the process and not so much on the outcome.
If you’re successful in breaking down a problem into smaller pieces, you’ll be able to solve any problem that you’re faced with.
Melissa de Korte
Brian previously spoke about a technique called rubber duck debugging. If you missed that, be sure to check out his video. It can help you when you get stuck on these challenges.
First, let’s examine the task at hand. We have a messy text file that we need to transform into a proper dimension table.
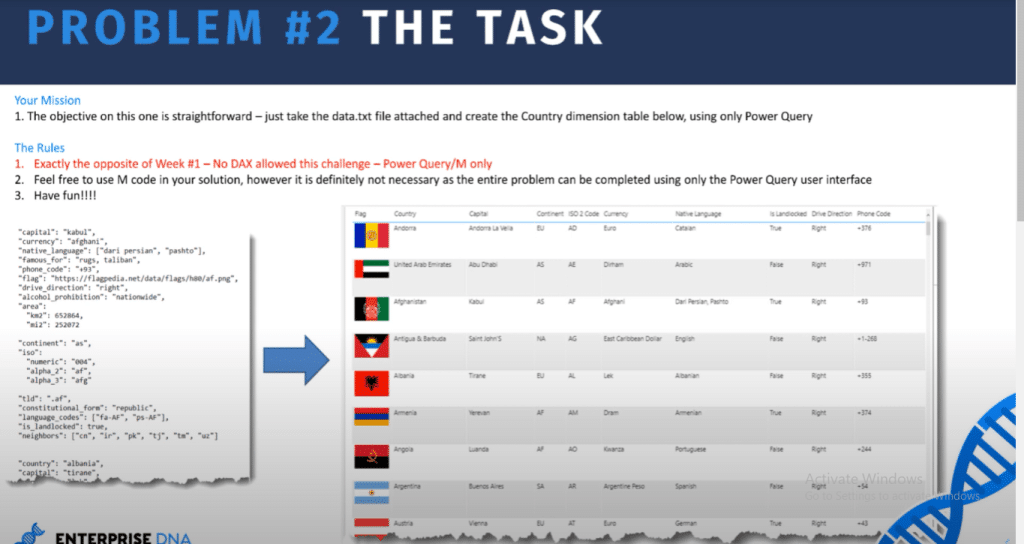
Now, when I look at data like this, for the most part, it’s going to be all about text cleaning, removing unwanted characters, trimming, capitalizing words, and so on.
But we also need to retrieve all the rows from this stack data and turn it into a single line for each country. I’m calling it stack data because all the field names are repeated in a single column for each country.
I have some experience in Excel, and one of its most powerful features in my view is pivot tables.

Pivot Tables In Excel
Pivot tables let me view data segment by segment. Depending on what you place on the row section, a pivot table condenses each occurrence of that segment into a single line.
You can then split that up even further by dragging fields into the column section.
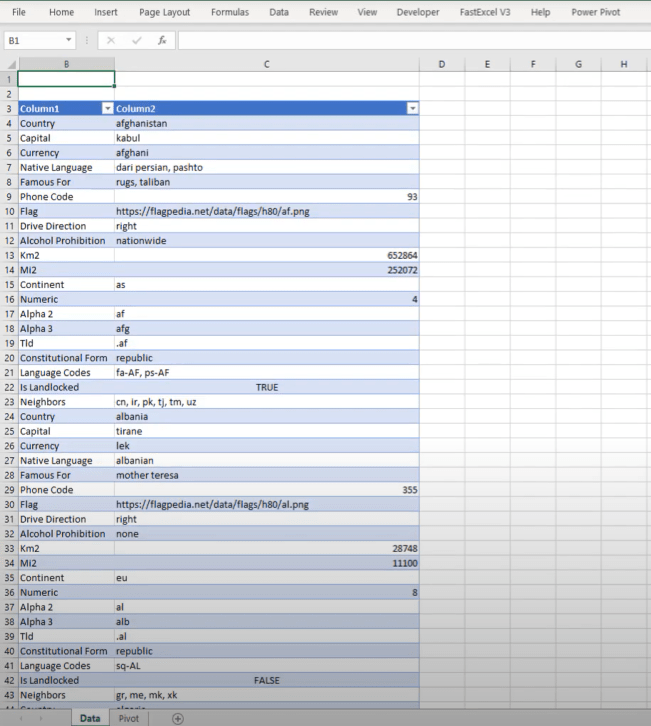
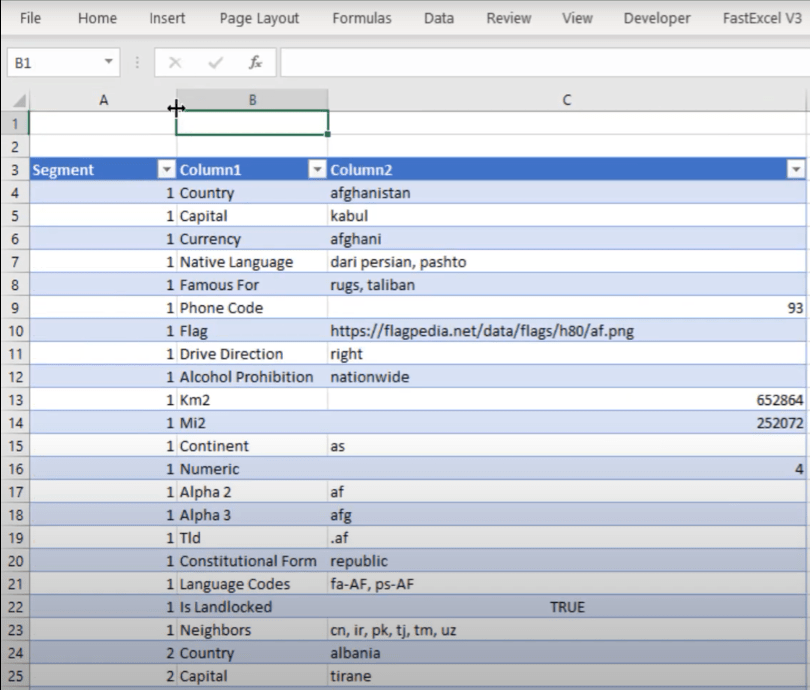
I’ve created an example of what this looks like. Here, we have pretty much the same data that we had in the text file.
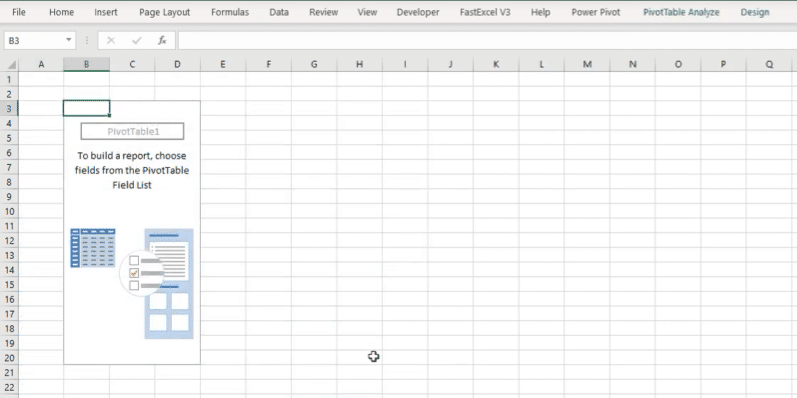
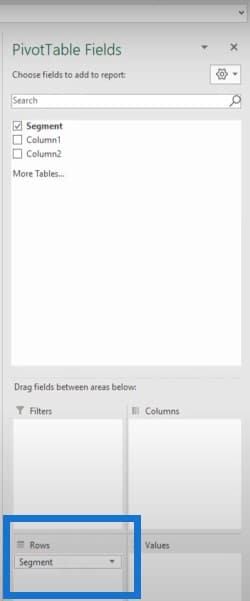
And on the next page, I’ve created an empty pivot table.
Now, what I didn’t show you is that I have three columns here instead of the two that I’ve already showed you.
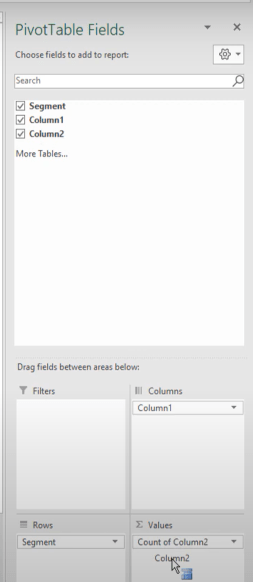
I’m going to drag my segment to the rows.
Since Column 1 had the field names, I’m going to drag that to the column section.
Column 2 had all the field values, so I’m going to drag that into the value section.
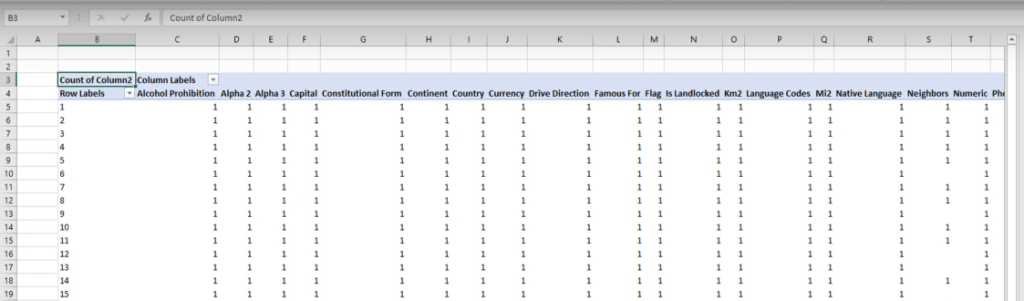
We can see here that the pivot tables can’t handle text strings. It counts them, but it does show that we have a single value for each field.
Now let’s take a look at that segment that I created. So I’m going to go back to the Data and I’m going to unhide my column. You can see that it’s just an index number, identifying each of the separate blocks of the data that are still stacked on top of each other.
So for me, the key transformation will be a pivot of the data to get it back into that tabular format.
In the forum, I’ve seen other ways of dealing with this. There are other ways to get to a tabular format aside from using a pivot action and they work equally well. If you’re interested in that, go to the forum and start exploring.
Using Power Query To Create Dimension Table
Let’s go over the power query and review my solution.
Personally, I think the UI does a great job of writing the bulk of the M code for us. So I tend to design my queries using the user interface as much as I can.

Once the query does what I needed it to do, I’ll go into the advanced editor and examine the M code to see if I can modify it. Let’s see what that looks like.
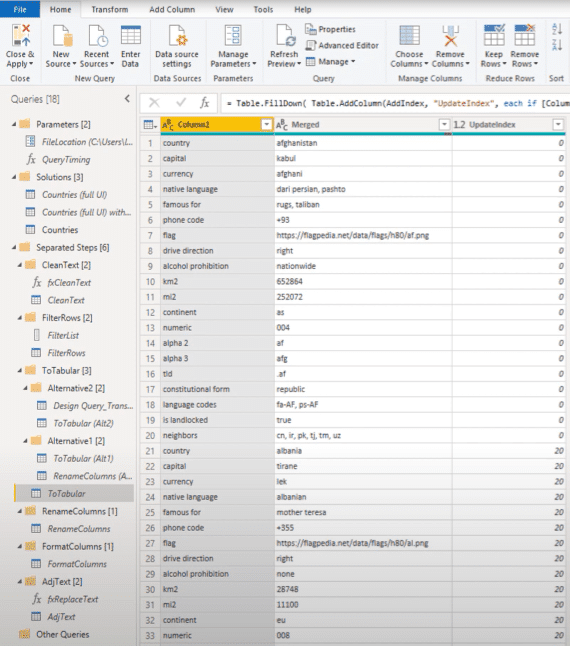
This is my base group that is built using the user interface.
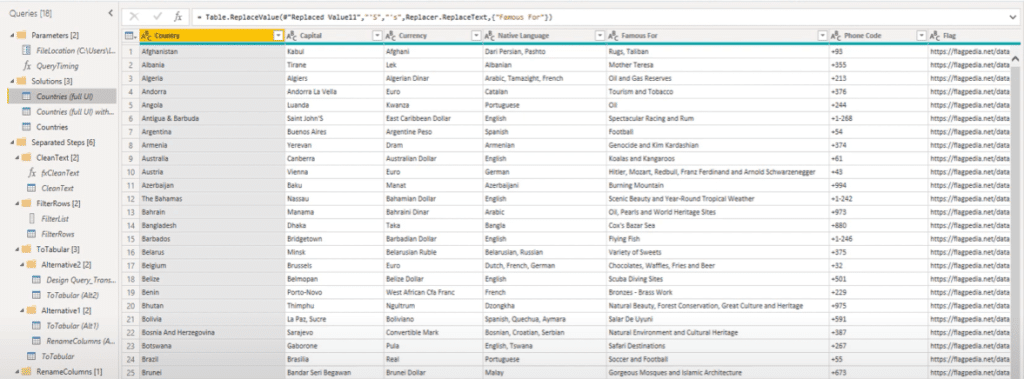
You can see that there are a lot of steps in the applied steps on the right hand side.
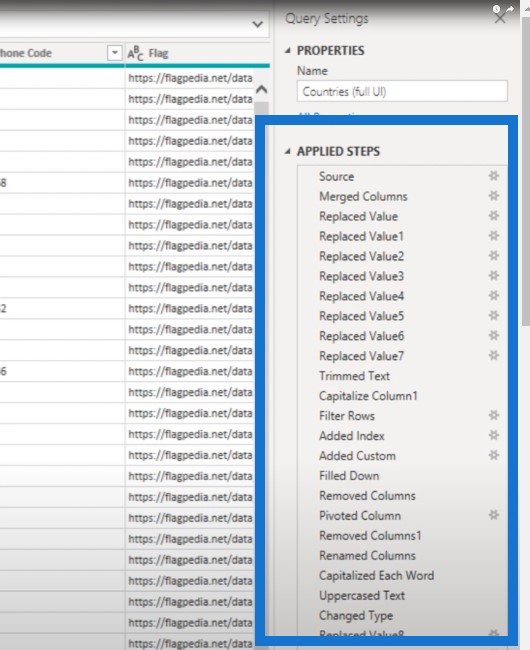
Now that in itself is not a problem, but just by looking at these steps, you can see that there are a lot of transformations that can be grouped together.
Let’s open the advanced editor.
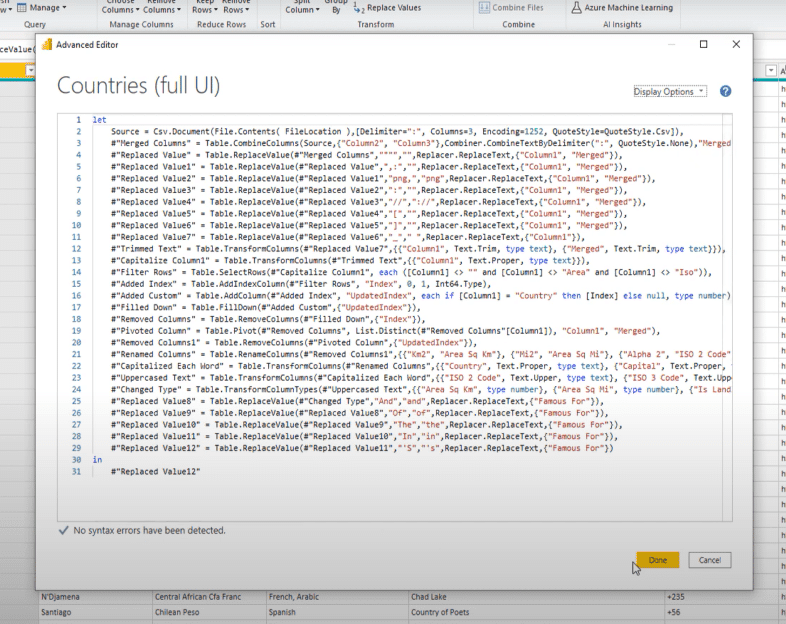
We see that this query has 31 steps.
I also added some comments to this same query containing the 31 steps, but I broke it up into sections.
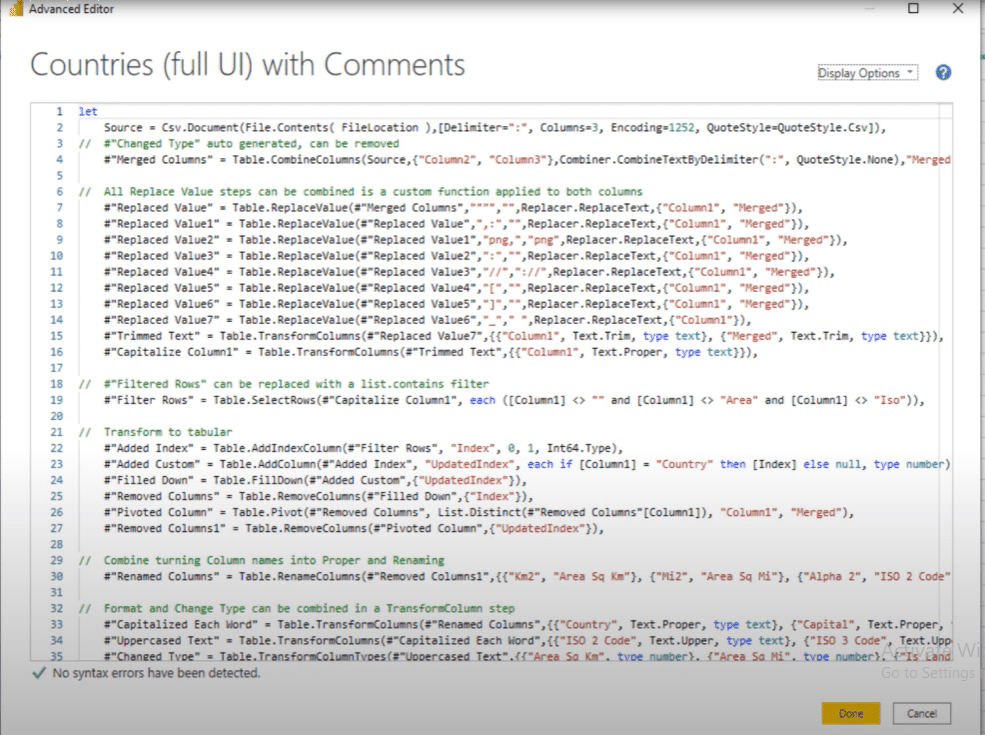
The first thing I did was to remove the change type step. I suggest creating a custom function to do all of these text transformation steps.
There are a lot of comments here, but there are only two things I want to highlight in this blog post. First is the custom function for text cleaning purposes.
The second is the pivot step to turn this type of data back into a proper tabular format.
Custom Text Cleaning Function
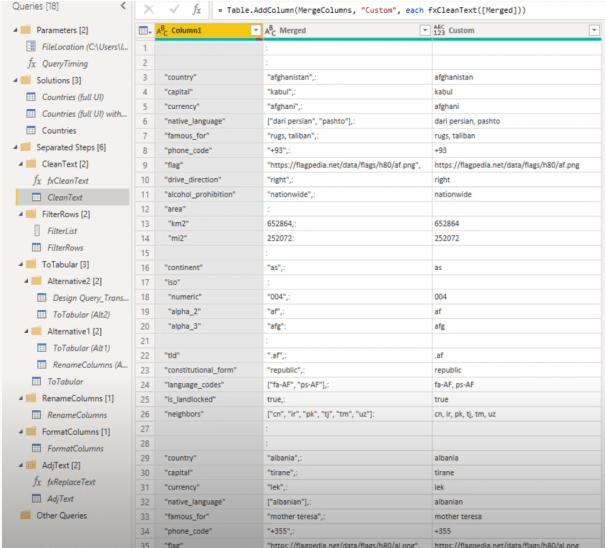
Let’s go back to the early stages of building out my query, where I had all those grouped steps to clean up these texts: column 1 and the merged column.
I also added an additional custom column. Its sole purpose is to build out my custom text cleaning function. I invoked that on the merged column.
This way, I don’t have to write the function in one go, but build it up gradually one step at a time, adding a new transformation after reviewing the results from the previous step.
Let’s look at the M code for the text cleaning function.
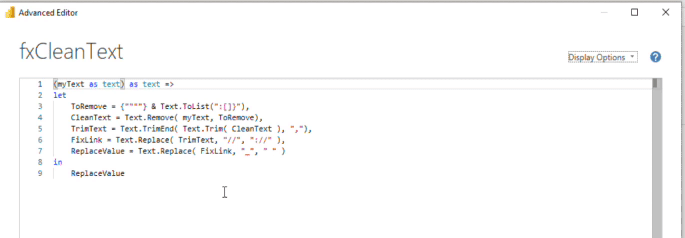
As you can see, I have multiple steps. When I was building this text function, I went back and forth between the query to look at the results to see what to build and what to correct next.
With this result, I performed all the transformations that I needed. Some of the M functions that I used here were provided by the user interface when I built my initial query, like the Text. Trim function. However, the other functions used were not.
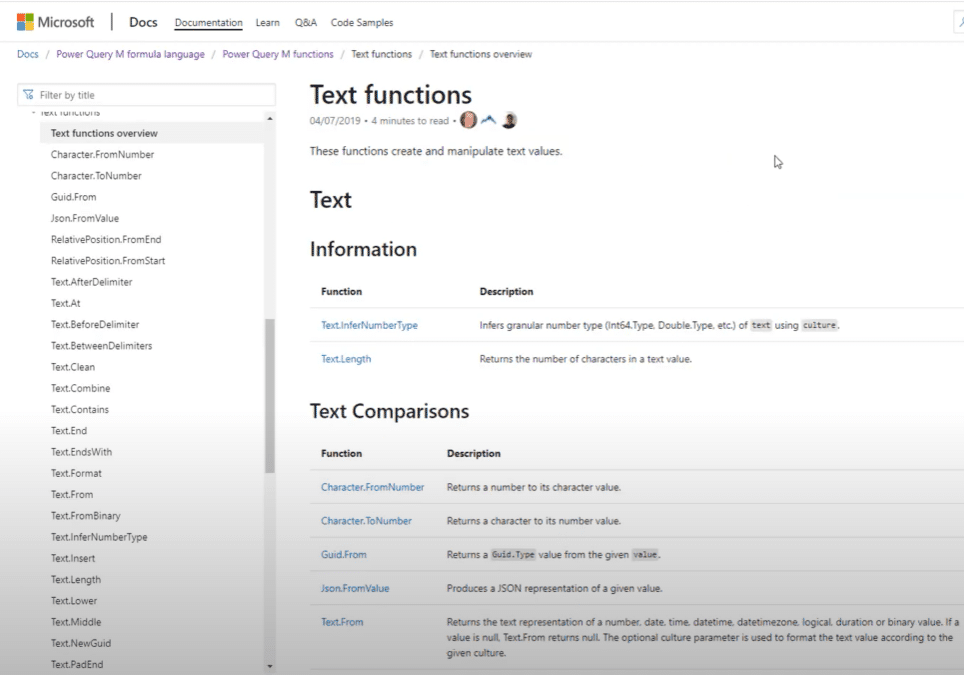
If you’re not familiar with them, you can look up all the M functions in the M formula guide online. This is the link where you need to go.

You will find a section dedicated to power query and functions.
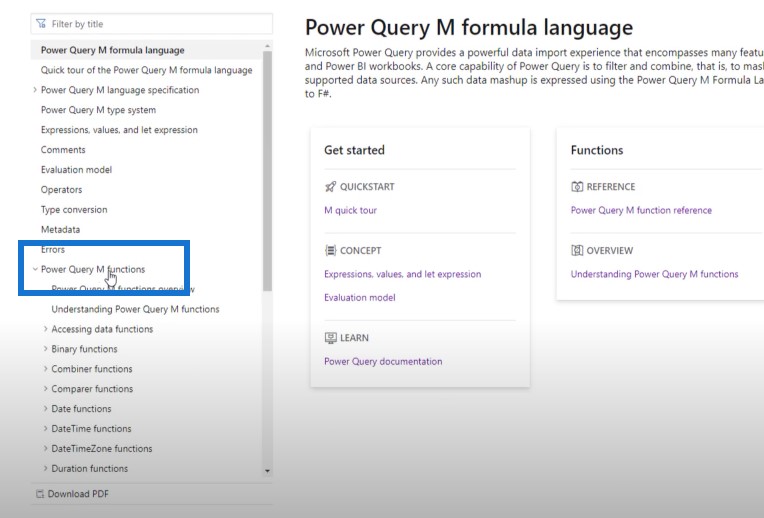
If you scroll down, you’ll find the section on text function and each section starts with an overview. There’s a list of all the text functions inside the power query and formula M language.

If you’re looking for a specific transformation, you can look that up right here.
Pivoting The Data
The second part I wanted to highlight while creating this dimension table is the pivoting of the data itself. Let’s take a closer look at this as well.
I started by adding an index. I updated that index to properly segment the blocks of data. I did this by returning the index number for each line where it had the text country in column 1, and then I filled that value down.
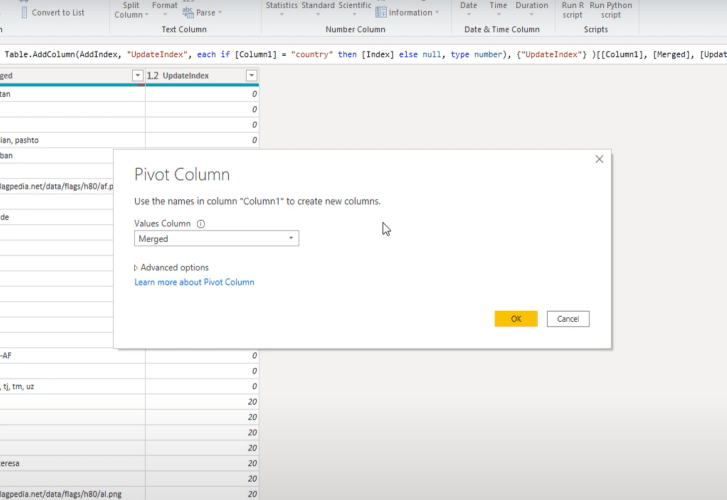
All we need to do is pivot the data itself. On the transform tab, you’ll find the Pivot Column. With Column 1 selected, click on Pivot Column.
It’s going to use Column 1’s values as the new column name. It also wants to know where the values for those field names are. Those are in our merged column.
If Excel can deal with text values, Power Query can also because of its advanced options setting. All we need to do is select Don’t Aggregate for it to be able to handle text values.
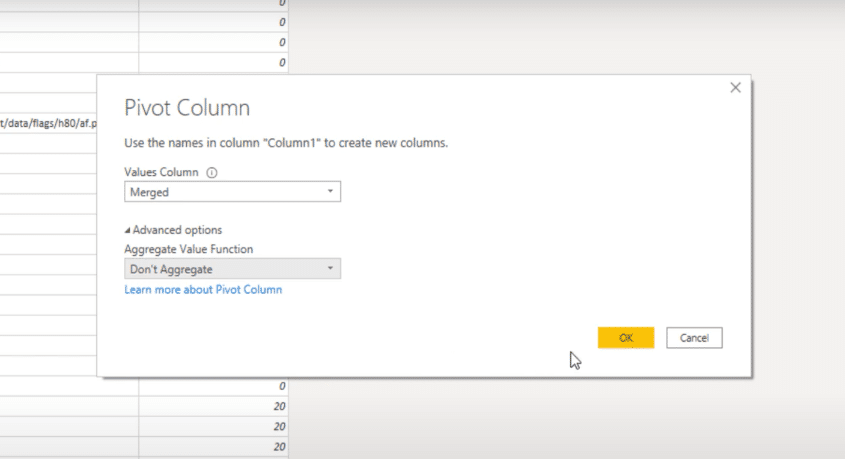
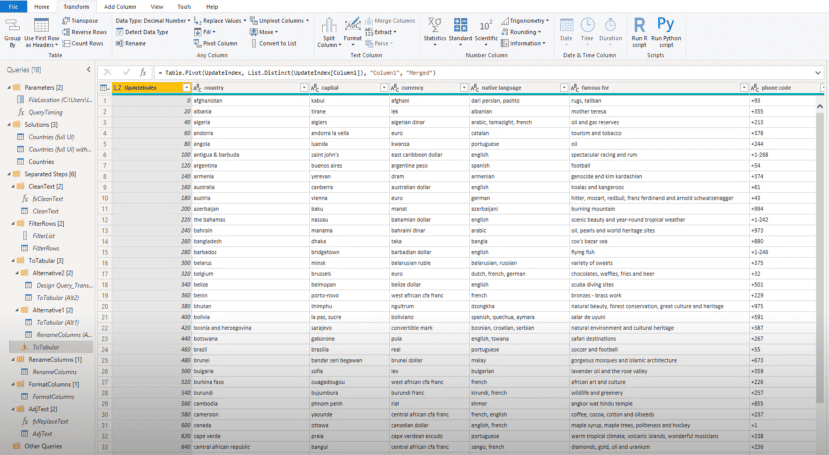
Once we click on OK, we can see that our data has been pivoted.
***** Related Links *****
Beginners’ Guide To The M Code In Power BI
How The Query Editor Works In Power BI
Unpivot Multiple Columns Dynamically In Power BI
Conclusion
The image above is the final result query. I do hope you’ve enjoyed how we’ve reshaped the messy data in the provided text file and turned it into a clean dimension table that’s suitable for analysis.
If you’ve enjoyed this blog post, please subscribe to the Enterprise DNA channel so that you don’t miss out on any new content.
I hope to see you all in future Problem of the Week challenges.
Melissa


