
In this tutorial, you’ll learn about the TABLE keyword in DAX Studio. The TABLE keyword allows you to create tables inside your DAX query.
This is a continuation of a series of tutorials on the different keywords that you can use when creating DAX queries. Before diving into this topic, make sure to read first on the DEFINE and MEASURE keywords.

Getting Started With Tables In DAX Studio
To use this keyword, first write DEFINE followed by TABLE. Then, provide the name of the table you want to create. In this example, the table’s name is ModelStats.
A specific function is used for this query: the COLUMNSTATISTICS () function. This function can be used to quickly create metadata on every table in your data model. This function is not available in the DAX in Power BI; it’s entirely unique to DAX Studio.
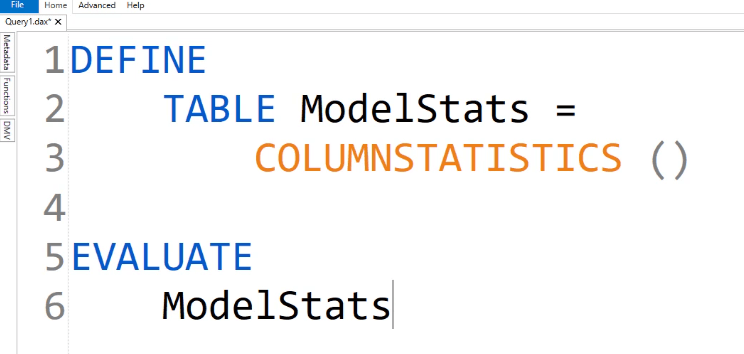
To view the table, write EVALUATE ModelStats.
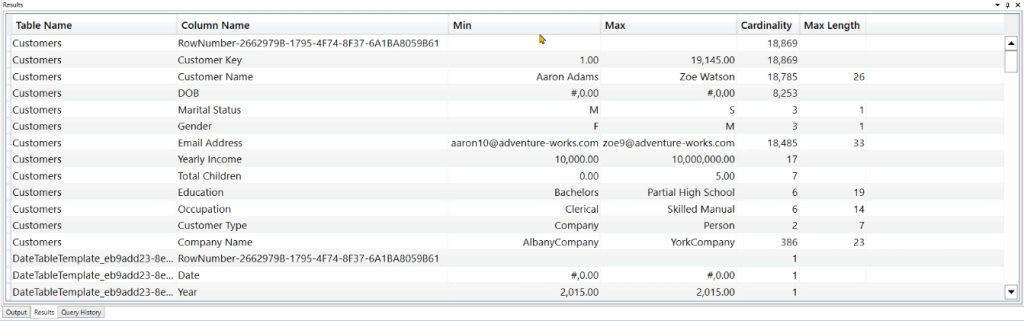
After you run this query, you’ll get a table showing all the tables and statistics of each table in your data model.
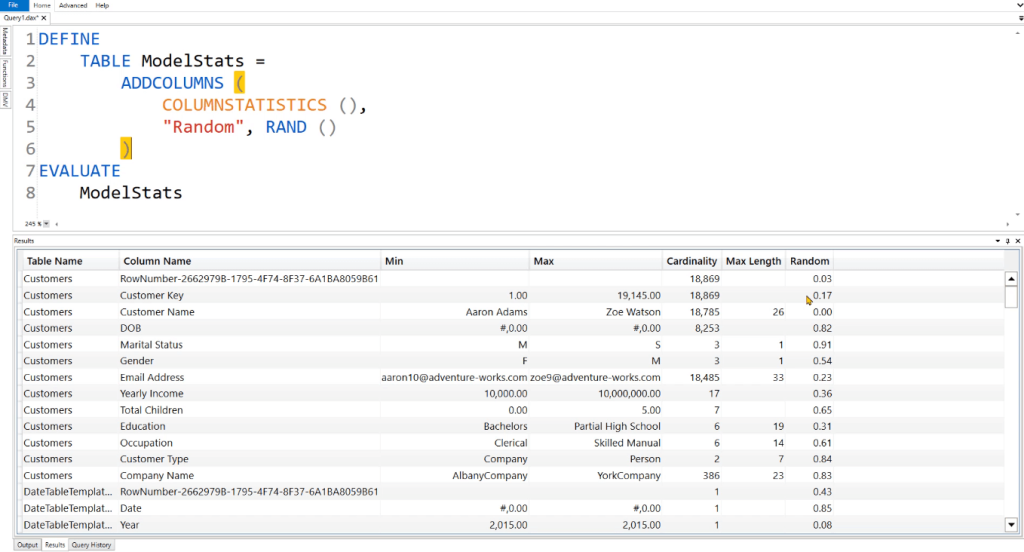
You can also add another column by using the ADDCOLUMNS function. In this case, the column’s name is “Random” and it shows random numbers generated by DAX Studio using the RAND function.
Creating A Table For Different Products In DAX Studio
Let’s go into a more realistic example. This is the same example used in the MEASURE keyword tutorial. It’s focused on a hypothetical business with “trendy” and “boring” products.

In this case, the goal is to segregate the Products table into 2 categories. The first table is for the TrendyProducts, while the second is for the BoringProducts.
For the TrendyProducts table, first DEFINE what are TrendyColors. In this instance, they’re Red, Blue, and Pink. Then, you need to inject that filter into the filter context. To do so, you need to use the CALCULATETABLE function.
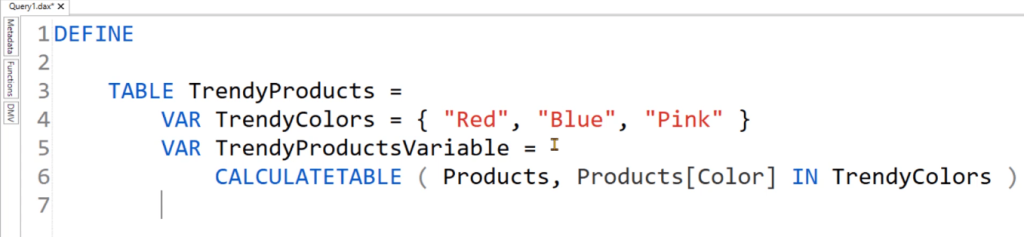
Notice that the VAR function is used. This is to differentiate between the variables and the name of the table.
Next, create a variable for the Result. For this variable, create a new column using the ADDCOLUMNS function and name it “Description.” The Description column will identify which rows belong to the Trendy Products. Then, RETURN the Result.
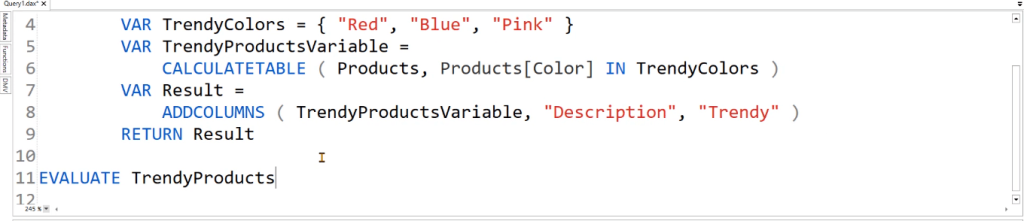
To view what the new table looks like, write EVALUATE TrendyProducts. Then, run the DAX query by clicking Run or by pressing F5.
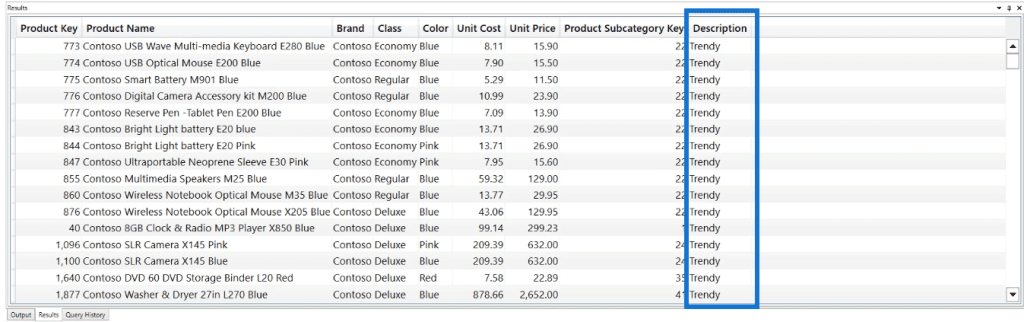
You can see that the table is returning 383 rows that are marked as Trendy Products.
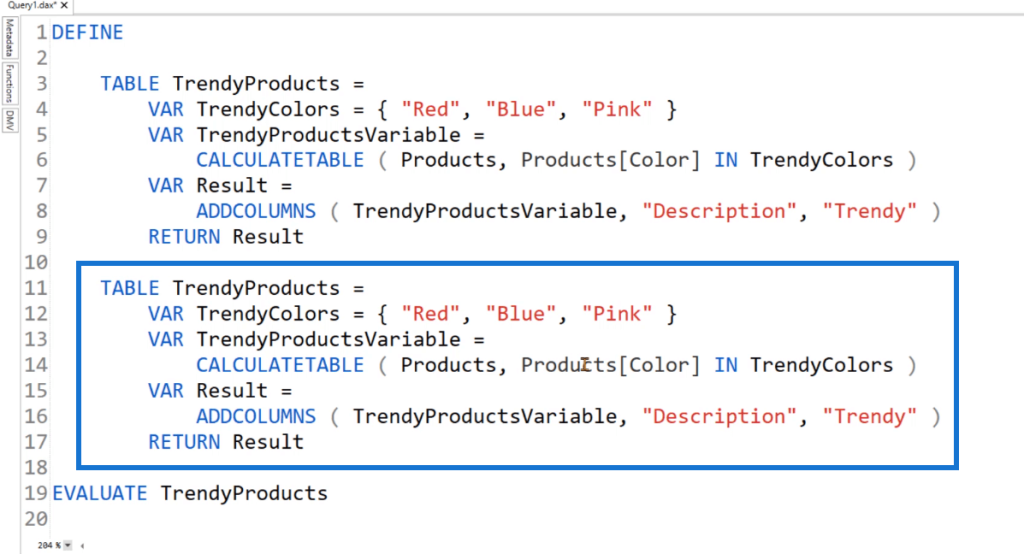
Now the same logic also applies for the BoringProducts table. You can copy the code and paste it after RETURN.
So instead of TABLE TrendyProducts, replace it with TABLE BoringProducts. For the CALCULATETABLE argument, write the NOT function. And then, change the column name to “Boring.”
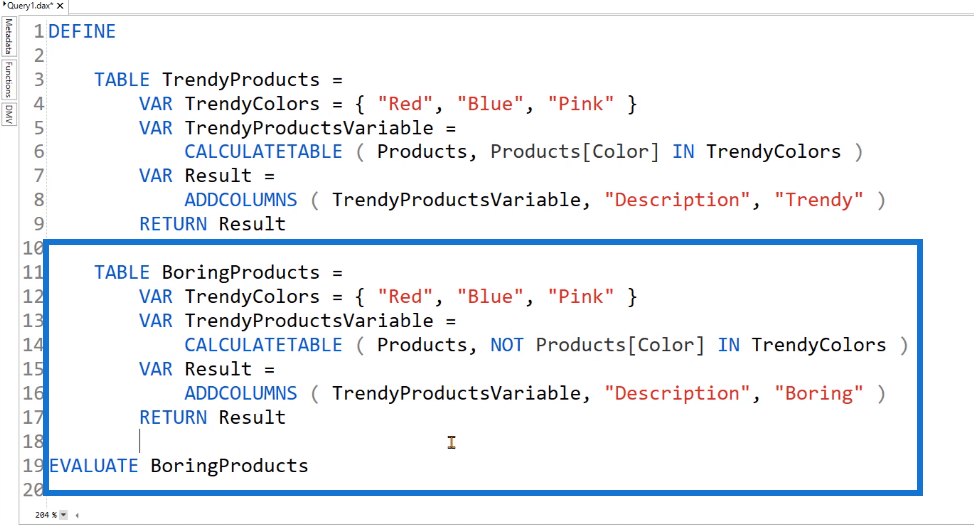
Next, EVALUATE the BoringProducts table to view it.
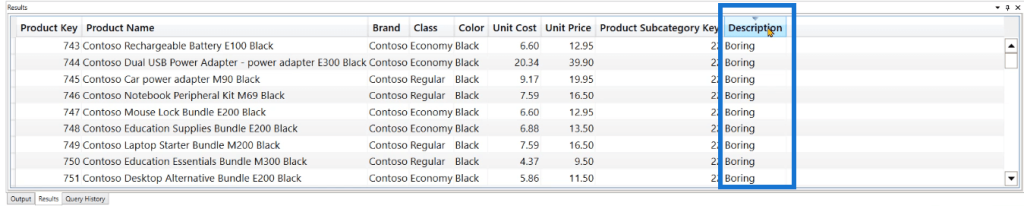
You can see that the boring products return 2,134 rows. You can also see in the Description column that it only contains “Boring.”
Joining Two Or More Tables Together
The next thing you can do is join these two tables together using the UNION keyword.
Now, one would think that you can just write a new TABLE keyword with the UNION function to combine the two tables together.
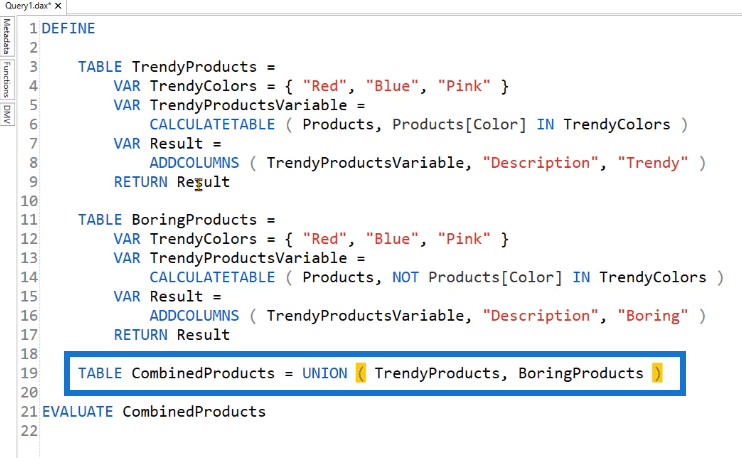
However, it isn’t possible for this case since the BoringProducts code contains the TrendyProducts table. If you attempt to run this query, you’ll get an error.
You can’t use a query table within another query table in DAX Studio.
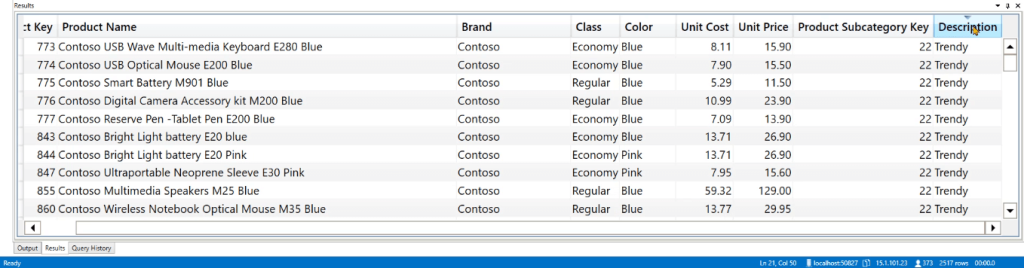
Instead, you should place the UNION syntax after EVALUATE.
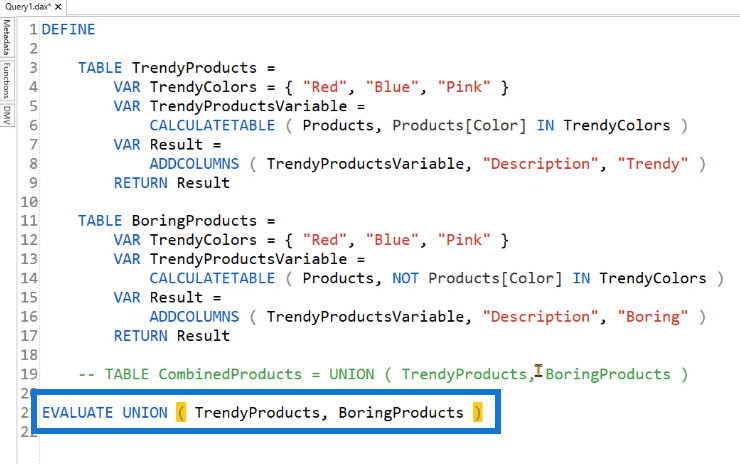
If you run this, you’ll get a table containing both the Trendy and Boring products. You can see that this table contains 2517 rows.

Creating A Dates Table In DAX Studio
This next example shows how to create a Dates table in your data model. Open a new blank query. Before anything else, let’s first try out the TABLE keyword with the CALENDAR and DATE functions. This query is simply evaluating the dates in between January 1, 2007 and December 31, 2007.
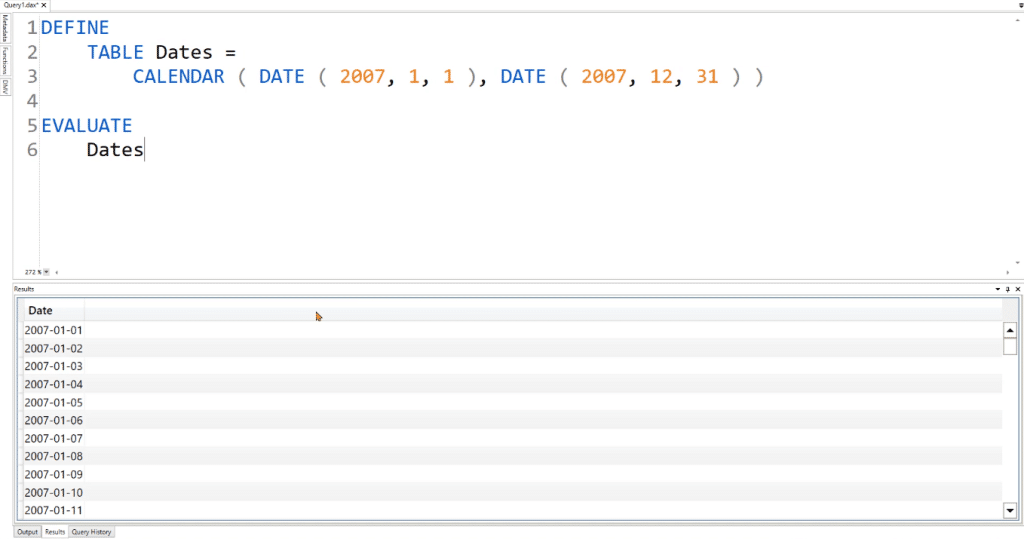
You can see that the results show all the dates in between what was specified in the query. To create more columns in the Dates table, use the GENERATE function over the current CALENDAR code. Then, use the ROW function to segregate different data within the Dates table.
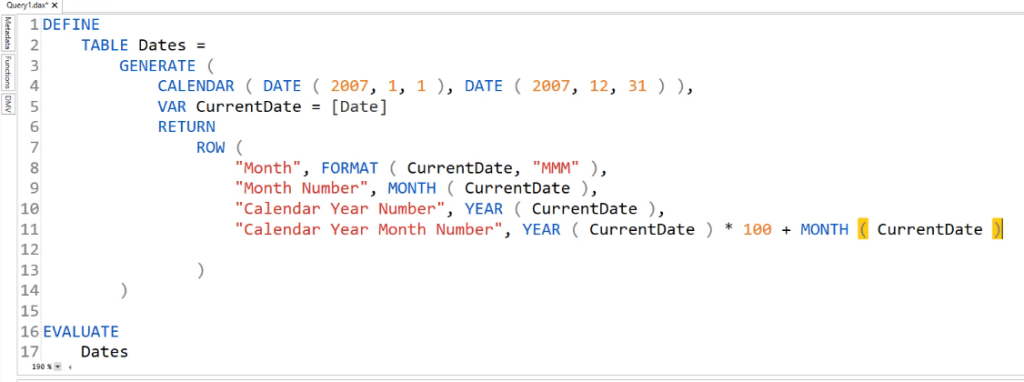
The [Date] column used in this query is from the CALENDAR function. Notice also that a variable VAR CurrentDate is used. This variable stores the value that’s being accessed from the row context. That value is then returned inside the row function.
This is done to simplify the code. So instead of using the [Date] column reference, you can use the variable you declared. You can add more columns in your Dates table according to your needs.
Using TABLE With SUMMARIZECOLUMNS
Another thing you can do with the Dates table you created is adding in the SUMMARIZECOLUMNS function.
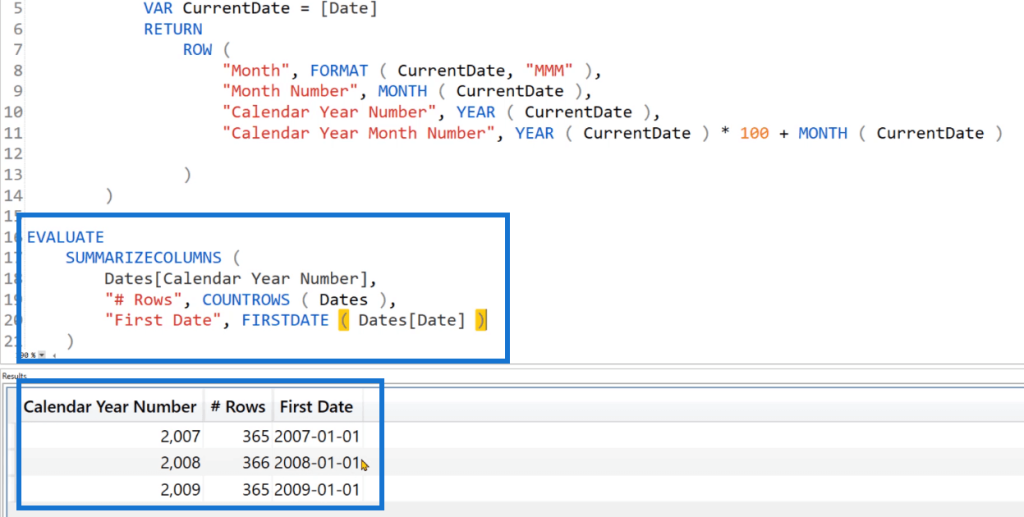
After EVALUATE, use SUMMARIZECOLUMNS and then COUNTROWS to count the number of rows belonging to your Calendar Year Number.
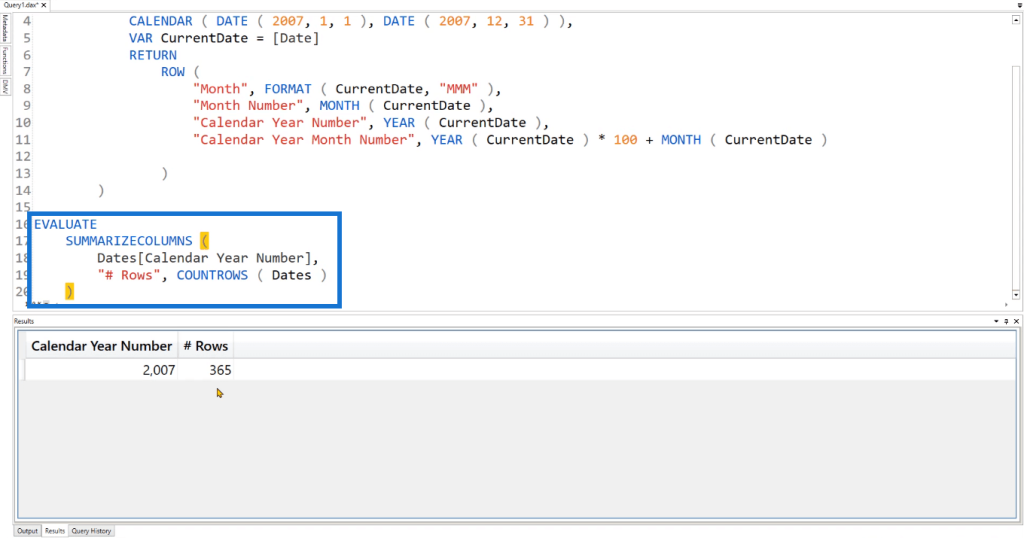
After you run this, you can see that the table reports 365 rows belong to the year 2007. You can try and experiment with your current query.
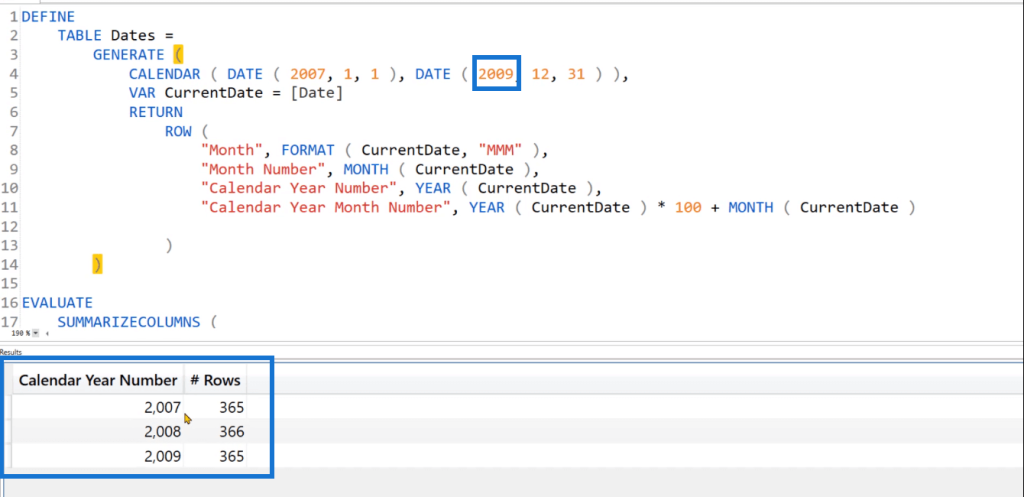
For instance, you can change the upper bound of the end date from 2007 to 2009. If you run this, you’ll see that the table now shows rows for the years 2007, 2008, and 2009.
If for example, you want to add another column that shows the first date of the table, use the FIRSTDATE function.
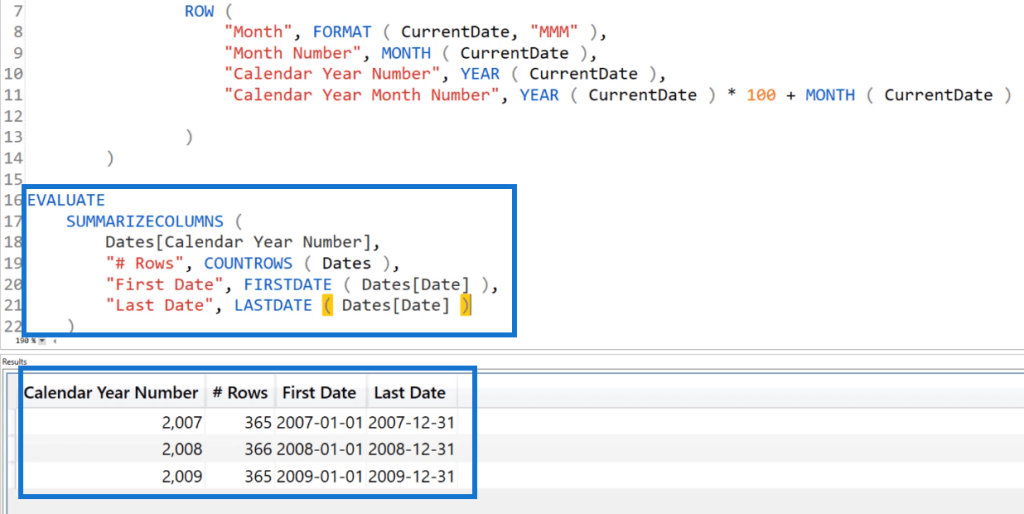
Similarly, use the LASTDATE function to identify the last date of each row.
To get the Total Rows in your Dates tables, use the CALCULATE function with COUNTROWS. And then, use REMOVEFILTERS to remove the filter context from the Dates table you created using SUMMARIZECOLUMNS.
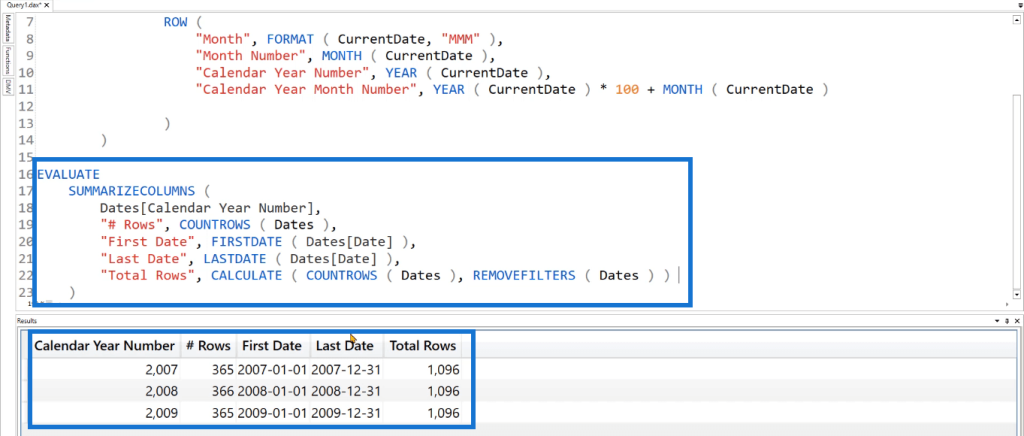
After running the query, you can see that there’s a new column showing the total count of rows available in the Dates table.
***** Related Links *****
Configure Query Settings In Power BI DAX Studio
Optimizing DAX For Power BI Using DAX Studio – Formula Engines
Power Query: How To Merge Tables W/ Different Columns
Conclusion
Along with DEFINE and MEASURE, the TABLE keyword is vital when creating queries in DAX Studio. It helps simplify the process of creating tables.
This tutorial shows basic examples of how to use the TABLE keyword. It’s important to learn the basics as this helps in understanding more complex queries which are more common when real-world applications are involved.
Enterprise DNA Experts


