As you progress in Power BI, you will gradually be working with more DAX measures and calculations, and things can easily get cluttered. For today’s tutorial, I will share a few data modeling techniques on how to organize your DAX measures better for a more efficient workflow. You can watch the full video of this tutorial at the bottom of this blog.
Data Modeling Techniques: Organizing DAX Measures Better
Typically a lot of people will take their measures and put that on their Fact or Sales table. Instead, we’re going to organize the measures into a new dedicated DAX table or folder that is going to sit at the top of our Fields list.

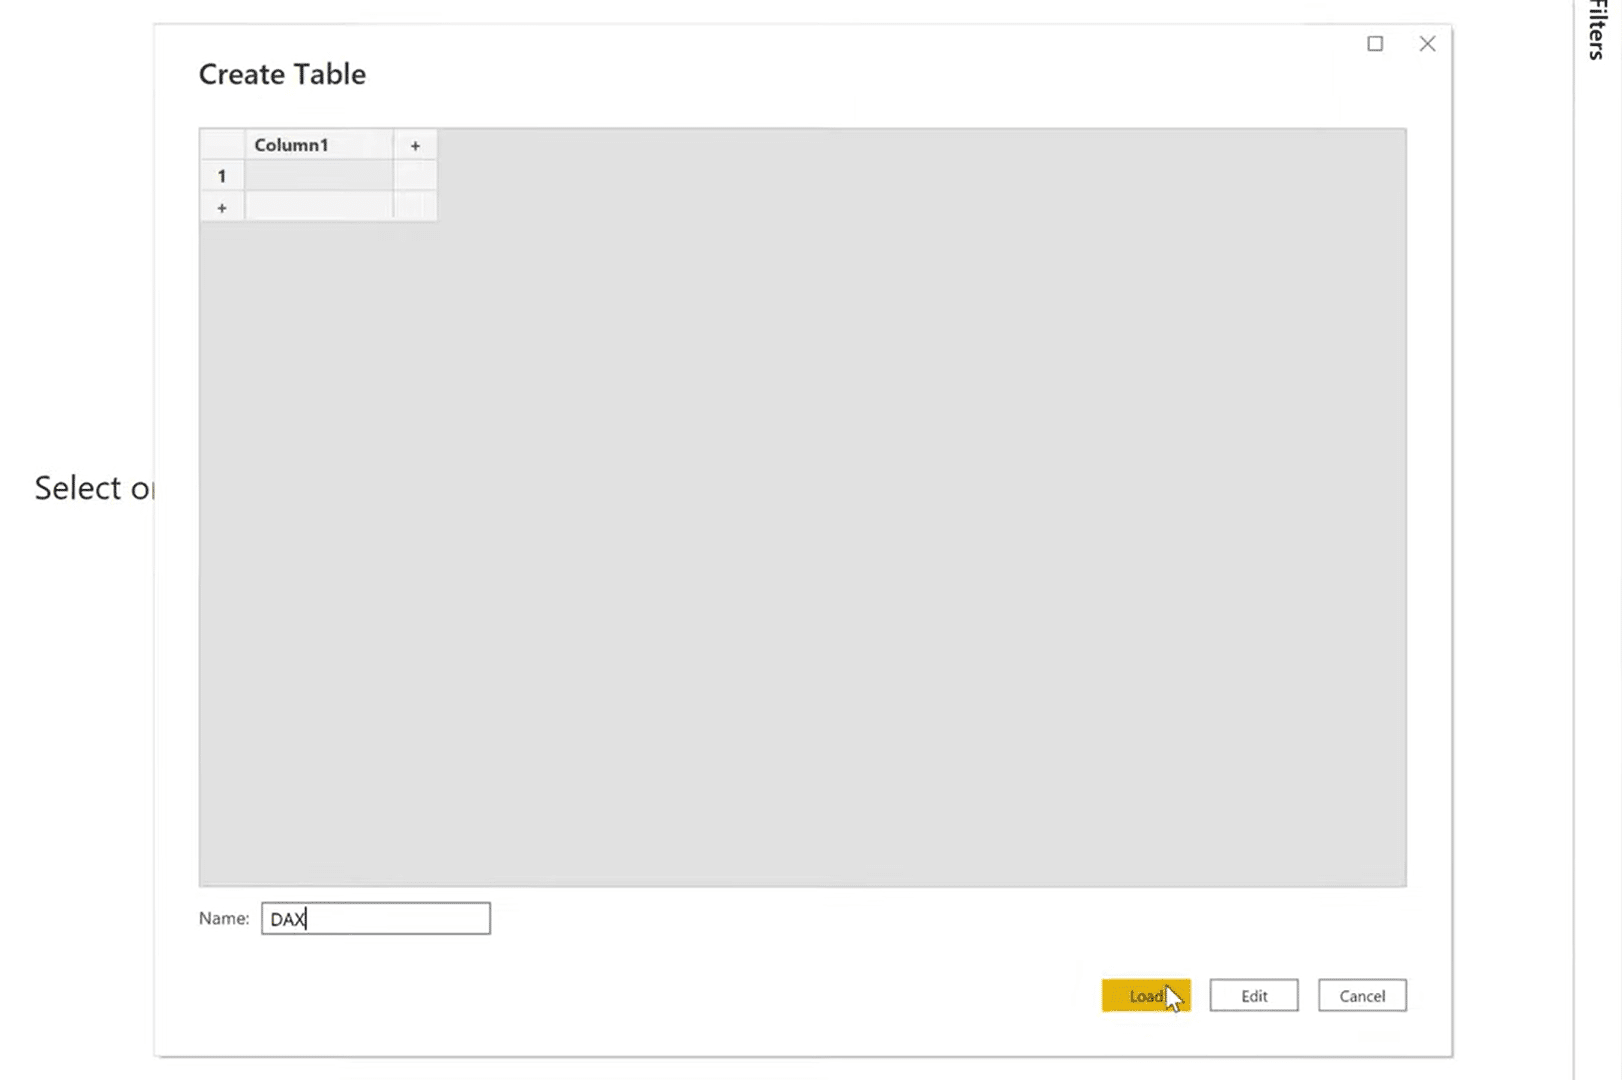
To do that, we’re going to go Enter Data under the Home ribbon. We’re going to leave this completely empty and the only thing we’re going to do is name this as DAX for the table name and select Load.
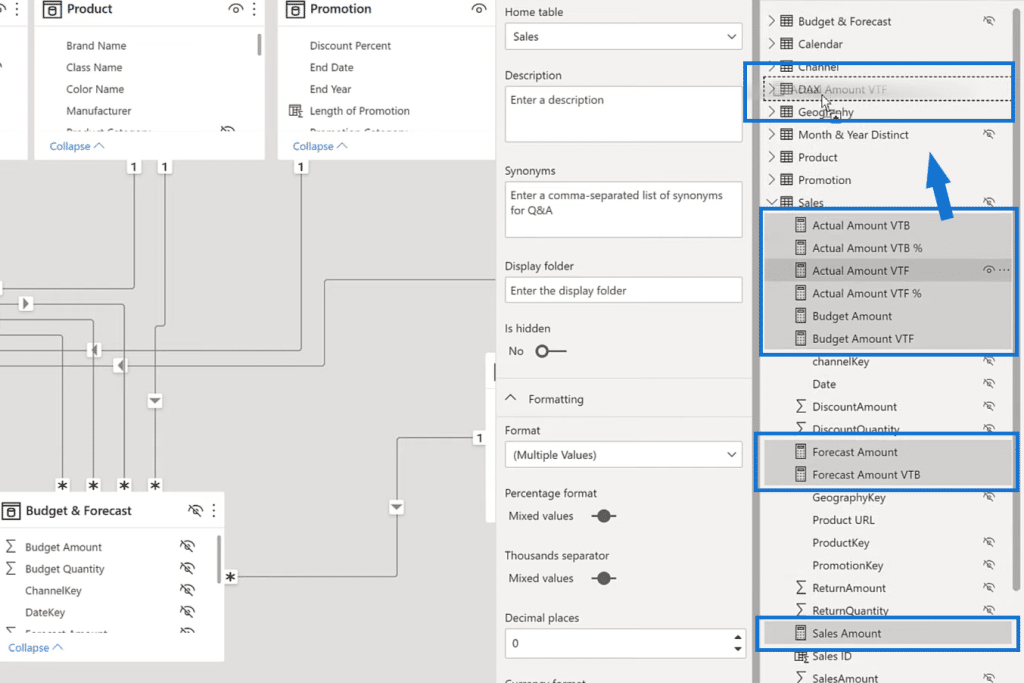
And now, I’m going to go to my Sales table and select all my measures here. I’m using the shift key and highlighting these to select them. Then, I’m going to drag them into the DAX folder that we just created.
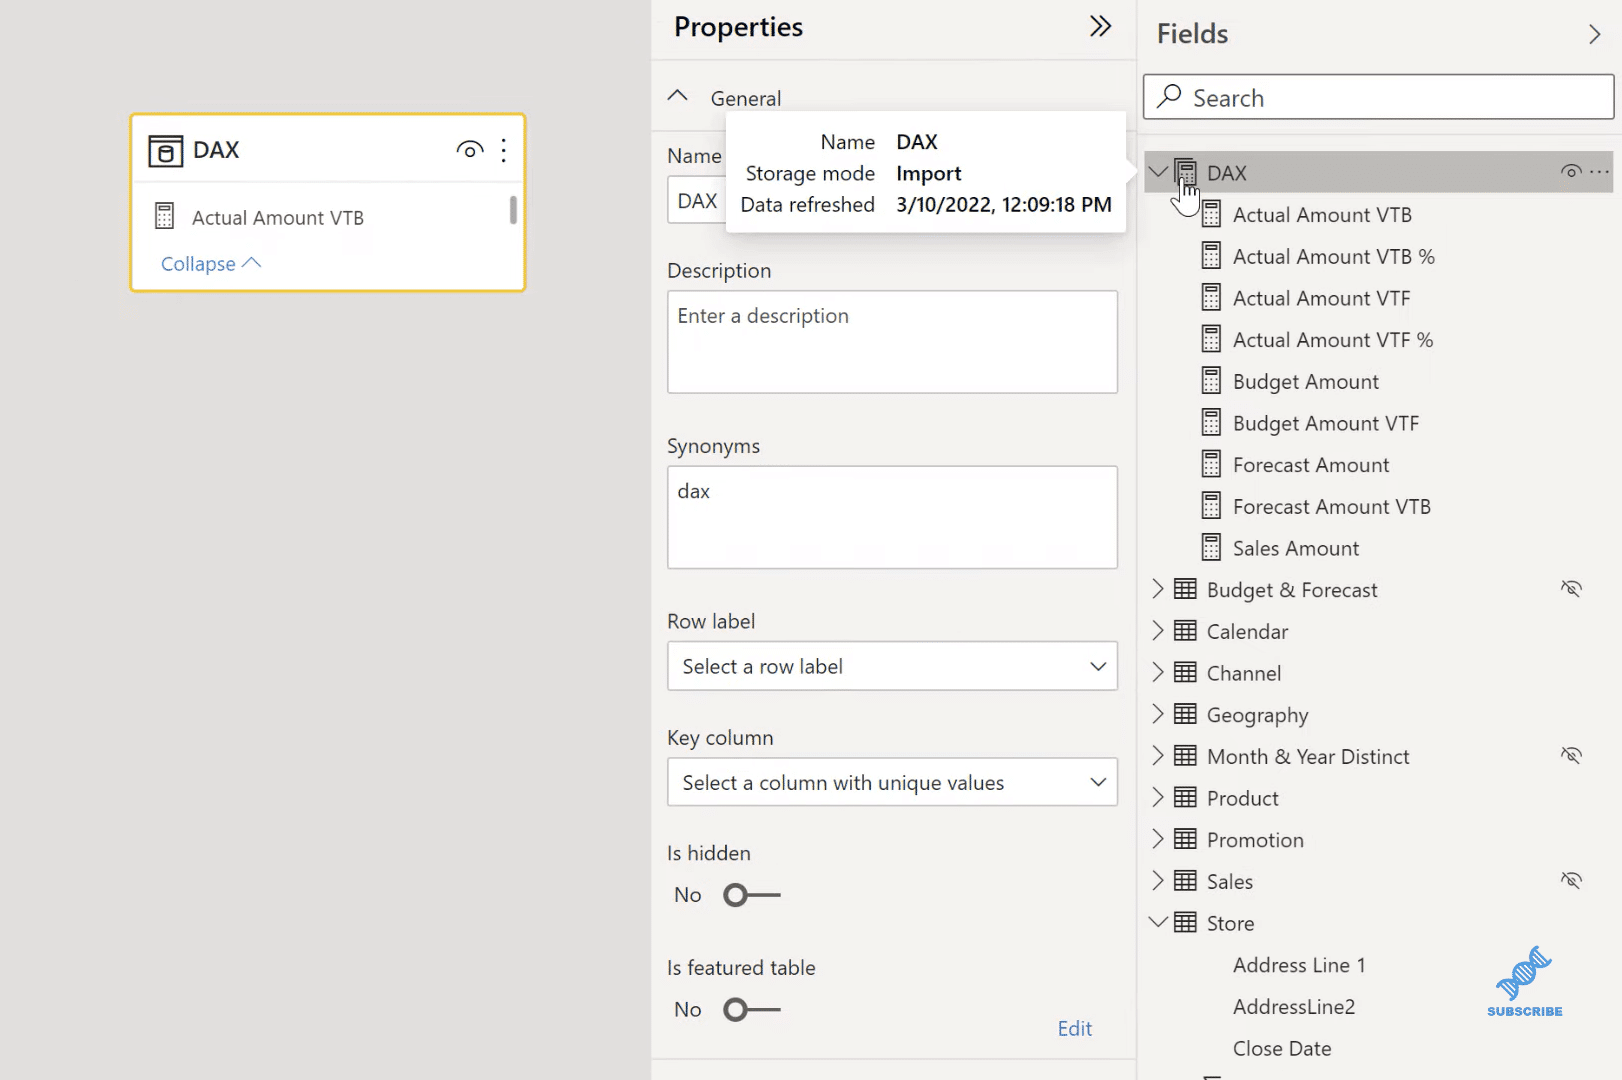
And now, you can see all the Sales measures inside the DAX folder.
Moreover, we can create more folders to organize this better, so let’s go ahead and do that. As you can see, all my Base amounts include my Budget, my Forecast, and my Sales. Those are like the core calculations. We can have them in a Display folder. I’m going to call this folder, Base for Base calculations, and select Enter. Notice that that created a folder for Base that is in this hierarchy structure as well.
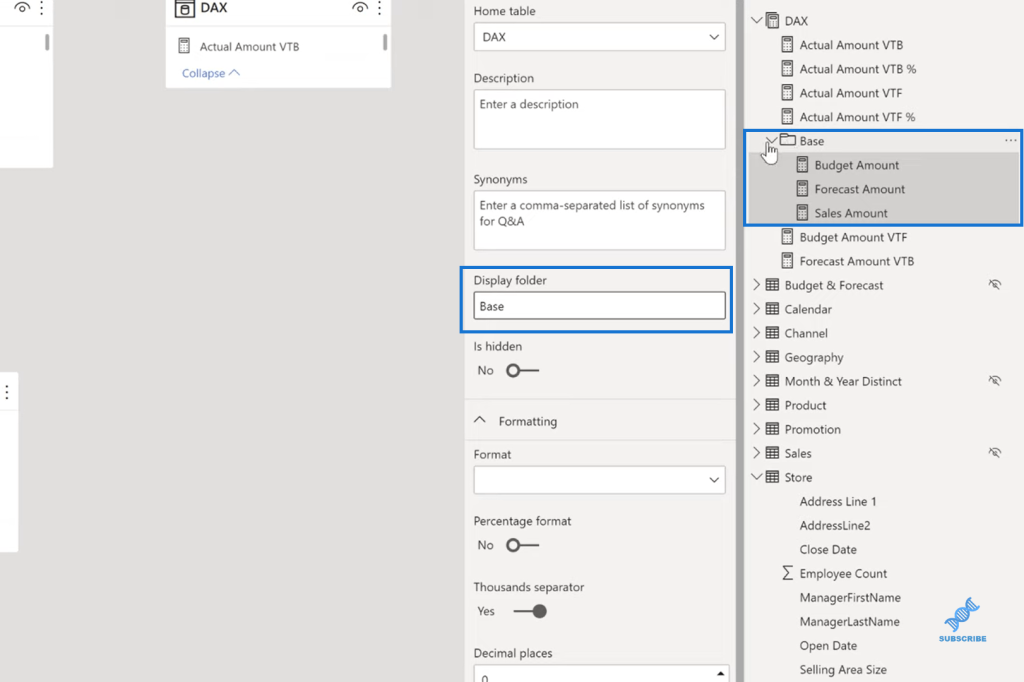
So we now have our DAX folder with our measures, which has a sub-folder with other measures. Likewise, I’m going to do the same to my Variances. I’ll select all these Variances, and I’m going to add this to a Display folder of Variances. And now, we have a Base and a Variances folder within our DAX folder.
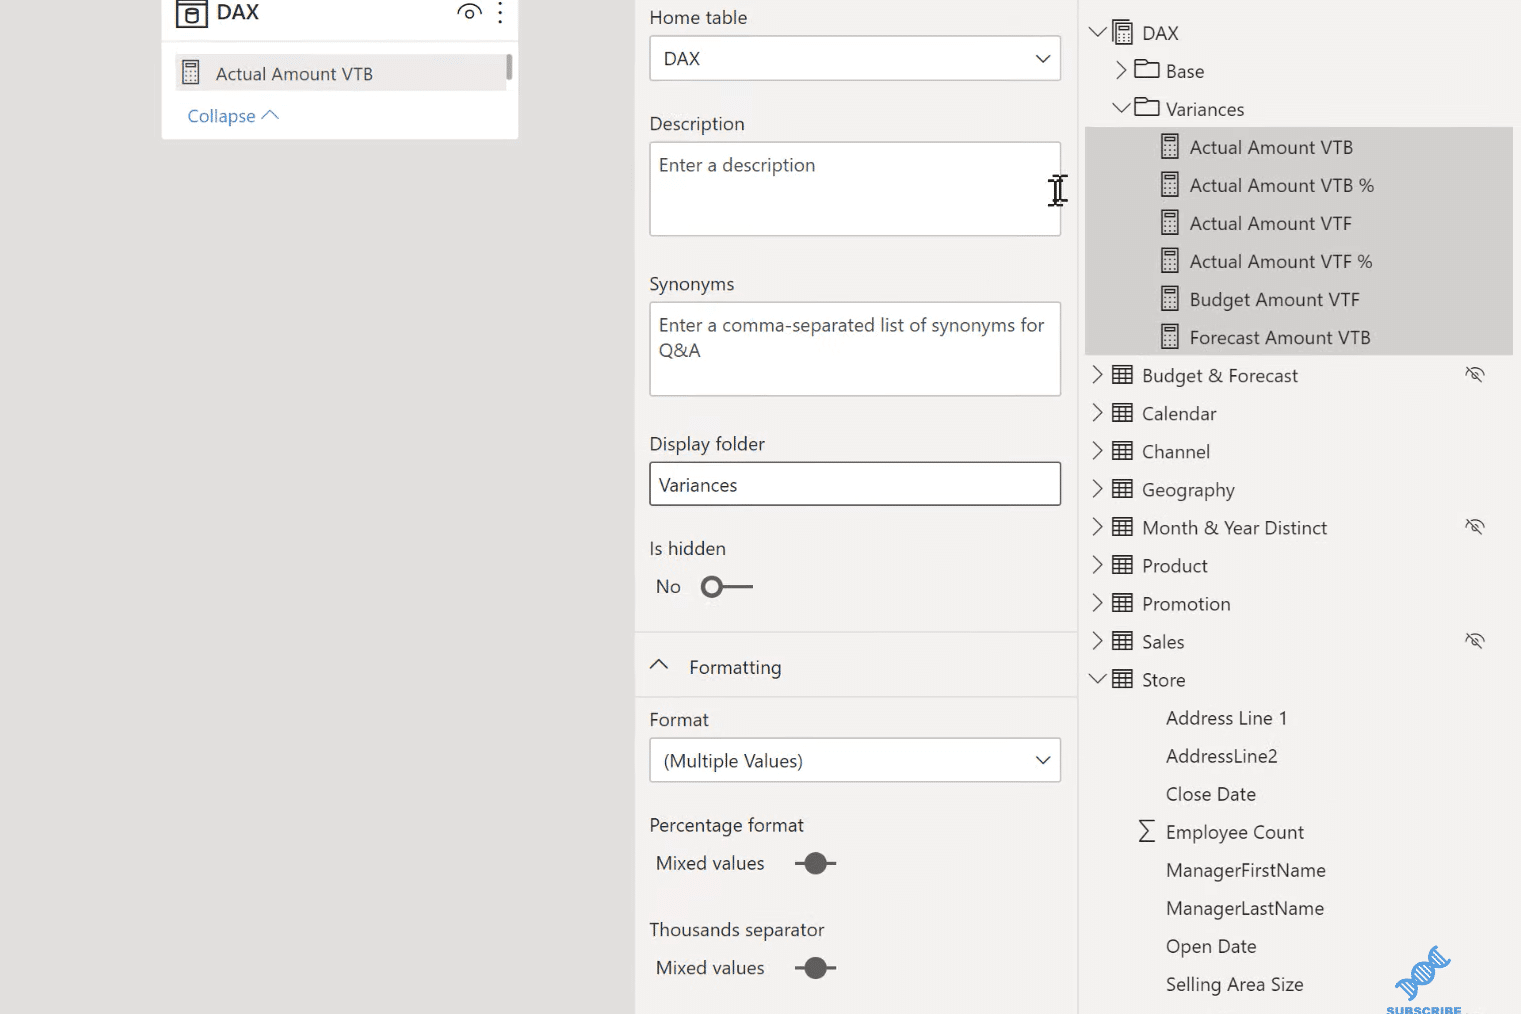
Another trick for this as well is if you have measures in the same level inside of this measure folder, you want to ensure that these folders are always kept at the top. To do that, you can add a punctuation mark, such as a period at the very beginning of the folder title. This will ensure that the folder remains at the top of the list because the folders are sorted alphanumerically.
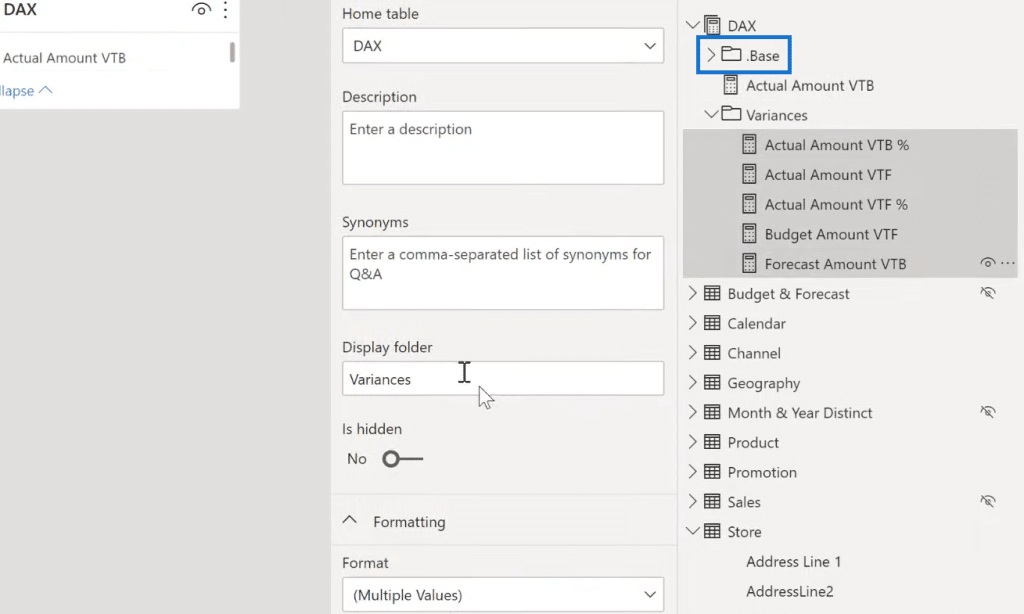
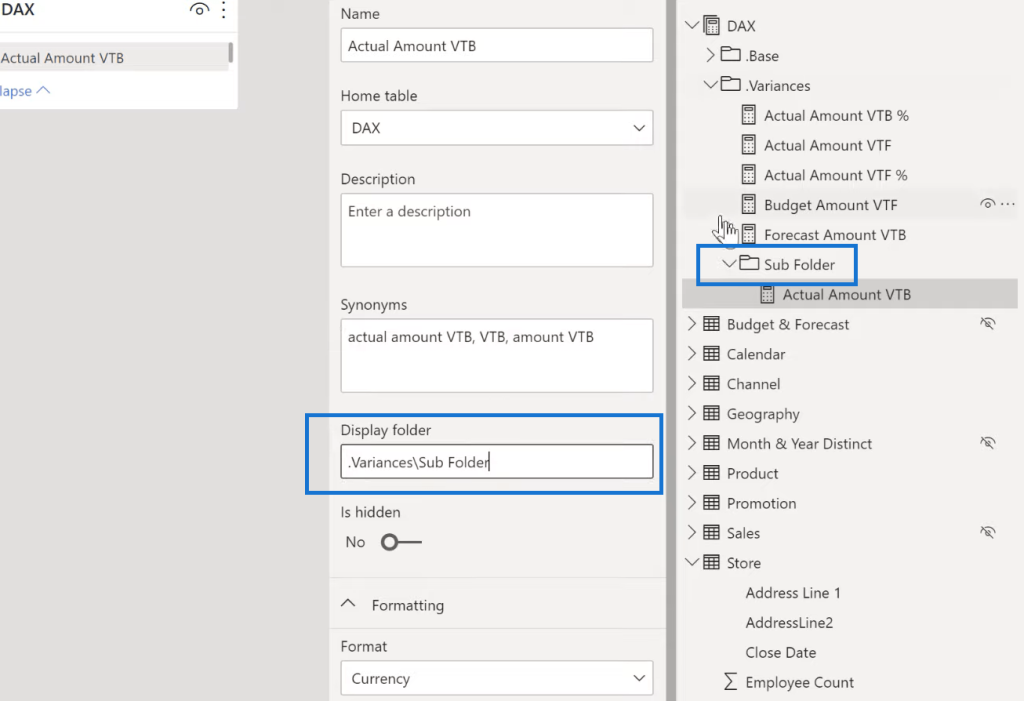
Now, if you want to do a sub folder within the sub folder, just add a backslash to the folder title, and then let’s name the sub folder. In this case, let’s call it Sub Folder. You can now see that inside of Variances, there’s a sub folder. You can also drag and drop them to any of the folders created after you’ve done that.
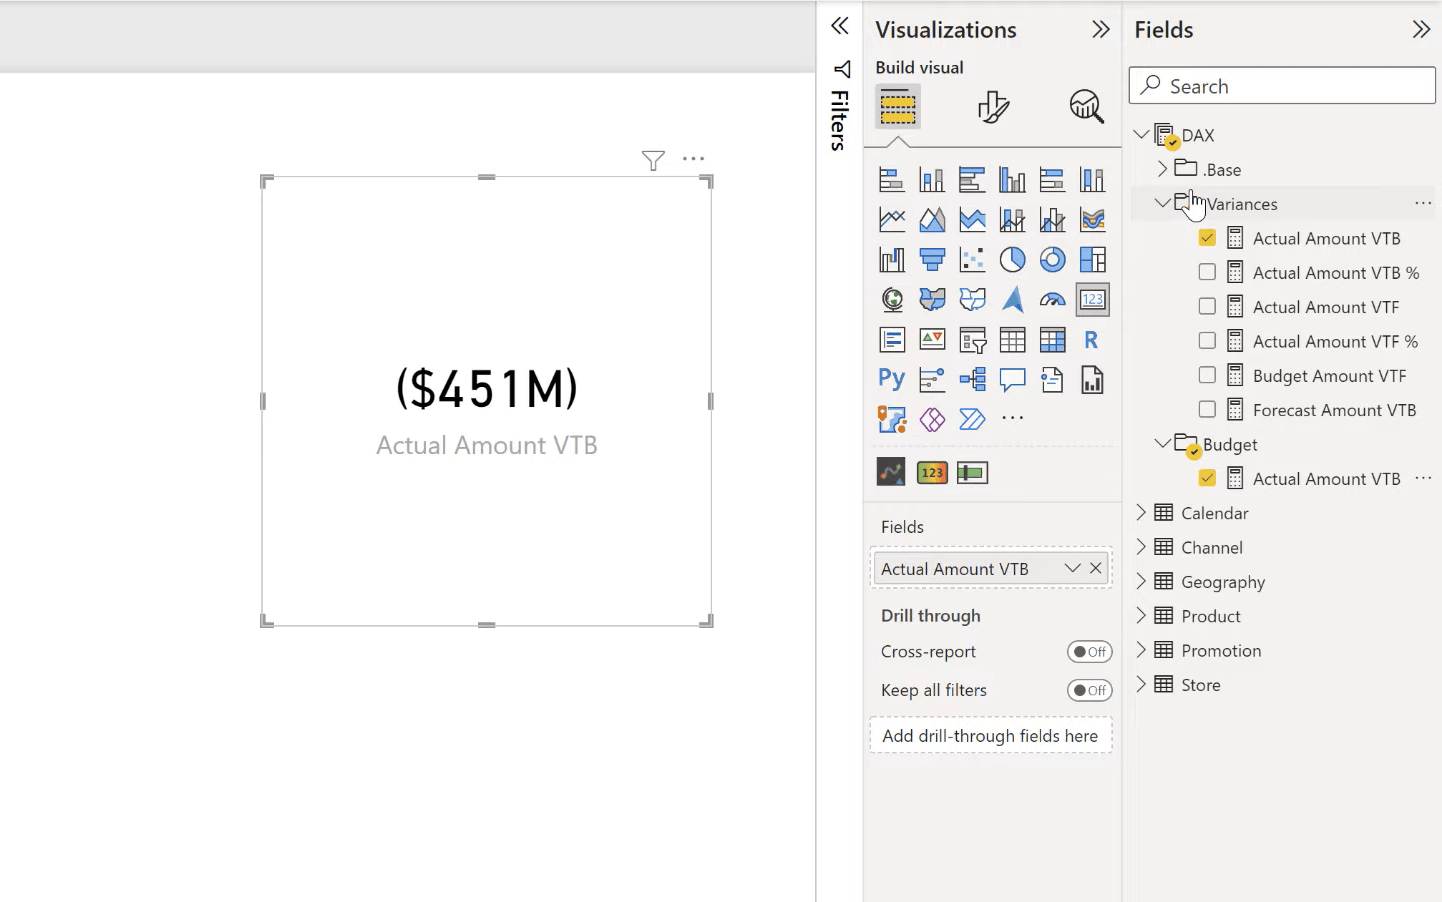
Finally, there’s one other really cool trick that I want to share with you. If I wanted to put this Actual Amount Variance to Budget (VTB) measure in one or multiple folders, I’ll just add a semicolon to the folder title. Notice that it is now in two different folders.
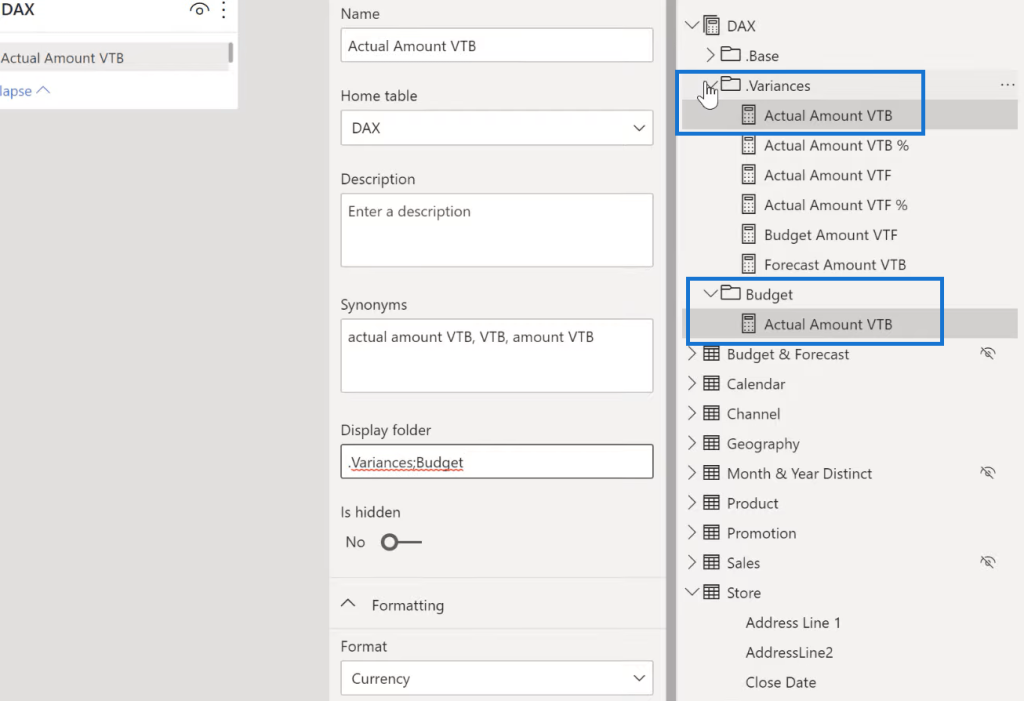
Now, observe what happens with a new visual on the page. If I had a single value card visual here, as an example, I’m going to drag the measure from Budget. Notice that it added it from both folders. So, technically there is only one measure, but you can see the changes added for both locations.
***** Related Links *****
Data Modeling In Power BI Using Supporting Tables
Data Modelling In Power BI: Tips & Best Practices
Building Your Data Model Relationships In Power BI
Conclusion
In this blog tutorial, I’ve shared with you some of my data modeling techniques to organize your DAX measures better. You can add a period at the beginning of the folder title if you want a folder to be at the top of the list. An additional backslash allows you to put your measures into a sub folder, while a semi-colon allows you to put them into multiple locations.
Hopefully, you’ve found these tips useful, and you’ve seen now how to create a root folder itself that is located at the top of your Field’s list, as far as that DAX folder grows. You can also put the DAX measures inside of that folder in a sub folder as well for better organization.
All the best!
Reid


