
In this blog post, I’ll touch on some simple aggregations in Power BI that you can use in your DAX calculations.
This is a continuation of the blog that I previously published, where I covered the differences between a measure and a calculated column.
I’ll first continue working on the measures that I’ve gone through in the previous blog and then introduce some aggregating functions that you could use as I go on. You may watch the full video of this tutorial at the bottom of this blog.

The main aim of this blog is to help you become more familiar with creating measures.
Let’s start.
Creating A Measure Group
If you recall, in the previous blog, I created measures that I used to virtually calculate additional information that I want to get from my data.
The measures that I made were the Total Sales and Total Quantity measures.

I’ll first show you how to organize these measures that I made. To do that, I’m going to create a measure group.
First, go to the Home tab and then select Enter data.


After that, change the name of the table to Key Measures.
You can choose any name you want. I just picked this name because it fits the context of what I want to do with the table.

As you can see under the fields tab, the Key Measures table still has nothing in it.

So now, what I’m going to do is fill this up with the measures that I’ve made.
I’ll first add the Total Quantity measure to the newly made table.
To do that, click on the Total Quantity measure, go to the Measure tools tab, and then change the Home table to Key Measures.

And then, do the same to the Total Sales measure.
Click on the Total Sales measure, go to the Measure tools tab, and then change its Home table to Key Measure.

After doing that, you’ll now see that the measures are under the the Key Measures Table.
Now, I’m going to remove the column named Column1 because I don’t really need it.

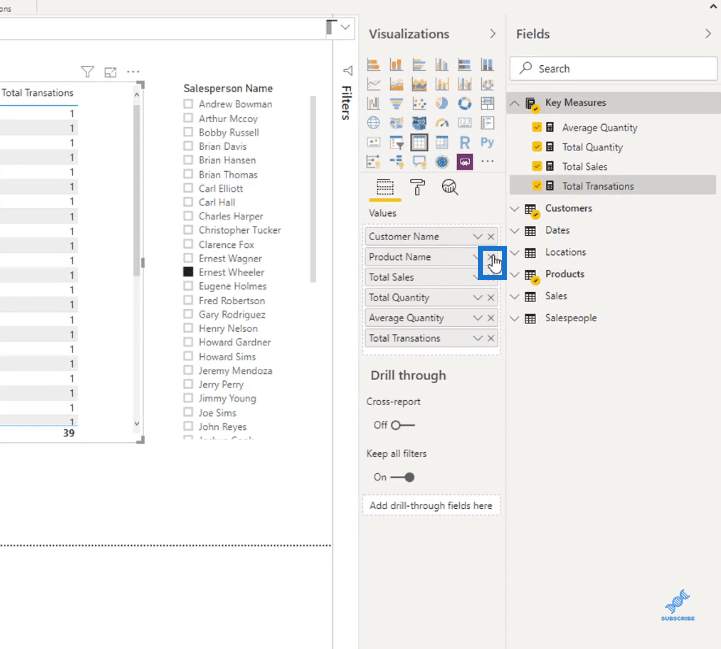
I will now pane in and pane out in the Fields tab. To do that, click twice the pane in/out button which is highlighted in the upper right corner of the image below.

As you can see, the Key Measures is now a Measure Group as signified by the calculator icon beside its name. It’s now also located at the top of the Fields tab.

I recommend you to start adding this good practice into your development workflow.
Eventually, you’ll start branching out into more complex measures. So organizing them right from the start will help you have an easier time referencing them for future use.
Aggregations In Power BI
In the measures that I’ve already made, I only used iterating functions.

In the Total Sales measure, I used the SUMX iterating function.

While in the Total Quantity measure, I used the SUM function.

Now, since I’ve already shown you some examples of iterating functions, I will start introducing some aggregations in Power BI that are useful as well.
I’m doing this because no matter what calculation you are doing, I want you to be doing it with a DAX measure.
The beginning of anything advanced in Power BI, especially from an analytical perspective, starts with something simple.
It starts with just getting the hang of DAX measures and becoming familiar with how to write them as quickly as possible.
Here, I’m going to show you some simple aggregations in Power BI.

As you can see, the table is sliced by the Short Month and Salesperson Name filters because of what I did in the previous blog.
Even though these filters are here, I can still use this table to show you some examples of how to use aggregating functions.
Don’t get too caught up in minding the filters as long as there’s some calculation happening in the background.
I will also be using these filters later on to show you how the aggregations in Power BI work with them.
To start, go to the Measure tools tab, then click New measure.

The thing with creating measures is that they appear on whatever table you select under the Fields tab. So first, make sure that you clicked the Key Measures table before making a new measure.

Now that I’ve created a new measure, change “Measure” to “Average Quantity” to properly name it.
I’ll start with a calculation that requires a simple aggregating function, the AVERAGE function.
The AVERAGE function returns the arithmetic mean of all the numbers in a column.
I’m going to take the average of the values in the Quantity column from the Sales table.
The formula setup is shown below.

I will sum up all of the values in the Quantity column, and then average them out after.
After that, grab the Average Quantity measure under the Key Measures table in the Fields tab, and then drag it to the visual.


As you can see, the values in the Total Quantity column and the Average Quantity column are all the same except for the Total value.

This is because for every product, they only purchased it in one transaction, but have bought several.
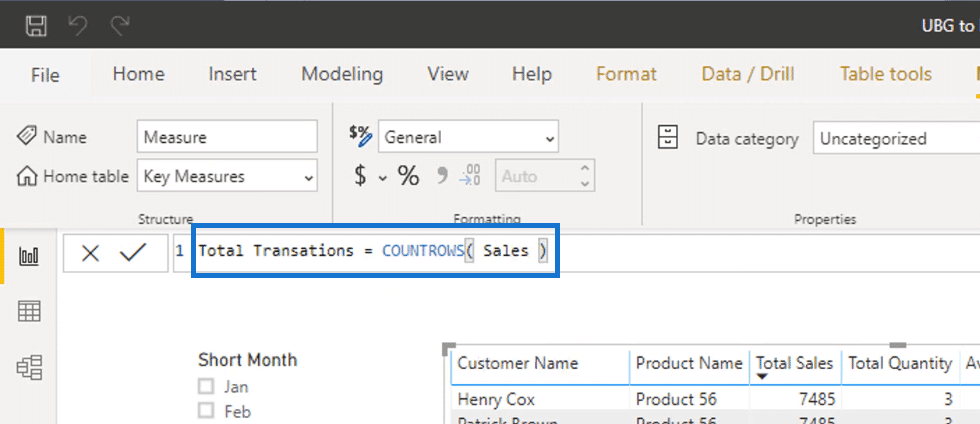
For example, Henry Cox bought 3 quantities of Product 56 in one transaction.
Now, I’ll make another measure just to show you more examples of aggregating functions.
So again, go to the Measure tools tab, and then click New measure.

Another aggregation that you can use in Power BI is the MIN function which returns the smallest numeric or text value in a column.

Another one is the MAX function which returns the maximum numeric or text value in a column.

These are examples of aggregating functions which you can easily understand and use in situations where they fit.
But what I really want to do is to calculate the Total Transactions. To do this, I’m going to use a function called COUNTROWS.
First, rename the measure by changing “Measure” to “Total Transactions.”

Then add the COUNTROWS Function. This function takes a table and then returns the number of rows in that table.
Since I want to calculate the Total Transactions, I’m going to count up how many rows there are in my Sales table.
To do that, inside the COUNTROWS function, reference the Sales table. This is how I’ve set up the formula.
The function will go through the Sales table and then count the number of rows there.
Since every row in the Sales table represents a single transaction, counting every single row is just like counting every single transaction.
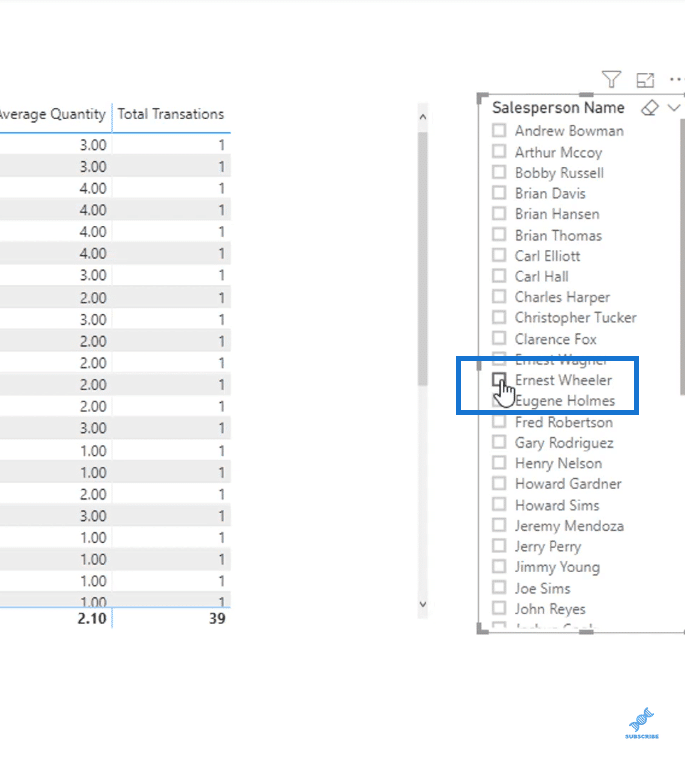
Now, grab the Total Transaction measure under the Key Measures table, and then drag it to the visual.

After doing that, you’ll see that there’s only one transaction every single time.

This is the result of having the filters that we have.
This just means that for May, Henry Cox, for example, bought 3 quantities of Product 56 in one transaction from Ernest Wheeler.
I’ll now change things up. First, I’ll remove the Product Name column by clicking the X button, as shown below.
And then I’ll also deselect all the filters.
To do that, I’ll click the box next to Ernest Wheeler’s name.
And also click the box next to May.
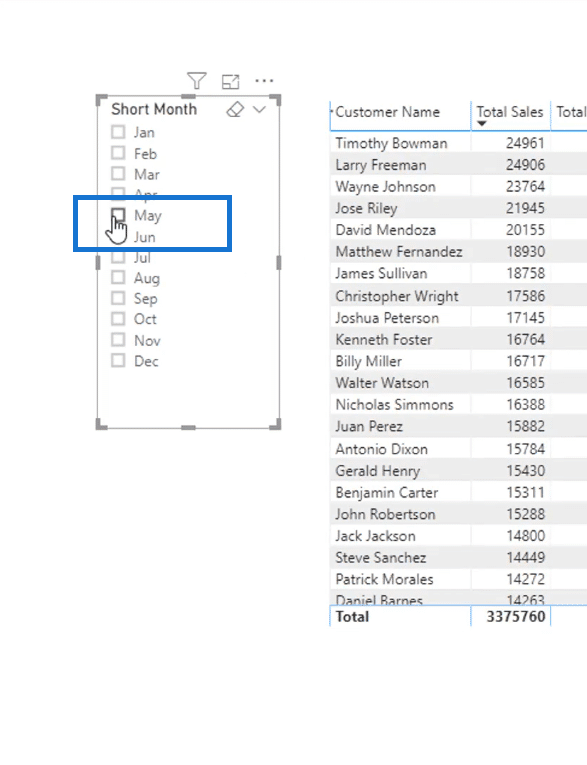
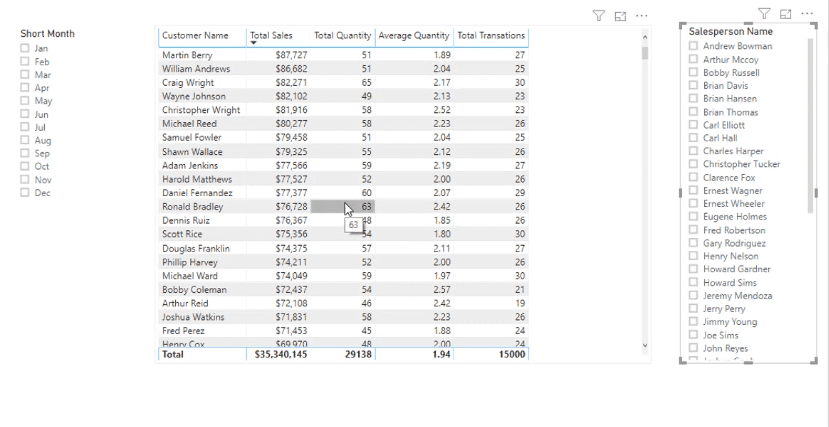
You’ll see that the numbers have changed quite a bit.

Let’s take a look at Martin Berry. The Total Sales that I got from him is $87,727, the Total Quantity of the products that he bought is 51, and on Average, he buys 1.89 of my products at each of his 27 Total Transactions with me.
As you can see, after we changed the filters of our calculations, the results changed as well.
This is where the scalability of DAX measures comes in. If you think about it, the formulas that we used are very simple.
We only used the SUMX, SUM, RELATED, AVERAGE, and COUNTROW functions for our measures. These are functions that I hope you get easily used to.
By using these simple functions, we can easily get various calculations just by altering the context.
This is the real power of DAX measures. Without adding other formulas, you can get a lot of insights just by changing your filters.
This is only made possible by the model that you’ve built. So make sure that you have the right model.

The last thing I want to show you is that you can format the results in your table if you need to.
Since I know that the Total Sales should be in Dollars, I will change it to its proper format.
To do that, click on the Total Sales measure, go to the Measure tools tab, and in the Formatting section, change Whole number to Currency by clicking the $ icon.

There are a lot of ways that you can format your results if you need to.
After doing that, the results should now look like this:
***** Related Links*****
Introduction To Filter Context In Power BI
Unpivot And Pivot Basics In Power BI – Query Editor Review
Showcase QoQ Sales Using Time Intelligence In Power BI
Conclusion
In this blog, I went over some examples of aggregating functions that you can use in your DAX calculations.
I showed you the AVERAGE, MIN, MAX, and COUNTROWS functions, which are definitely easy to understand.
I hope this helps you get a grasp of what you can achieve when using DAX measures in Power BI.
All the best,
Sam


