In this tutorial, you’ll learn how to create logistics analysis using inactive relationships in Power BI to generate valuable insights for your business. You may watch the full video of this tutorial at the bottom of this blog.
This is a breakout session from an Enterprise DNA Learning Summit.

You will learn all about the calculation logic and the reason why you need to utilize it to get insights from a logistics point of view.
Importance Of Logistics Insights
When working with logistics data, you need to filter by date to see the balance of the products you’re selling through time.
You need to see how much products are moving around to forecast the number of products you need for specific requirements.
Usually, when something is ordered, you need to have it in stock and then ship it.
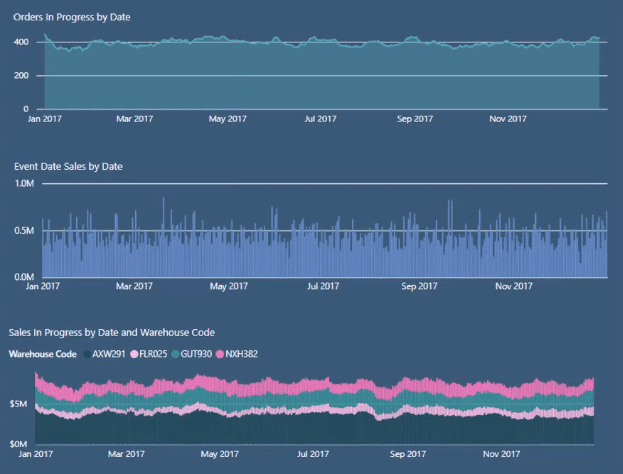
This dashboard shows how many orders are currently in progress:

It’s broken down by the number of orders, the number of sales, and by warehouse.
Having this breakdown of information makes it easier to manage different warehouses because you can see the amount of stock you need for specific locations.
Inactive Relationships In Your Fact Table
This is the model used in this tutorial:

With this set up, you can filter by customers, products, and regions, among others.
You want to be able to work out the number of orders between the ship date and order date so that you can understand the movement of your inventory.


By creating a brand new Date table, you won’t compromise the rest of the model.

This new Date table has inactive relationships so that you can work with results using two or more multiple dates in the fact table.
In the fact table, you can see the order and ship date:

These two dimensions are key components from a logistics point of view. This is how your tables will generally be set up.
You need to run these calculations to generate inventory management or logistics management insights.
Formulas Used
Once you’ve set up the model and fact table, these are the measures that you need to create.
Events In Progress Formula Pattern for Orders
This is the measure you need to use to calculate the number of Orders in Progress:

For this technique, inactive relationships are important. If you have an active relationship between the Event Dates table and Sales table, the calculations wouldn’t work.
This formula follows the Events in Progress pattern. It’s working out the number of orders that have a ship date within a specific time period.
You need the ship date to evaluate to TRUE for these two arguments:

If they evaluate to TRUE, the order of that particular day will be counted.
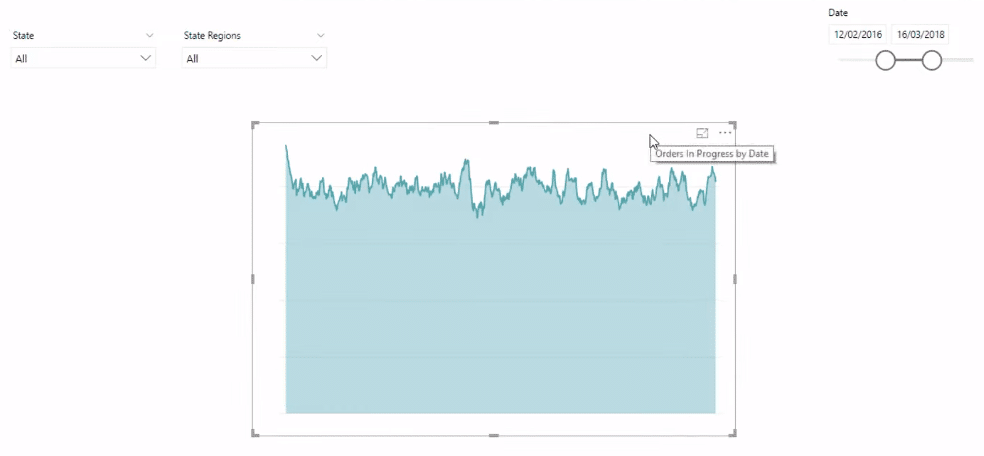
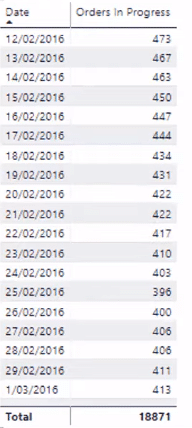
To better understand how this formula works, let’s look at this visualization and table:


You can see the number of orders that are live for specific dates. This is a very useful insight because it allows you to analyze the number of products that are being processed through time.
The formula enables you to forecast the number of products you need for a specific time, location, and warehouse.
Events In Progress Formula Pattern for Sales
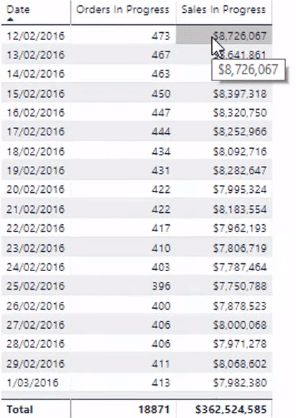
You can also utilize this formula pattern for Sales as well:

It’s working through each order and ship date in the Sales table.
Instead of the number of orders, this formula is working out the dollar value that’s live or in process.

This is another good insight because it assists in cash management. It allows you to manage your cash on a day-to-day or month-to-month basis.
This insight gives you a historical overview on specific periods, such as Christmas or mid-year. It helps you to create forecasts on the cash requirements you need for those periods. With this information, you can go to your bank or lender to acquire beforehand the right facilities to achieve the maximum potential sales.
***** Related Links *****
How To Work With Multiple Dates In Power BI
Discover Multiple Product Purchases Using DAX In Power BI
Master Virtual Tables In Power BI Using DAX
Conclusion
The key parts to get this technique to work are the models and formulas.
This is a common problem you’ll encounter in your business operations. With this technique, you’ll be able to solve it and get valuable logistics insights.
You can learn more about how to handle multiple dates in your fact table by checking out the other content in Enterprise DNA Online.
All the best,
Sam


