
As soon as you start developing a few Power BI models, you’ll very likely run into a problem where you have two dates in your fact table and you can’t place two relationships between your date table and the other table. You may watch the full video of this tutorial at the bottom of this blog.
You might even have multiple dates, like entered date, ordered date, invoiced date, shipped date and potentially others.
You might think that there is a problem with Power BI, or that you need a brand new date table.

You don’t actually need another table, nor do you need to worry.
The key thing to realize is that you can have multiple relationships between tables. You can have lots of ‘inactive’ relationships but not more than one ‘active’ relationship.
The trick with inactive relationships is that you can turn them ‘on’ by using the right DAX formula.
In this post, I’m going to show you how to utilize the USERELATIONSHIP function together with the CALCULATE function to activate relationships in your data model.
Working With Dates in Power BI
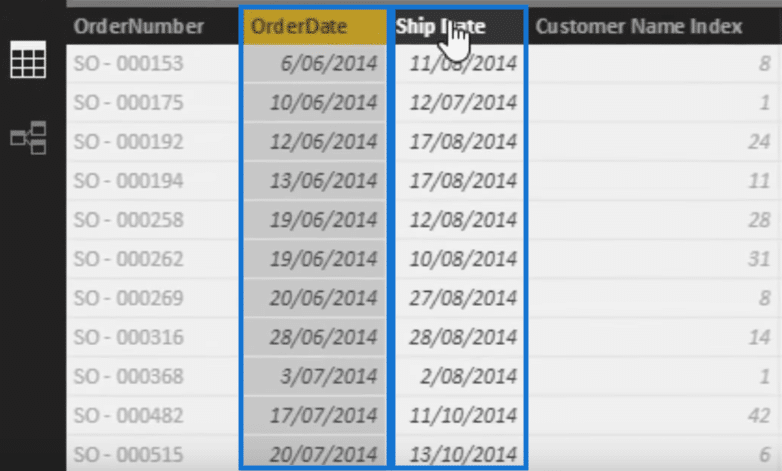
If we take a look at our underlying table, you’ll notice that we have an Order Date column and a Ship Date column.
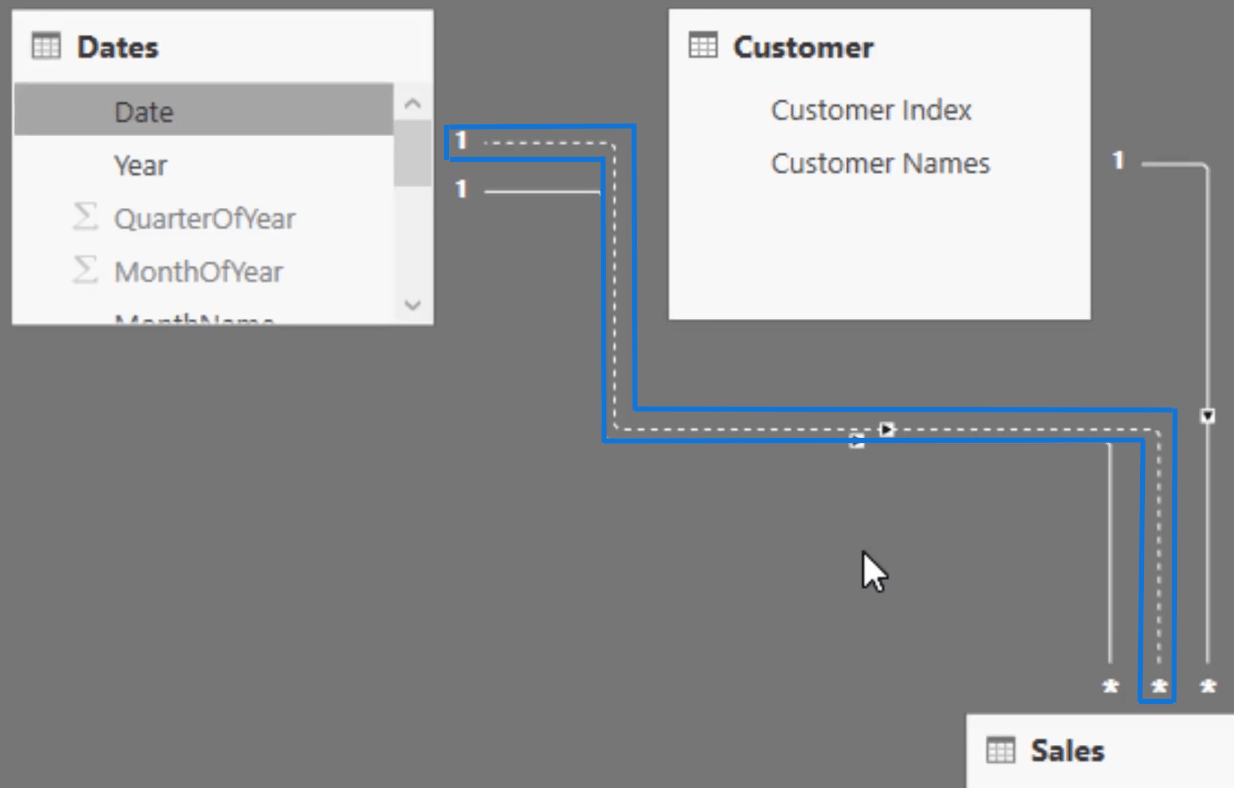
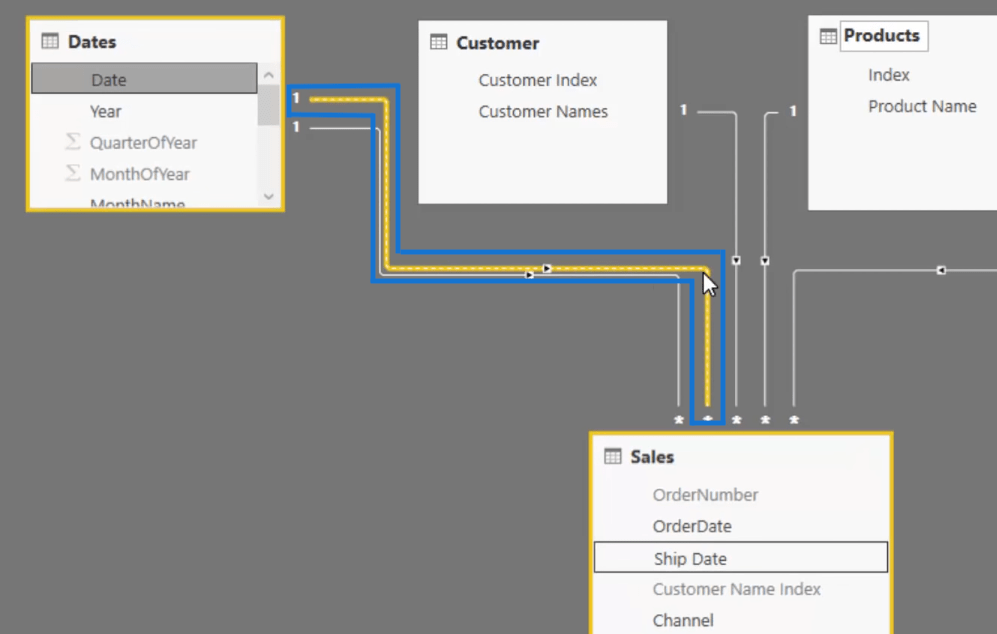
Then let us take a look at our data model and drag the date lookup table to our Order Date.

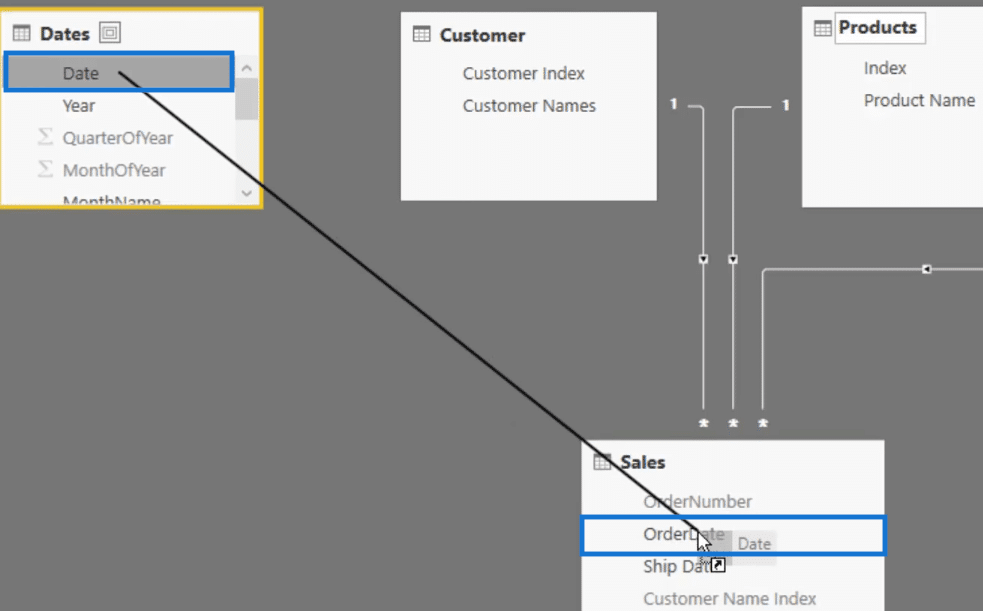
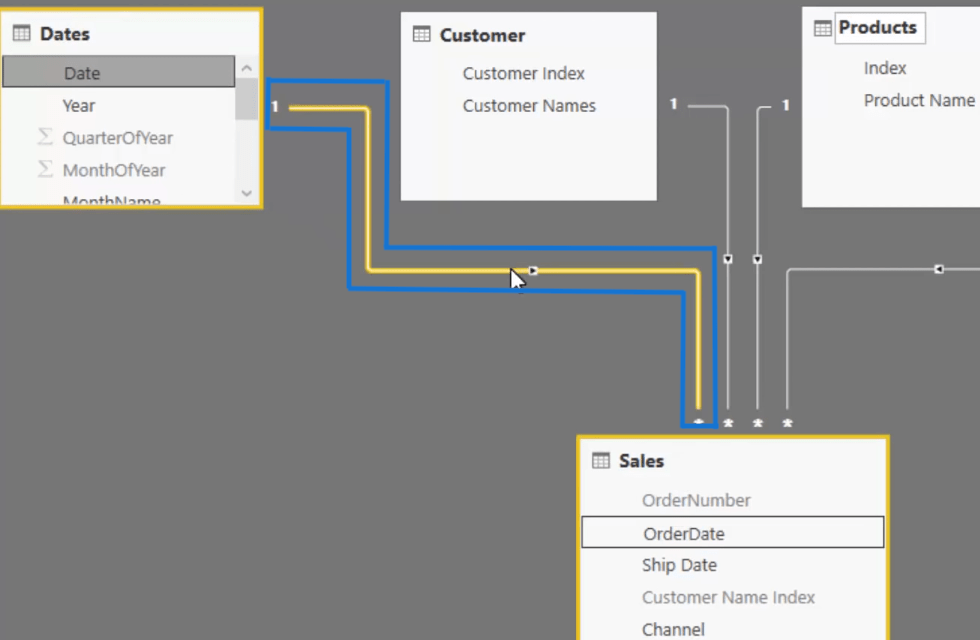
As you can see, we have a solid line here which represents an active relationship.
Let us then try to do the same thing but this time between the Date and the Ship Date.
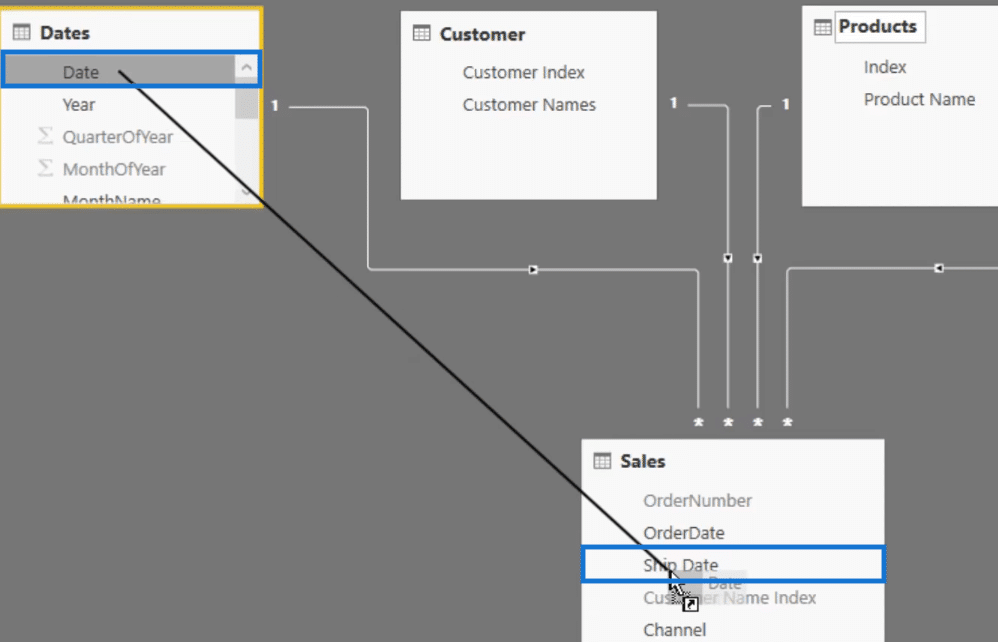
What we have now is a dotted line which means that we have created what is called an inactive relationship.

As you can see, we can only build one active relationship.
Let us now see what will happen with the natural filtering with our active relationship.
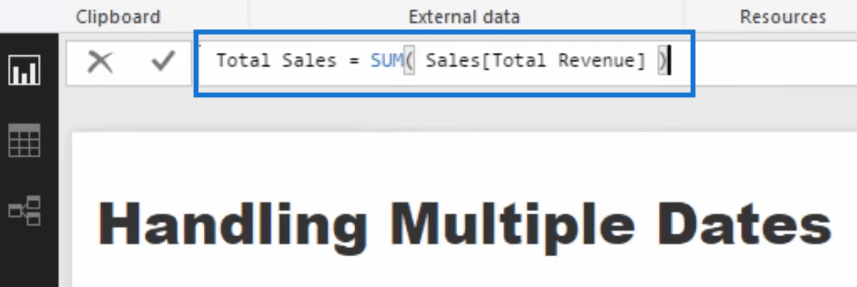
We can create a new measure and call it Total Sales and then go SUM by the Total Revenue column.
If we drag this measure into the canvass and turn it into a table, you’ll see that we have the Total Sales column here.
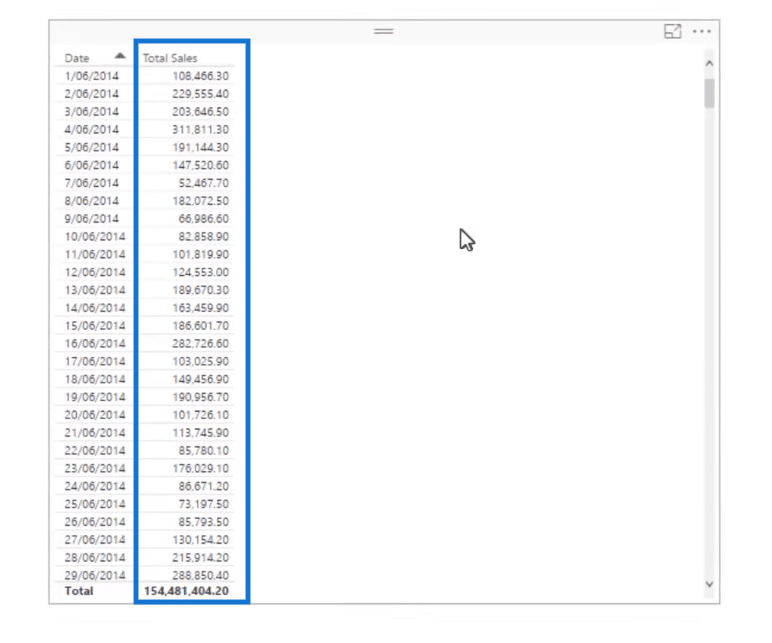
What you need to take note, however, is that this is Total Sales by Order Date since this is the active relationship in our data model.
Aside from this, we need to make it clear what kind of date we are working on.
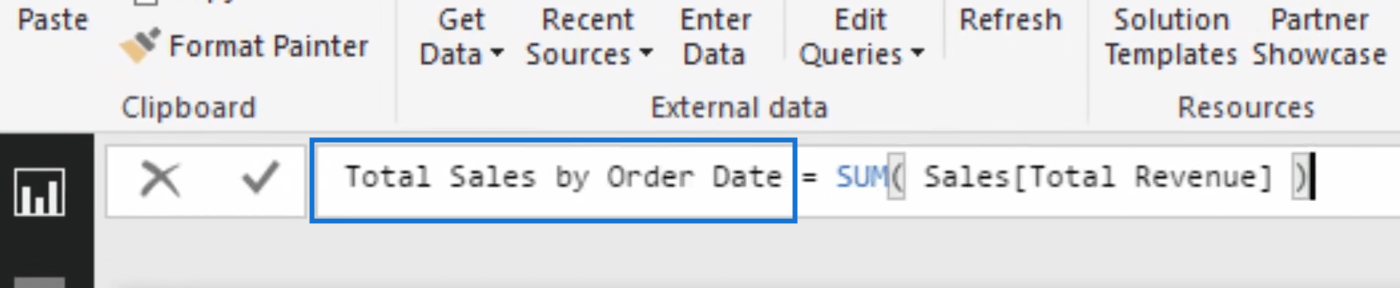
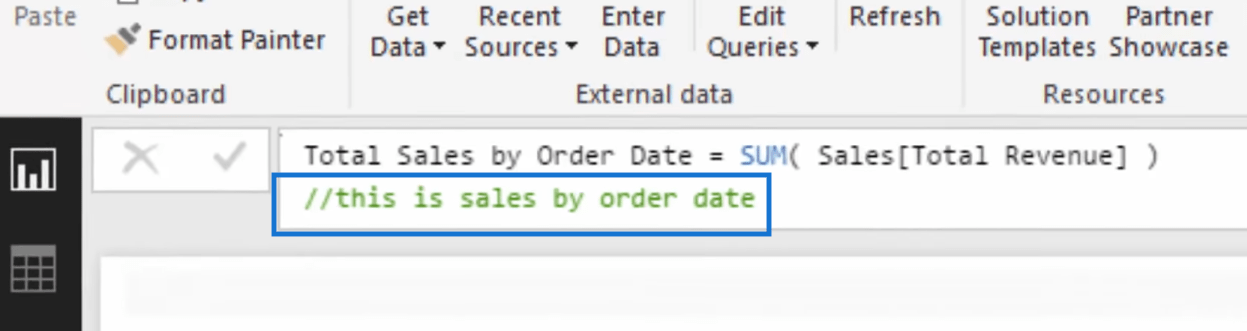
We can do this first by carefully naming our measures. For instance, instead of just saying Total Sales, we can call it Total Sales by Order Date.
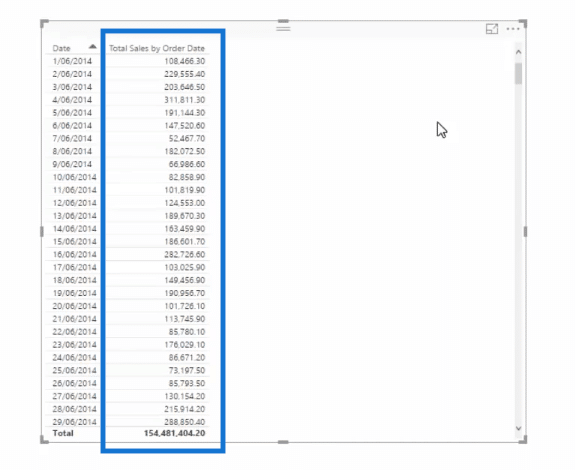
As you can see, our table now says Total Sales by Order Date instead of just Total Sales.
But aside from specifying the date in our measure, we can also add a comment in our formula like this one below just to make it clear to whoever is using our data.
Now, how about if we want to show the Total Sales by Ship Date?
Remember that the Total Sales by Ship Date has an inactive relationship with the Dates Table. Let’s move on to how we can activate this relationship.
Turning on Inactive Relationship
To actually analyze Total Sales by Ship Date, we need to first turn on this inactive relationship because at its current state it does not register at all.

The good news is that this is actually very easy to do. We can use this special DAX function called USERELATIONSHIP to physically turn on one of those relationships.
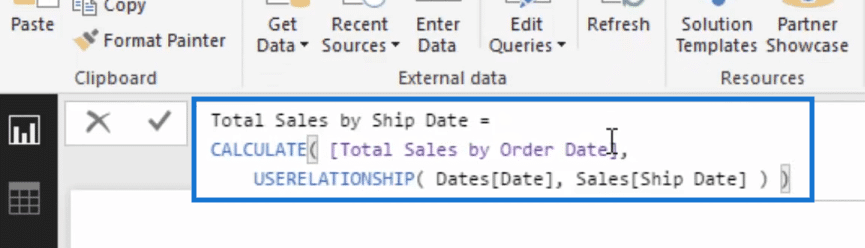
So, we’re going to create a new measure and call it Total Sales by Ship Date.
Then we’re going to use CALCULATE and then Total Sales by Order Date and then jump down to another line.
Now, we’re going to add USERELATIONSHIP and then Dates then we’re going to add Sales by Ship Date.
If we drag this into the table here, you’ll see that the results in our Total Sales By Ship Date are very much different from those in our Total Sales by Order Date.
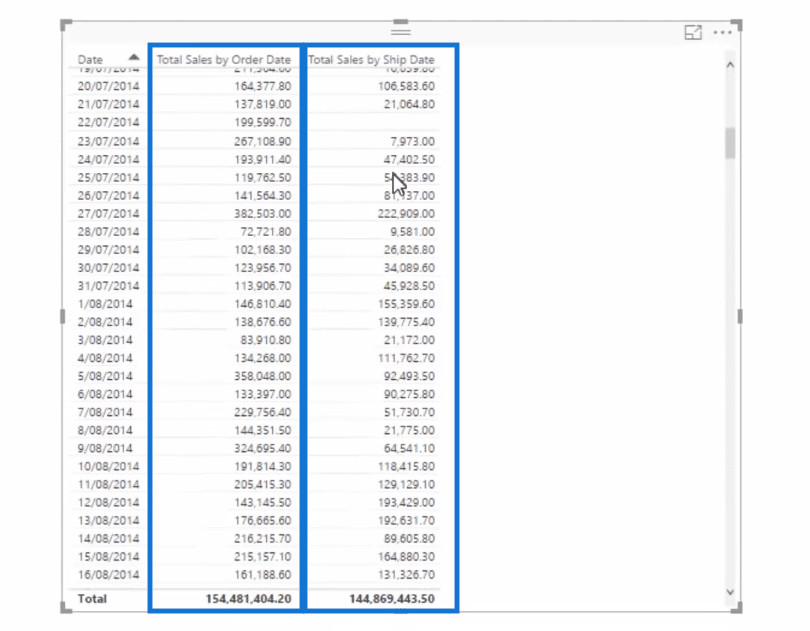
We were able to calculate our Total Sales by Ship Date because we have turned on this filter here and it has virtually become a solid line or an active relationship.
I’m sure you realize how easy it is to implement this technique but it might also be helpful for you to know that some people get confused when working with dates in Power BI, especially those who are still new.
Confusing Actions When Working With Multi Dates
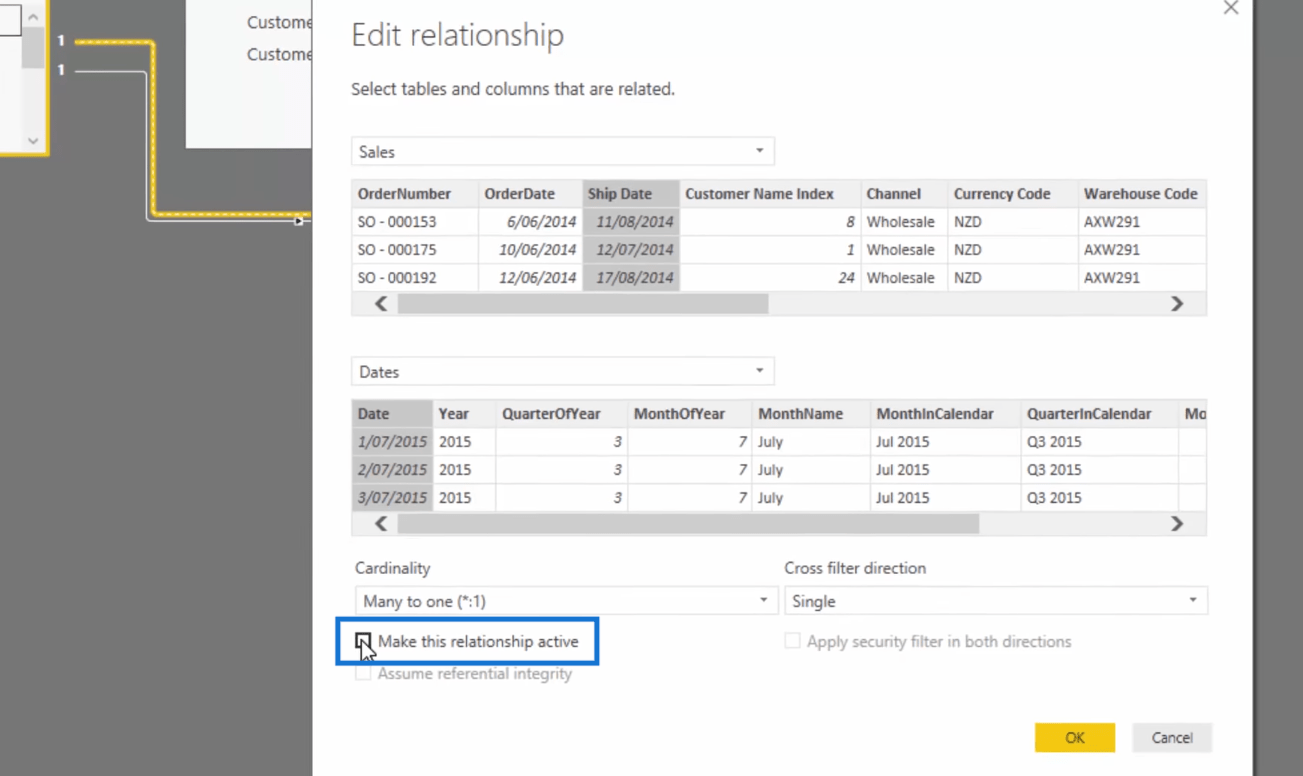
One approach some people try is they go to the data model, click on the dotted line so that the Edit Relationship pop up box will appear.
Then they click on the “Make this relationship active” option.
If you try this approach, you’ll see that you will get an error like this one below.
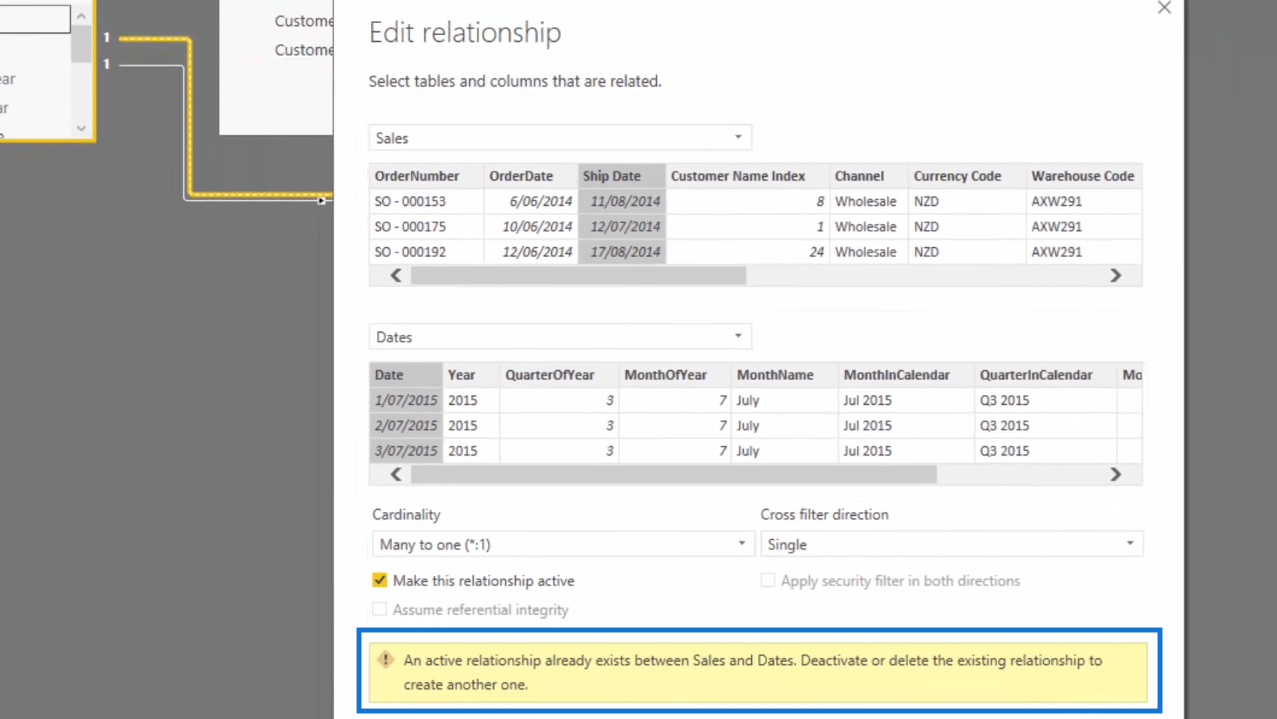
And because the error message tells you so, you might try to deactivate the active relationship to turn on the other one but then you’re going to encounter another error.
So in case you are working on multiple dates in Power BI, all you need to do is utilize the USERELATIONSHIP function and then your calculations will be done easily.
***** Related Links *****
Show Results Up To Current Date Or A Specific Date In Power BI
Show Days Before Or After A Selected Date Using Power BI
The DATEADD Function: The Best And Most Versatile Time Intelligence Function in Power BI
Conclusion
We have just discussed how to work on a data set that has relationships and multiple dates in Power BI.
After utilizing the USERELATIONSHIP function together with the CALCULATE function we were able to activate relationships in the data model.
By using this technique, you’ll have the ability to quickly filter your data by any of these dates, and you open out a range of analysis that traditionally, with Excel, would have been very time-consuming to create.
Once you get your head around this technique, you can build some very effective Power BI data models.
Cheers,
Sam

[youtube https://www.youtube.com/watch?v=u8_aeLmXbVk&w=784&h=441]


