In this blog post, I will show a really unique and specific example where I’m going to hone in on how you can combine lots of the techniques that I’ve described in many previous tutorials to come up with profit margin changes. You may watch the full video of this tutorial at the bottom of this blog.
These are techniques like Measure Branching, Trend Analysis, and DAX Formula Combinations.
What we are going to do is analyze the changes to profits margins that have occurred over time.
Sometimes it can be difficult to imagine how we actually get to this type of analysis. It’s not always immediately clear. To get to these results we need a lot of formulas, one branch after the other.
In this tutorial, we’re going to start from scratch, from no measures at all and then build up to show change over time.
The skill of highlighting this information and to be able to do this quickly inside Power BI really showcases its analytical potential.
Why We Need To Determine Profit Margins
In some of the analysis that you’re doing, you might come across customer margins and will want to compare time periods to see if there have been any changes.
An analysis like this could prove to be useful if you want to know if a recent promotional activity or sales initiative made an impact, or if recent changes to your sales team or personnel had an impact on your margin.
There are different ways that margins can be impacted, and I want to show you how to work it out and showcase it in a compelling way.
Here, we can see a workshop that I recently ran through for the Enterprise DNA webinar series about discovering advanced insights.

This customer margin impact report is an advanced insight because it’s not something that you can derive directly from the data tables.
Most of the time, you will be dealing with tables especially if you’re handling sales numbers. There are times when there is no margin information available because margins are usually not aggregated. They usually have to be derived from some columns of numeric information.
Calculating Core Measures
So how do you work out margins? Well, we work it out by dividing our Total Profits by Total Sales. But first, we need to calculate our Total Sales.

Then, we can calculate our Total Profits.
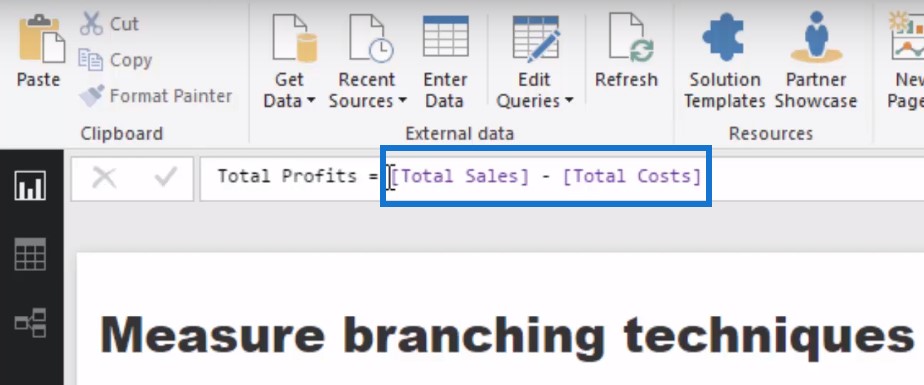
Now, obviously this is the first branch of our measures because we’re just referencing measures inside of it. We’re not referencing anything in a table; we’re referencing the measures Total Sales and Total Costs.
Once we have calculated our Total Profits, we can branch out again and calculate for our Profit Margins. For this measure, we will divide the Total Profits by Total Sales.
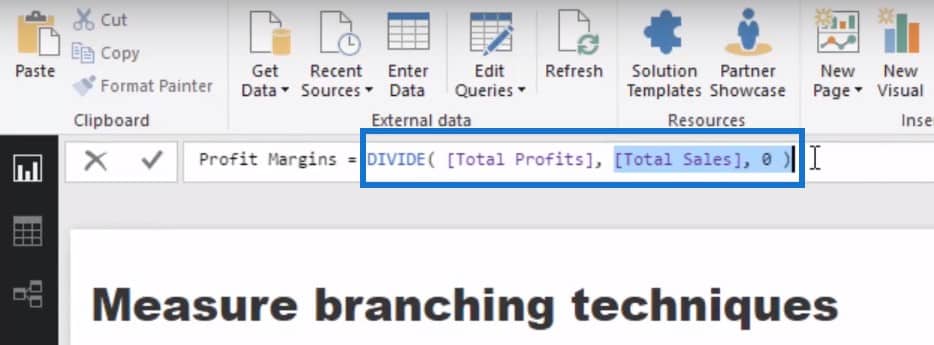
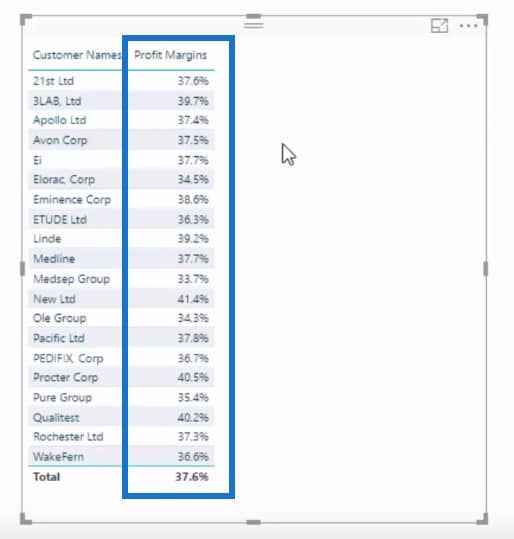
Let’s have a look at our customers and their profit margin information using a specific time period (as indicated by the Date filter on top).

Now, this is the core measure I want to show to you. I will show you how we can branch out into more advanced calculations with this simple core measure.
Calculating Margins From Last Quarter
We’ll be working out the margin change or the margin differential when compared to a prior period, and then we’ll showcase this insight in a dynamic way.
First of all, we’ll use a simple time intelligence calculation. We’ll use the CALCULATE function to change the context of a calculation. We’re also using the DATEADD function to jump back by one quarter.

By using this technique, we can look at our profit margins from last quarter. All I did is to sub in the Profit Margins measure we just calculated into this time comparison technique.
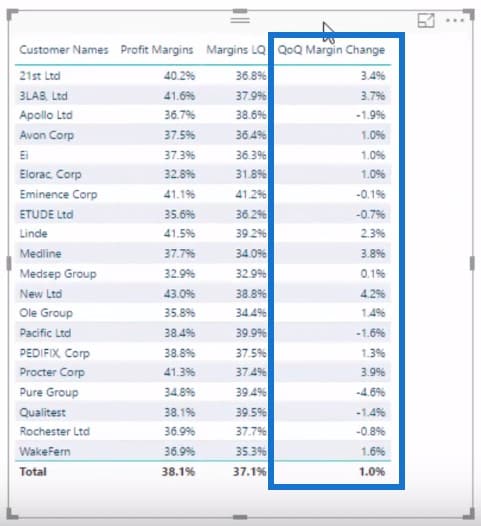
I dragged this measure into my table and formatted it to show percentage. The table now shows us the margins from the last quarter.
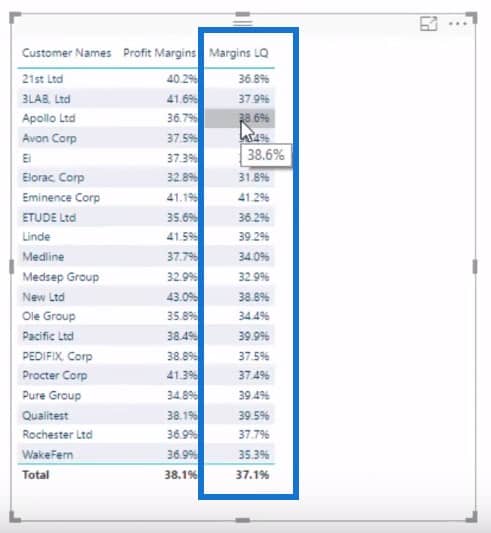
It’s pretty cool how quickly we got here using measure branching. From this measure, we can now derive the profit margin changes or margin differential because we already created the two measures we will need.
Calculating The Margin Differential
Let’s take a quick look at how simple this profit margin changes formula is. We have the Quarter on Quarter Margin Change where I subbed in my Profit Margin measure and Margins Last Quarter measure that we just created.

I just did a simple subtraction to come up with the margin change.
Visualizing The Data
We can then create a second copy of this table, get rid of the intermediary calculations, and turn the second table into a visualization.

Sometimes, if you just look at the profit margins in isolation, it does not add a lot of value. We want to look at our margins differentials to see if they have changed.
As you can see, the chart gives us a much clearer picture of the profit margin changes than the table. We can see where our margins expanded and contracted. We can also change the time frame using the date filter to look at the differential.

***** Related Links *****
Power BI Trend Analysis: Are Margins Expanding Or Contracting?
Calculating Percent Profit Margins Using DAX In Power BI
Measure Branching – The Most Important Concept When Using DAX In Power BI
Conclusion
In this tutorial, we have achieved a really high-quality insight that historically would have been quiet difficult to produce in a scalable way.
Power BI gives you that power and if you can understand all the techniques that I go through in this tutorial, you’ll be in a very good place to develop some high-quality analysis in your own models and dashboards.
For many more techniques around advanced analytics in Power BI, check out the course module from Enterprise DNA Online below. So many unique insights that can be achieved in Power BI.
Advanced Analytics in Power BI
All the best,
Sam


