
Many times when you get into more advanced formula with DAX, you’ll find that the totals that show up either on a table or a card can sometimes be incorrect. There are so many variations of how this could eventuate in your formulas so it’s hard to cover every single scenario. In this tutorial, I demonstrate how you can implement advanced logic in Power BI and achieve the desired total that you’re after. You may watch the full video of this tutorial at the bottom of this blog.
I will run through quite a lot of detail about the structure of the formulas and logic that you require here. We’re also going to work out how you can sort out totals in your data using advanced logic.
By totals, I mean the totals that we see at the bottom of tables or the cards on the right side.

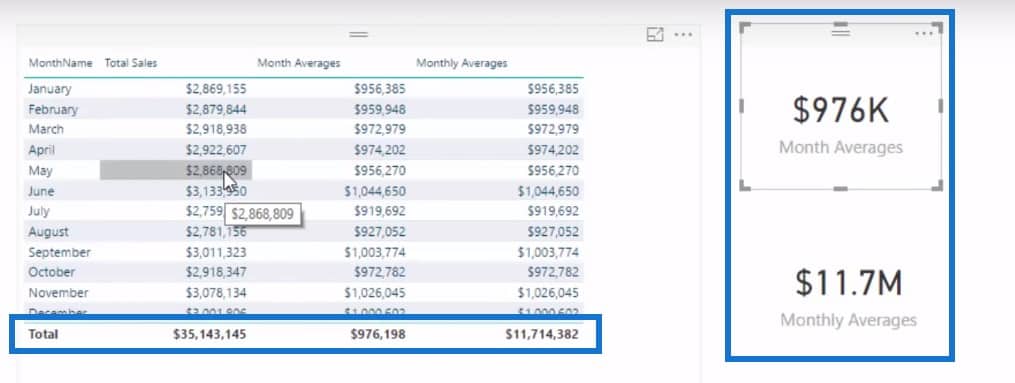
Now, these totals are going to obviously derive different numbers to what are actually in the tables because of the context. Since there is no context on the results, it’s basically just doing everything without any filter in place.
But sometimes, you will want to sum up a total based on the individual results that you are getting inside the tables based on their filters.
Calculating Total Sales
First, I have to calculate my Total Sales using this formula.

This is just a simple iterating function calculating the Total Sales for everything but has been filtered by the Month Name.
Note that this table is being filtered for each month, but not being filtered by year. That means it is counting every single year’s results in January, February, March, and so forth.
Getting The Month Averages
What I want to achieve next is to look at averages across the years. For example, I want to know the average of how much we sell in January, regardless if it is over three years, four years, or five years.

The formula I used is a relatively simple one. I used an iterating function called AVERAGEX which will iterate through every single month and year in the current context of Total Sales.

There are only three years in our data: 2015, 2016, and 2017. For the month of January, what VALUES is doing is that it is calculating the January 2015, January 2016, and January 2017 Total Sales.
What AVERAGEX is doing is that it is averaging those three numbers, which is why we’re getting the $956,385 result for January.
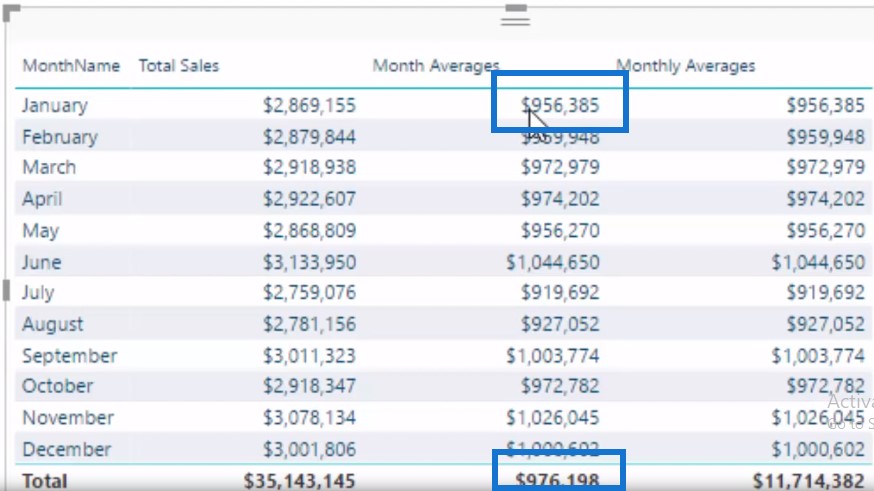
The total is doing the exact same logic. It is working out the average of every single month and year. Instead of doing just three months, it is going through 36 months’ worth of Total Sales and then averaging those up. This is how we come up with the $976,198 total.
Using Logic To Get Average Yearly Result
But what do we do if we want to calculate the total of all the averages? What if we want to extrapolate out the average yearly result? Unfortunately, this formula is not going to do it for us. We need more logic inside of the formula to get the total we want.
The formula I came up with is not too far removed from what we did. We just overlaid some additional logic – which is the key technique I want you to get from this. You might need to put a different logic, but you can use this as a pattern to help you solve your own data set.
Getting The Monthly Averages
If you’ll notice, we have the same numbers under the two average columns, but the totals are different.
The Monthly Average formula is exactly the same formula as the last one we just used. We also have the Average Total measure, which is a table function that I put into a VARIABLE.
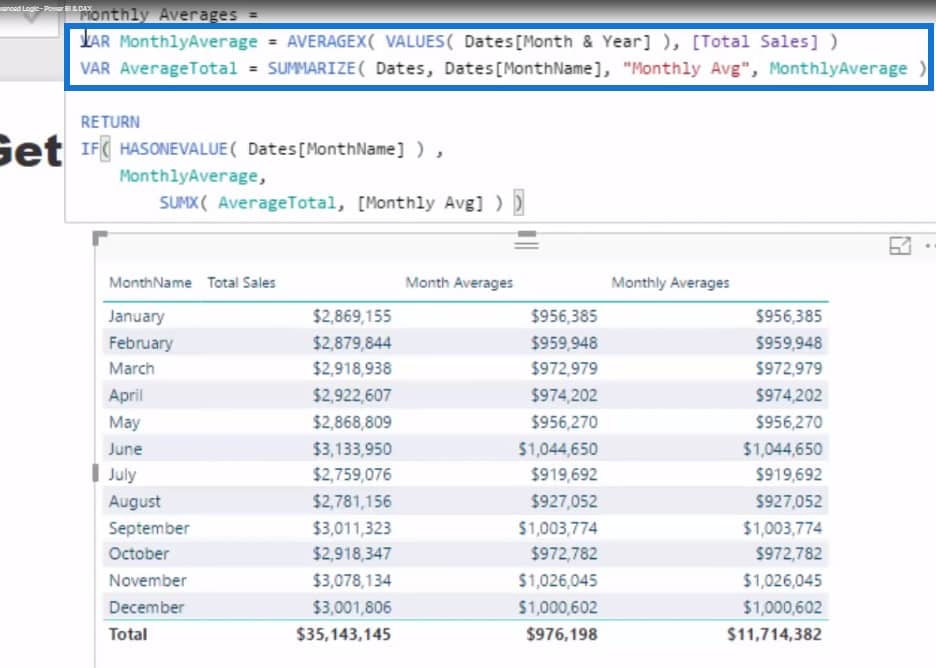
I’ve also used SUMMARIZE to summarize the Dates[MonthName] and the Monthly Average. This table is going to list every single Month Name and work out the Monthly Average. So it is basically going to create the Month Name and Month Averages columns below.
Incorporating HASONEVALUE as Logic
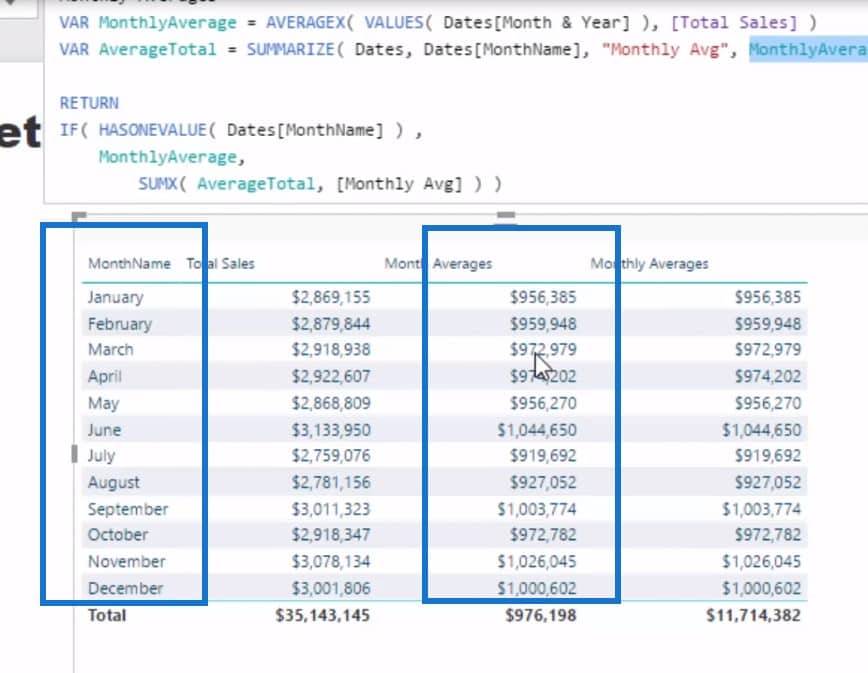
This will enable us to create some additional logic to calculate the total. We will need to use the IF HASONEVALUE function, where it is going to evaluate to TRUE if it is filtered by any one of those under the Month Name.
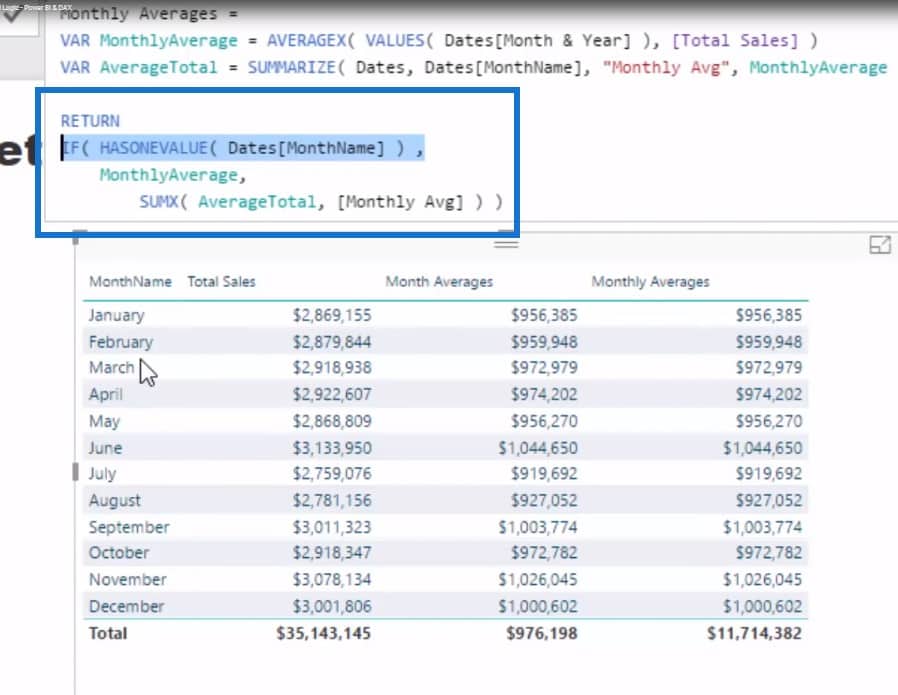
Depending on the column we put in there, IF HASONEVALUE will equal to the result. If it doesn’t, we need to do a different kind of logic.
This logic is going to iterate through the table function that we created (AverageTotal), and then using the SUMX function, we’re going to count up the Monthly Average column.
This logic is powerful in itself because we’re not even referencing a measure here; we’re referencing a virtual column inside of a virtual table. This is amazing stuff, right?
By putting this inside of SUMX, we can now get the total for all the results and then use it in a card.
***** Related Links *****
Calculate Rolling Totals Using DATESBETWEEN In Power BI
Calculating % of Totals
Dynamically Compare Current Totals To Last Years Totals

Conclusion
There’s a lot to learn around the possibilities of measures and how these could be applied to get the correct insights and results that you’re after within your Power BI reports and models.
This is quite an advanced example where I went through some iterating logic and utilized iteration functions within Power BI.
If you can spend some time digesting the information and understand how to implement advanced logic in Power BI, you’ll be at a very proficient level in no time.
For many more advanced DAX examples, check out the below course module at Enterprise DNA Online. I think you’ll be amazed at the insights that you can discover by using DAX effectively within Power BI.
Sam


