Through the example in this tutorial, you will see how powerful Power BI can be as an analytical tool. We will analyze a specific insight using Power BI analytics and then demonstrate it in a compelling way. This analytical work is seriously not possible in any way, shape, or form using existing tools like Excel. You may watch the full video of this tutorial at the bottom of this blog.
Being able to do this in Power BI enables you to find these advanced insights that create immense value for your consumers and organizations.
We’ll go over some pretty advanced insights that really highlights the analytical power of Power BI. I’m going to go through a combination of steps, which is a good opportunity for me to show some of the more advanced Power BI analytics work that I do on a daily basis.
The insight we are trying to achieve here is to discover if our revenue growth is profitable. This is a perfect example of where insights are so important, because there’s no point in growing from a revenue perspective if your profits aren’t growing, right?
Determine If Revenue Growth Is Profitable
In general, if you’re going to increase your revenue, you want to make sure your profits grow as well. I’ve worked this out from a holistic perspective and determined overall company growth and company profit growth.
I’ve also broken it down by customers, because even if you are growing from a revenue and profitability perspective, there could be some underlying customers that you’re selling to which aren’t. You probably want to discover who these are and get rid of them.
YoY Growth And Profit Growth
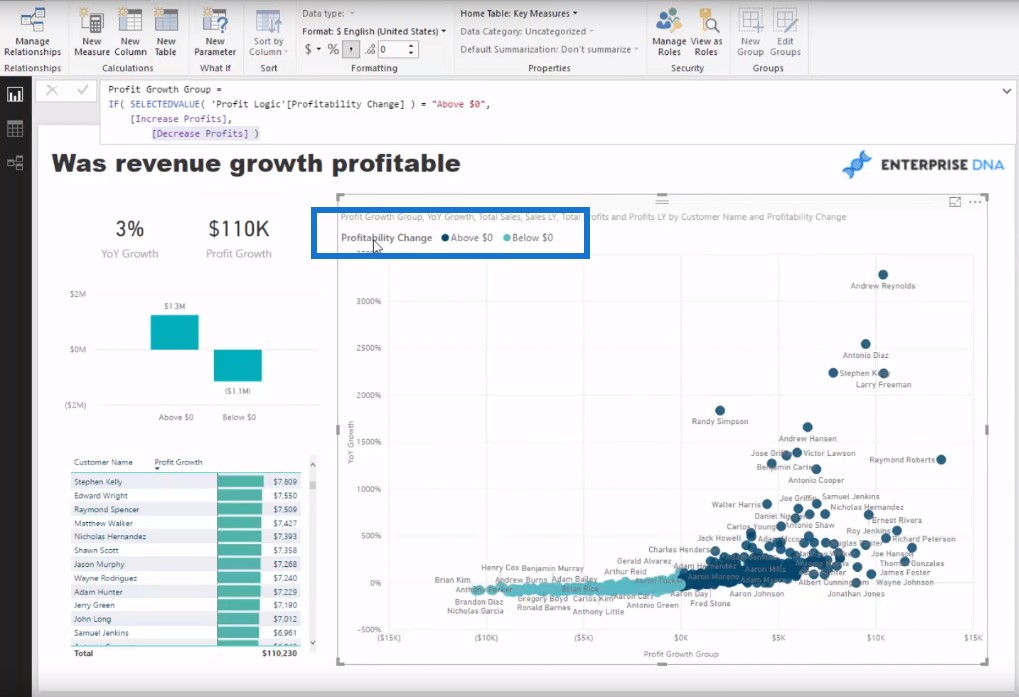
Let’s take a look at the functionality. On the table, I have my Overall Revenue Growth and Profit Growth numbers. As you can see, we are growing from a revenue and profits perspective.

I have also created some advanced logic using Power BI analytics to determine which of my profits growth were above $0 and which of my profits growth were below $0 from a customer perspective. I have also analyzed all my customers and determined which profits have increased versus which have decreased. I have also broken it down in such a way that I can have a look at each individual customer and the underlying profit growth.

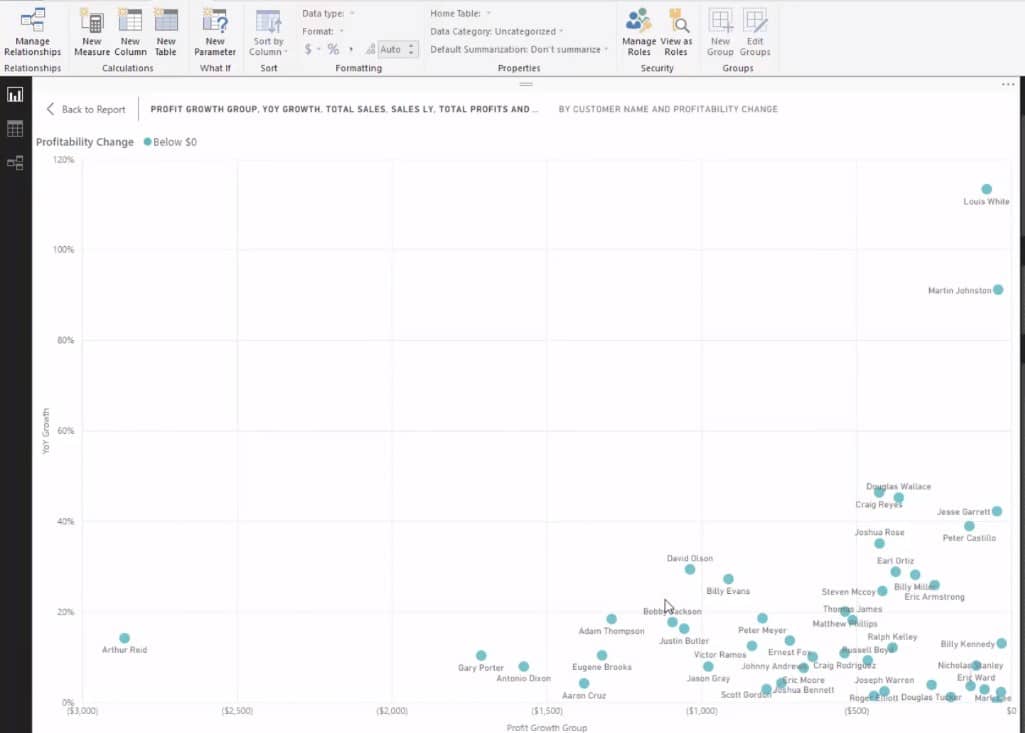
What we’re trying to see here is where the revenue is increasing but profitability decreasing. This is the particular insight we want to achieve here. What we can do with this chart is to dive in and look at the customers that have decreased profits. You can see the Profit Growth in the scatter chart and see where the profits are declining because they’re all negative. On the y-axis, you can see the YoY Growth.
So we’re trying to drill into these customers where the revenue growth was positive but the profit growth was negative. We can also drill even further using the visual level filters in Power BI. For example, let’s have a look at the YoY growth and say it’s greater than 0. You’ll see these are the particular customers that we need to understand.

Why is their profit growth higher while their revenue growth has gone up? For example, this customer, Martin Johnston, has a profit growth that hasn’t changed a significant amount but it’s interesting that the revenue growth has gone up so much.
What’s the point of increasing the revenues of this customer if our profits haven’t increased? This is a good question to ask and an actionable insight that you can try and work out internally.

Year-on-Year Growth From A Revenue Perspective
First of all, you have to set up your general core calculations such as your Total Sales and Total Profits which are something I have done demonstrations a lot of times. The next step is to work out the standard year-on-year growth from a revenue perspective using the Sales Last Year measure and DATEADD, a time intelligence function.

From there, I was able to work out the YoY Growth using this formula: Total Sales minus Sales LY, divided by Sales LY.

Profit Growth
We came up with our Total Profits by deducting our Total Costs from our Total Sales.

We also have our Profits Last Year using exactly the same pattern as I had used in the last one.

Then we have the Profit Growth by going with Total Profits minus Profits Last Year.

Measure Branching
This is where measure branching comes in. You start out with these simple calculations and then you branch out. None of the formulas I have used are exceptionally difficult; it’s just that I’ve gone one step after another. If you try and write all these formulas all in one go, it will be very complex. But if you do it like this, it becomes more intuitive. You’ll be able to reuse those initial core measures in lots of different places. This is why it is essential to implement measure branching whenever you are doing Power BI analytics.
All of the steps above have given us the YoY Growth and Profit Growth, right? But we need to somehow create a little bit of logic that says what is above $0 and what is below $0.
I want some additional insight where I could actually see where the above 0 profit growth is. This is not initially in our models because this is a derivative insight that is further down the chain of measure branches. There’s no way to slice this. Fortunately, this is where some of my more advanced analytical techniques inside of Power BI really come into their own.
Profit Logic
First of all, I had to create a table and called it Profit Logic. This will serve as a legend or slicer that I can integrate into my model. I have here the Above $0 and Below $0.

I had to create two measures – one which evaluates the Above $0 and one which evaluates the Below $0.
Increase Profits Measure
This measure calculates the Profit Growth and evaluates every single customer’s growth if it has been above 0. What VALUE is saying is if this customer is above $0, calculate the Profit Growth.

Decrease Profits Measure
I have reused the same pattern again which says to calculate Profit Growth if the customer’s growth is below $0.

Profit Growth Group
These two formulas are going to evaluate every customer but then we need to do another formula that says if the Profitability Change value or dimension is above $0, it will retrieve the Increase Profits measure. If not, retrieve the Decrease Profits measure.

We can now see the Profitability Change in our legend. If we take that away, you’ll see that this evaluates everything below 0.

But if we bring in Profitability Change to the table, it will evaluate these measures.

We now have our scatter chart where we can really dive into our data because we can reuse this Profitability Change in different measures as well. We can click on below $0, and then determine if the YoY Growth is greater than or equal to 0. These are the customers that are dragging down profitability even though their revenue is growing.

From a commercial background, this is the stuff you really want to know and will add value to how you operate a business. These are the kind of insights that are very difficult to know especially if you have a lot of customers, but Power BI can unearth these things automatically if you just set it up well.
***** Related Links *****
Calculating Percent Profit Margins Using DAX In Power BI
Discover Where Your Profit Growth Comes From: A Power BI Tutorial
Predict Future Profitability within Power BI DAX Functions
Conclusion
In this tutorial, we tried to understand if our revenue growth is profitable. This is important because, in a lot of cases, you don’t want to grow your revenue unless it will provide future profitability for you.
Maybe in some unique cases you would, but in most cases this is a bad strategy. Growth for growth’s sake can sometimes kill a business’ long term viability.
You certainly want to understand per customer or per transaction if a particular sale is profitable based on the revenue that was achieved.
There are many great analytical ideas in this tutorial. Also I spend time talking about how I think analytically when using Power BI. For more Power BI analytics ideas and techniques, check out the course module below within Enterprise DNA Online.
Enjoy!
Sam
***** Learning Power BI? *****
FREE COURSE – Ultimate Beginners Guide To Power BI
FREE COURSE – Ultimate Beginners Guide To DAX
FREE – 60 Page DAX Reference Guide Download
FREE – Power BI Resources
Enterprise DNA Membership
Enterprise DNA Online
Enterprise DNA Events


