We’re getting specific today and really showcasing the analytical power of Power BI. Sensitivity analysis, or even running some ‘what ifs’ around this, allows you to almost predict what may happen in the future with your results. In this example, I want to see what will happen to my profitability if I am able to increase the gross margin on my sales. You may watch the full video of this tutorial at the bottom of this blog.
While you might think this is quite niche, which it is, it’s the techniques to get to these results which I always want to get across with these examples. As soon as you learn how to implement this, you’ll likely identify three to five other ways you can use it to find valuable insights in your own environment.

Sensitivity Analysis On Sales Margins
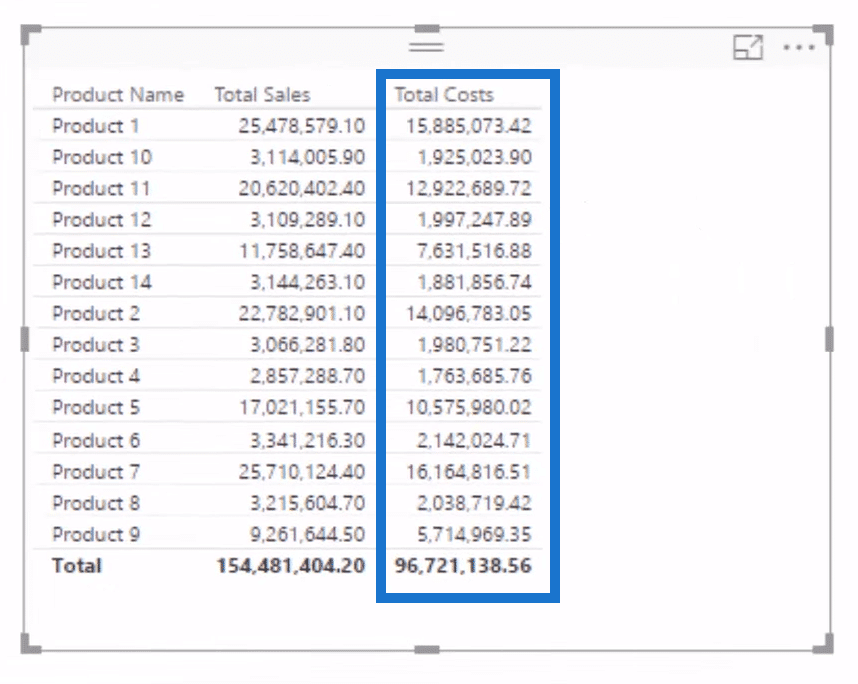
I am going to show how you can run some sensitivity analysis on changes that you might want to make on your sales margins so we can calculate our Gross Revenue Margins based on what we have achieved from our Total Sales and Total Costs.
But then, we might want to try and see what happens when we expand or contract, and see what that does to our Total Profit because if we expand Gross Revenue Margins, we actually expand Gross Profit Margins more.
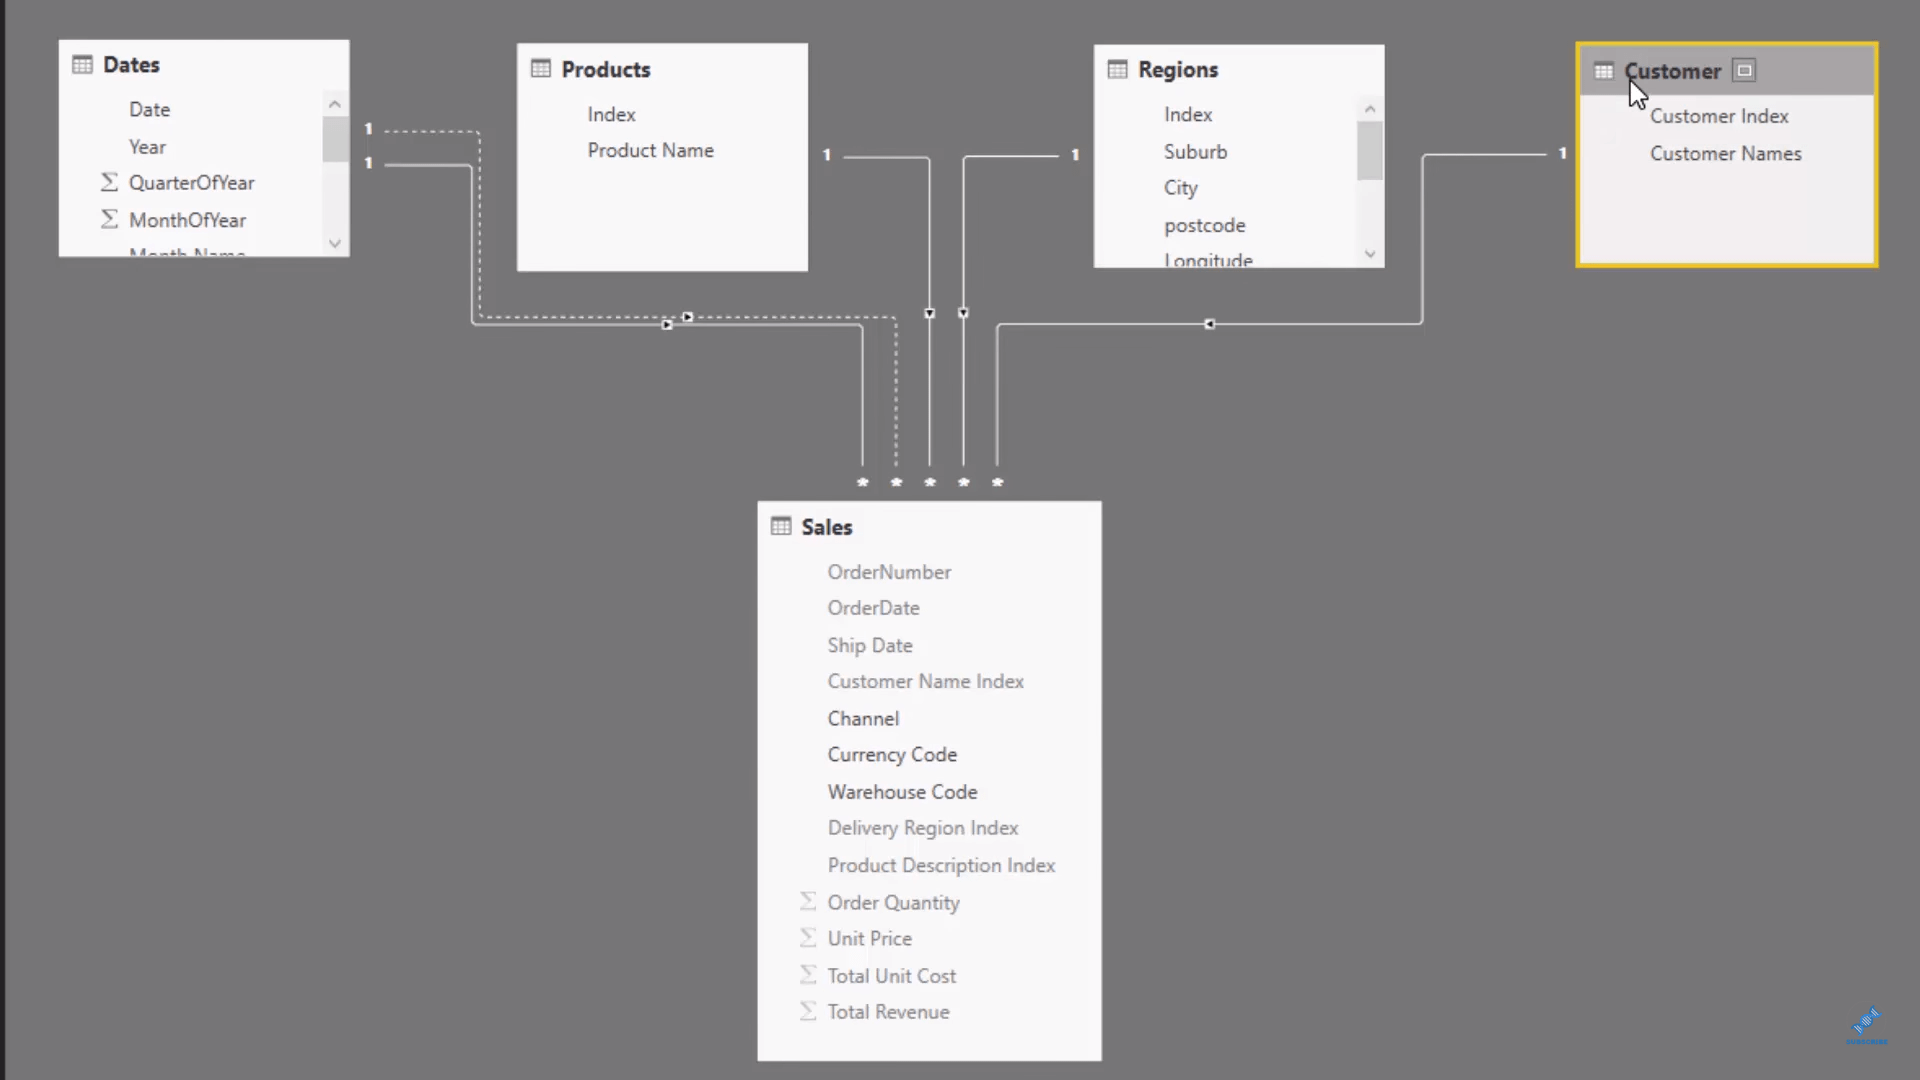
So how do we set this up? How can we do this analysis in Power BI? The first thing is to look over our data model. We have a pretty simple data model set up—we have the Dates, Products, Regions, and Customers on top, which are all connected to the Sales table at the bottom.
We are now going to create our first measure and put this into a measure table, then call it Key Measures.
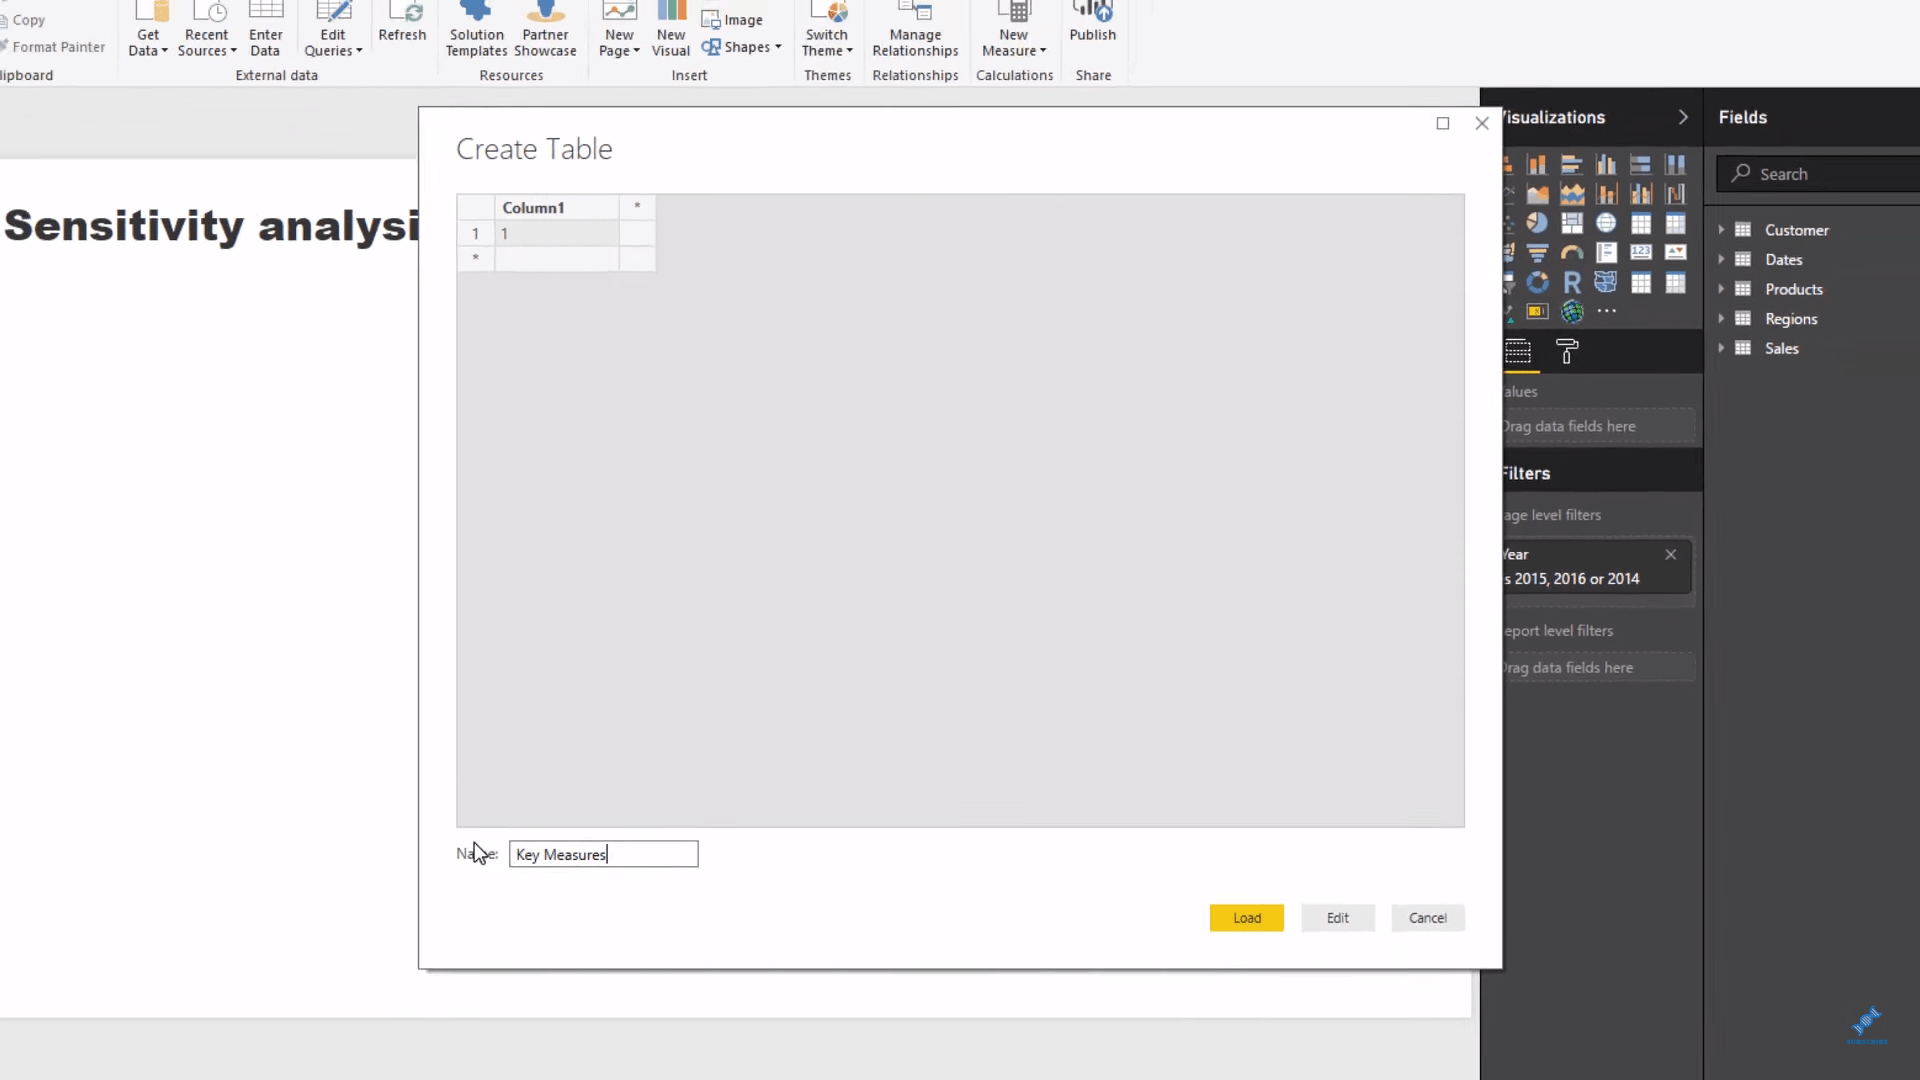
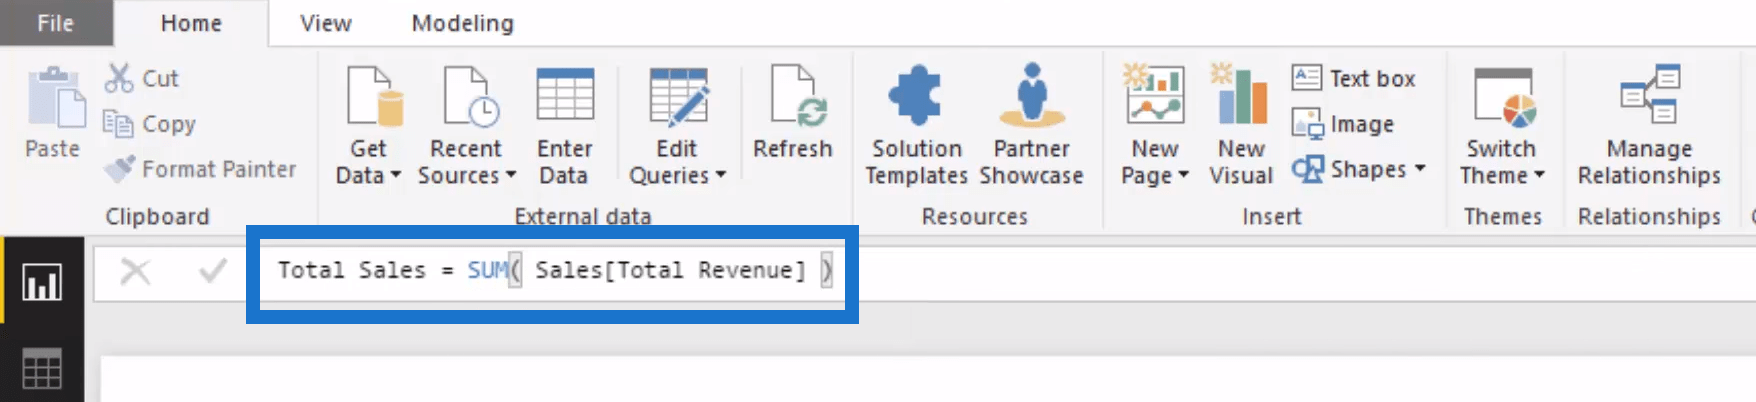
We’ll set up our first measure and call it Total Sales. This is a simple core measure where we will sum up the Total Revenue column and make this into a measure table.

Getting The Total Cost
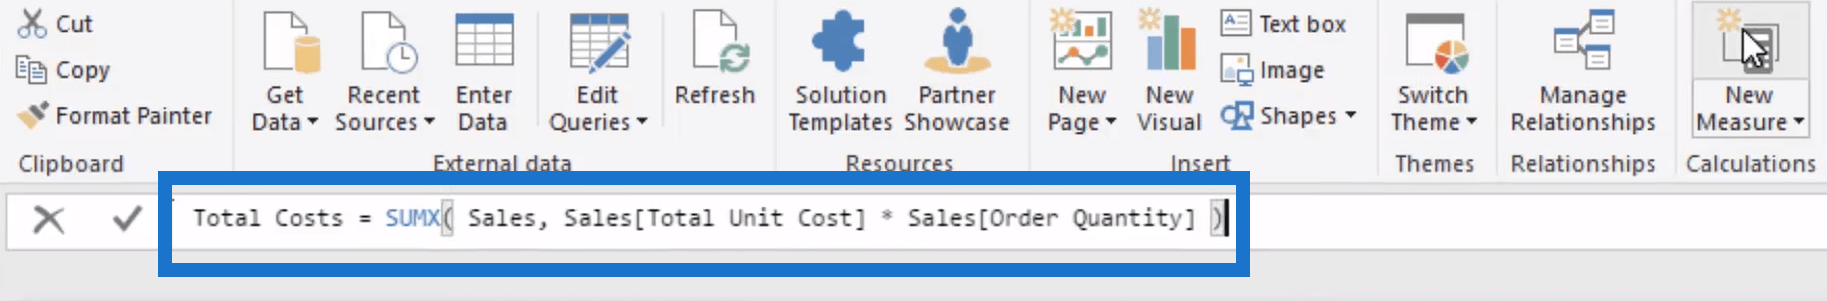
Let’s put our Products into the canvas and place our Total Sales next to it. The next thing we want to work out is our Gross Revenue Margin, so obviously we first need to find out what our Total Cost is. We will create a measure and call it Total Cost, then use the SUMX function as our expression.
Now that we have the Total Cost in our canvas, we can work out our margin.
Determining The Gross Revenue Margin
We’ll create a new measure and call it Gross Revenue Margin using this formula:
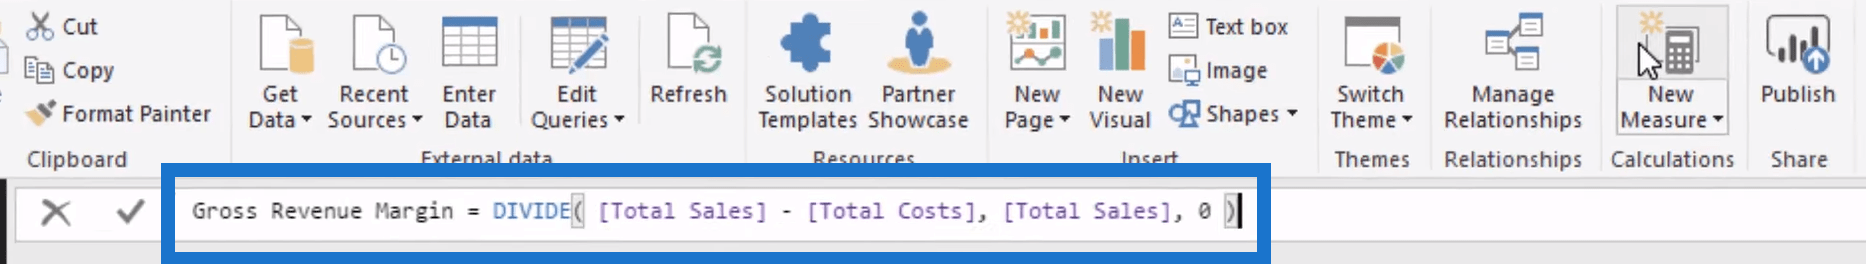
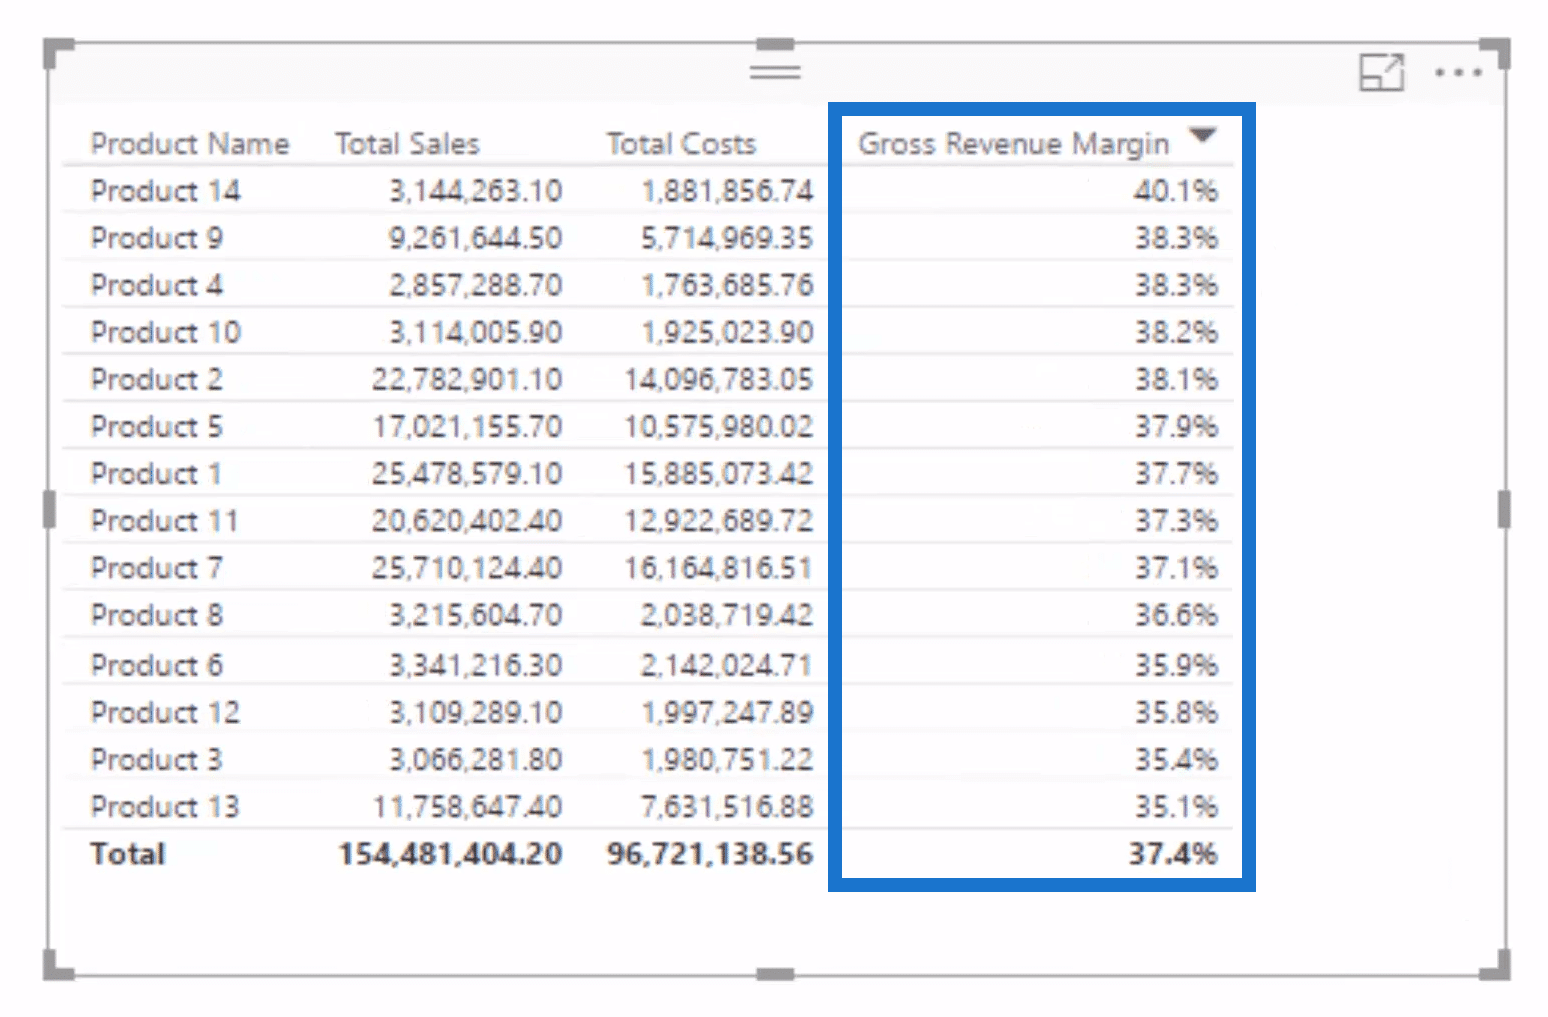
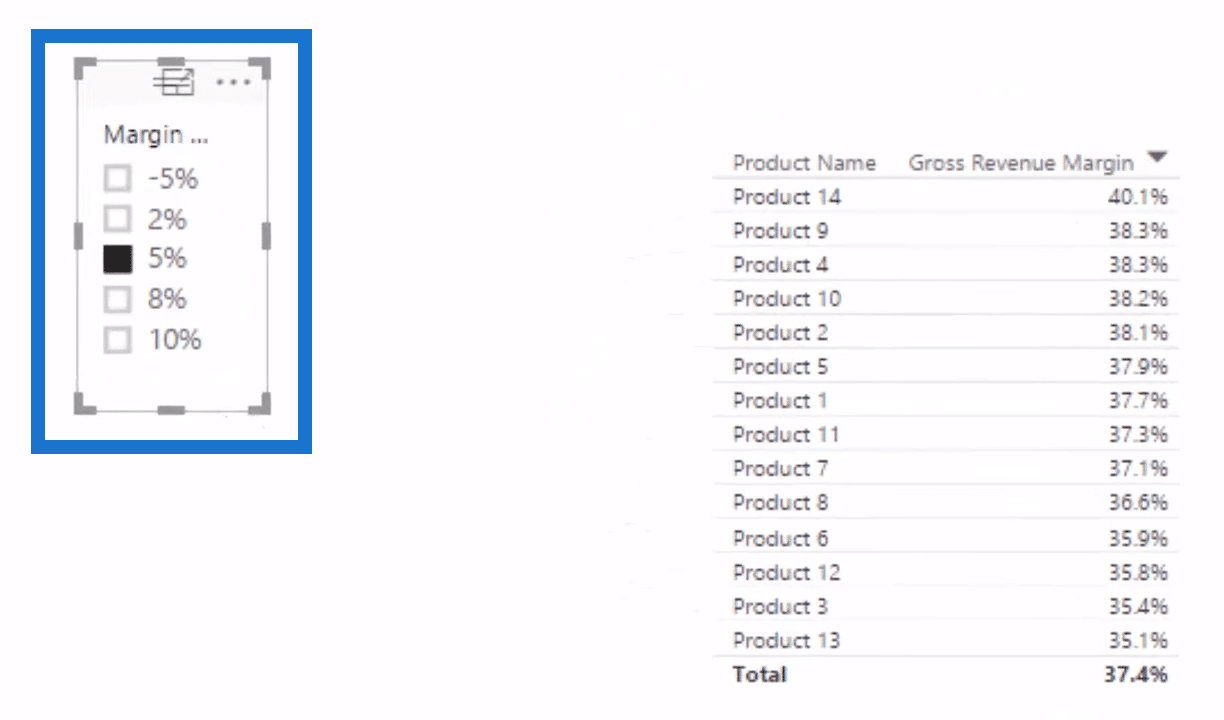
Once we put the margin in our table, we can get a percentage out of this and see what our Gross Revenue Margin is for every single product. Obviously, we will need to format these things as we go along, especially the percentages. We’ve also sorted it out from highest to lowest.
What we want to do here is to shock these margins and increase them by 2%, 5%, 8%, and 10%. This way, we can see the flow-on effects to our profit margins. We just click on Enter Data to create a supporting table or a parameter table which will enable us to harvest the margin change. We will call this Margin adjustment, and then place the percentage numbers below that:
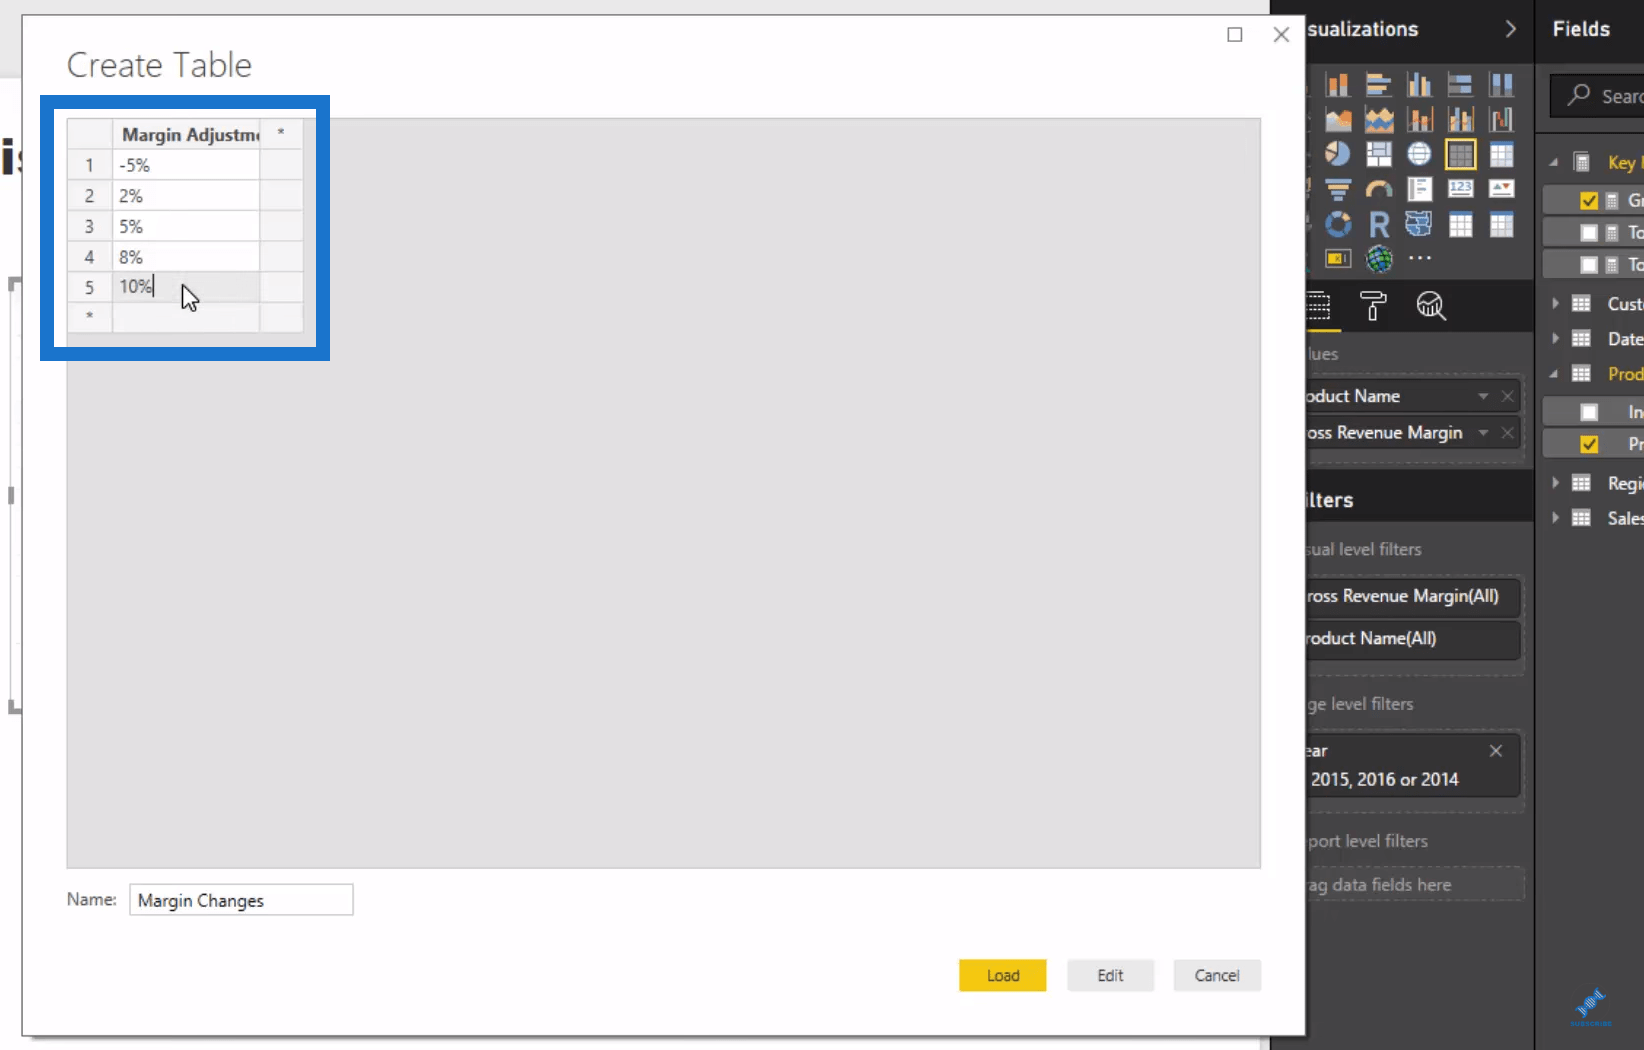
The next step is to load in the supporting table and turn it into a slicer to make a list. We want to be able to select any of the percentages in the left table and then see the impact simultaneously on our Gross Revenue Margin table.
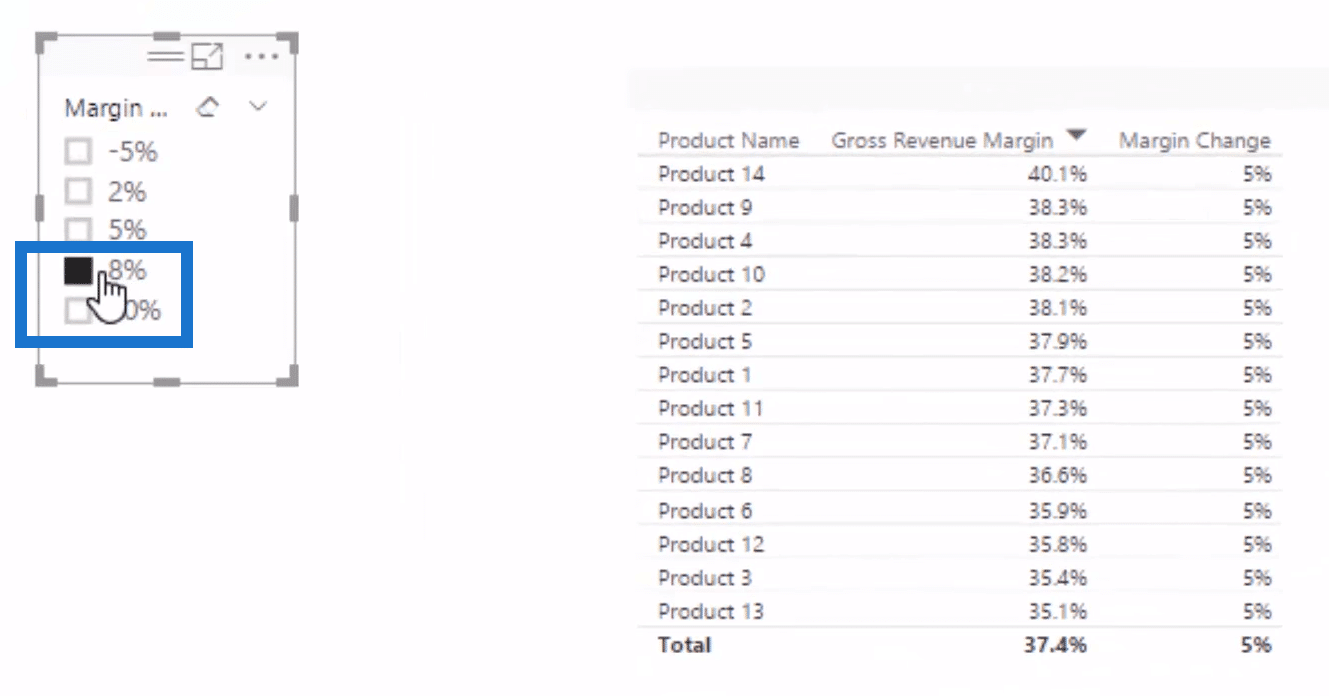
The next thing to do is to create another measure, call it Margin Change, and incorporate this logic:
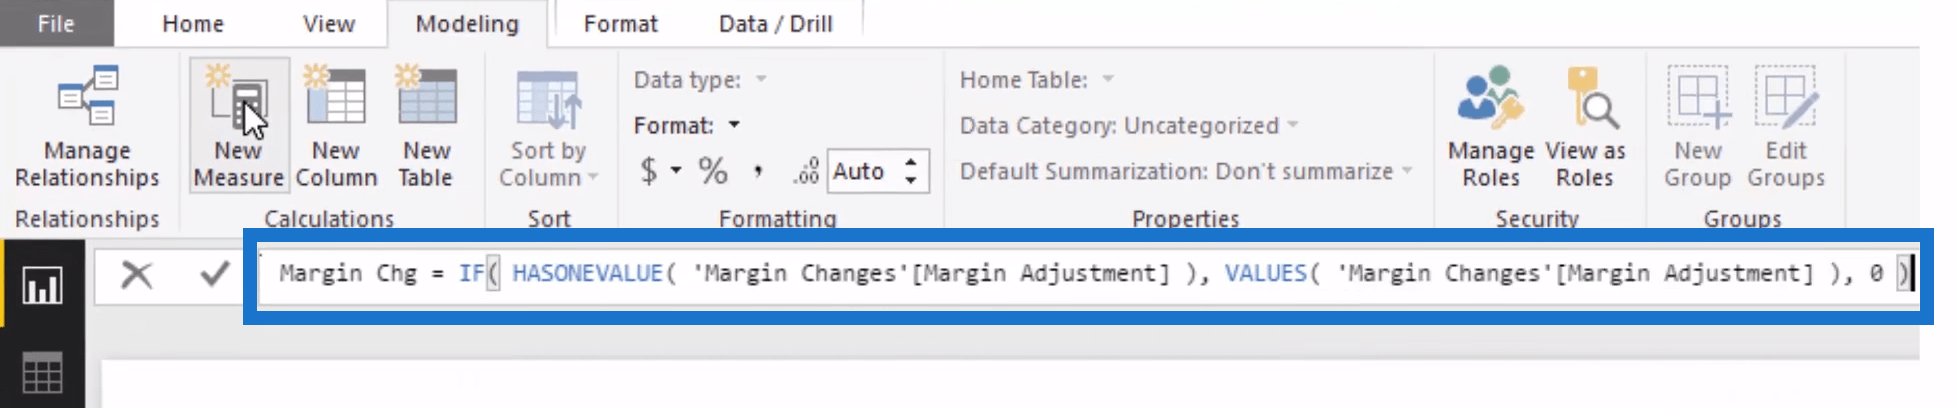

Once we drag the Margin Change into our table, we can see that the number under the Margin Change column is reflecting our selection on the left table.
Determining Scenario Gross Revenue Margin
Let’s create a new measure for the Scenario Gross Revenue Margin, which is the sum of the Gross Revenue Margin and the Margin Change. Once we drag this measure into our table, you will notice that the percentage numbers under the Scenario Gross Revenue Margin column change as we go through the selection in the Margin Adjustment table.
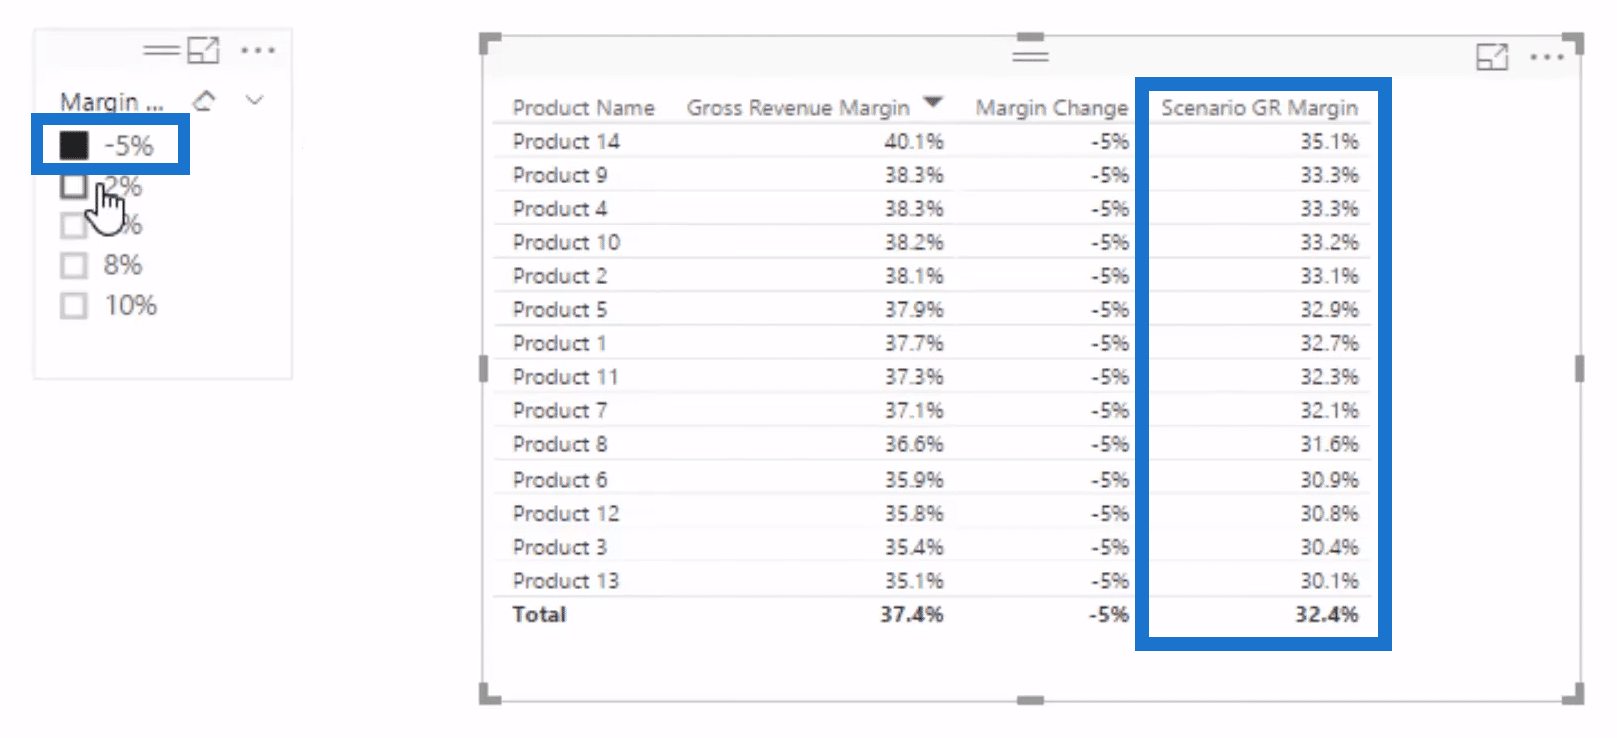
At this point, this is where we can run some scenario analysis. Let’s say we’re running behind our budget and want to catch up, we can increase our margins by 5% and see what this will do to our profits. Obviously, there will be changes to the demand if you are going to do that, but this is just to show you the technique you can use in the real-world scenario you might have.
Determining Scenario Sales & Scenario Profits
We can also integrate our Scenario Sales based on the Scenario Gross Revenue Margin. We’re going to add another measure and call it Scenario Sales. This time we’ll use our Total Sales, multiply it by the Scenario Gross Revenue Margin, and then add our Total Costs.
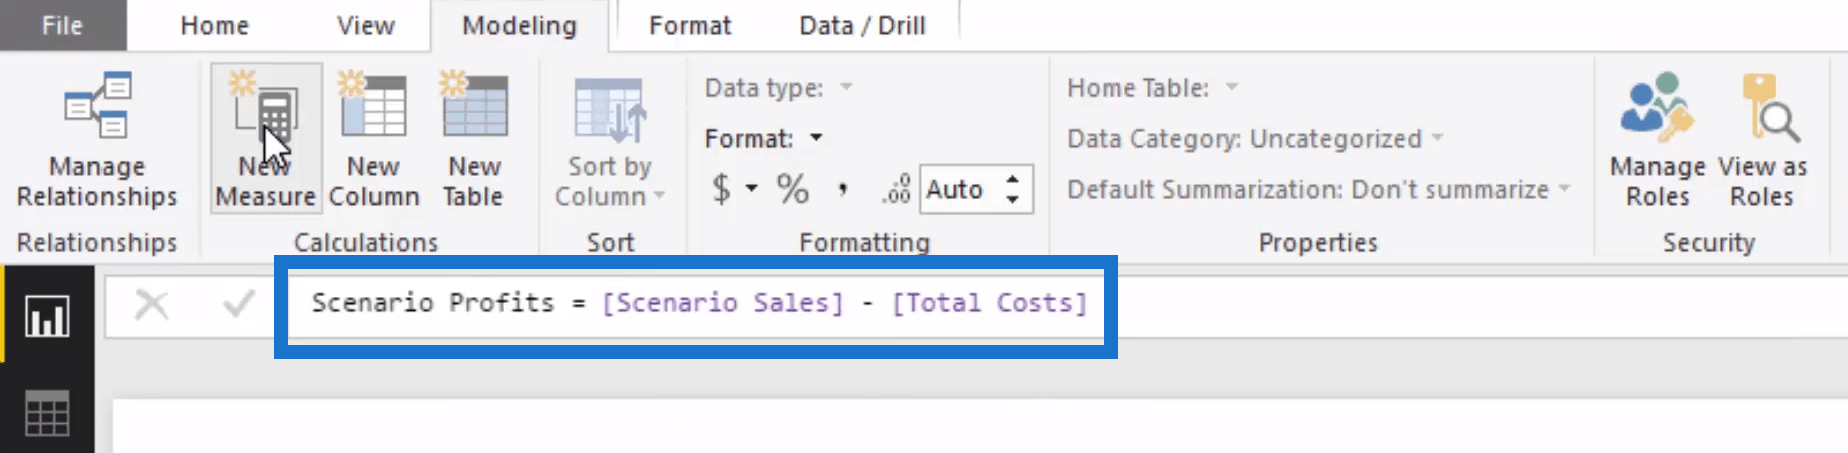
Once we bring the Scenario Sales into our table, we can work out what’s our Scenario Profit. We’ll be creating a new measure and call it Scenario Profits, where we’ll deduct our Total Sales from our Scenario Sales.
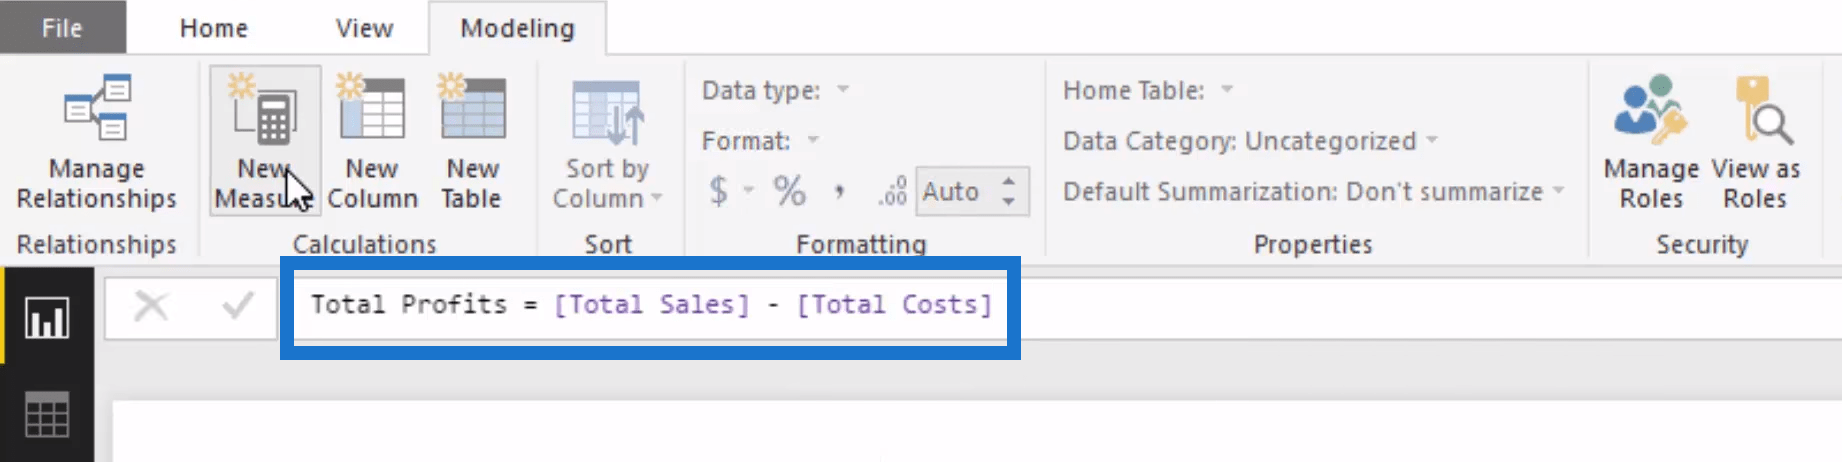
The measure we’ll create is the Total Profits because we want to see what the actual change in our total profits is going to be. We’ll be using this simple and straightforward formula to come up with our Total Profits, and then drag it to our table.
Determining Change In Profits
Now that we can see our Total Profits and Scenario Profits, we can figure out what is the change between these two columns.
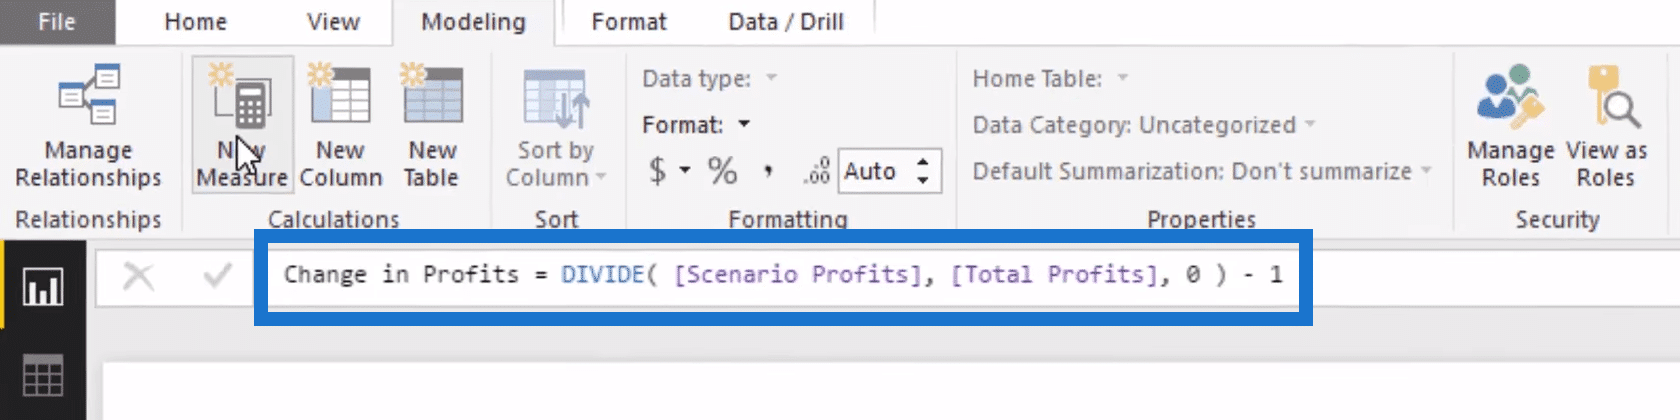
For our last measure, we’ll call it Change in Profits. We will put out some pretty simple logic where the Scenario Profits is divided by the Total Profits.
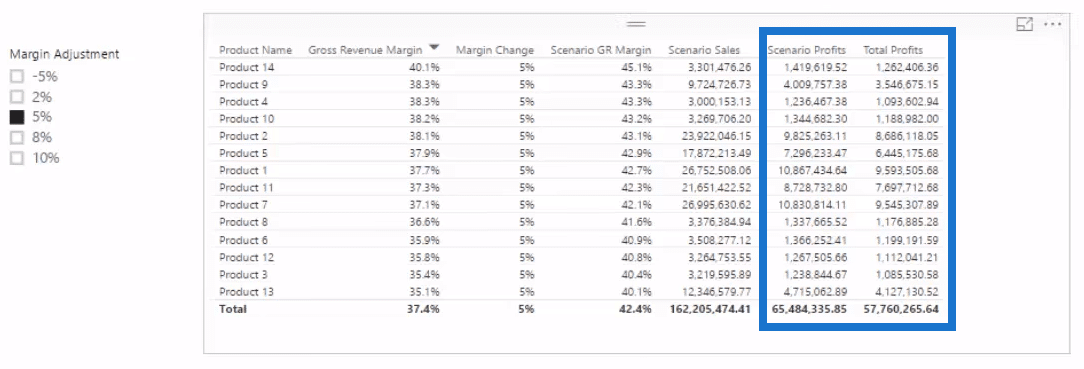
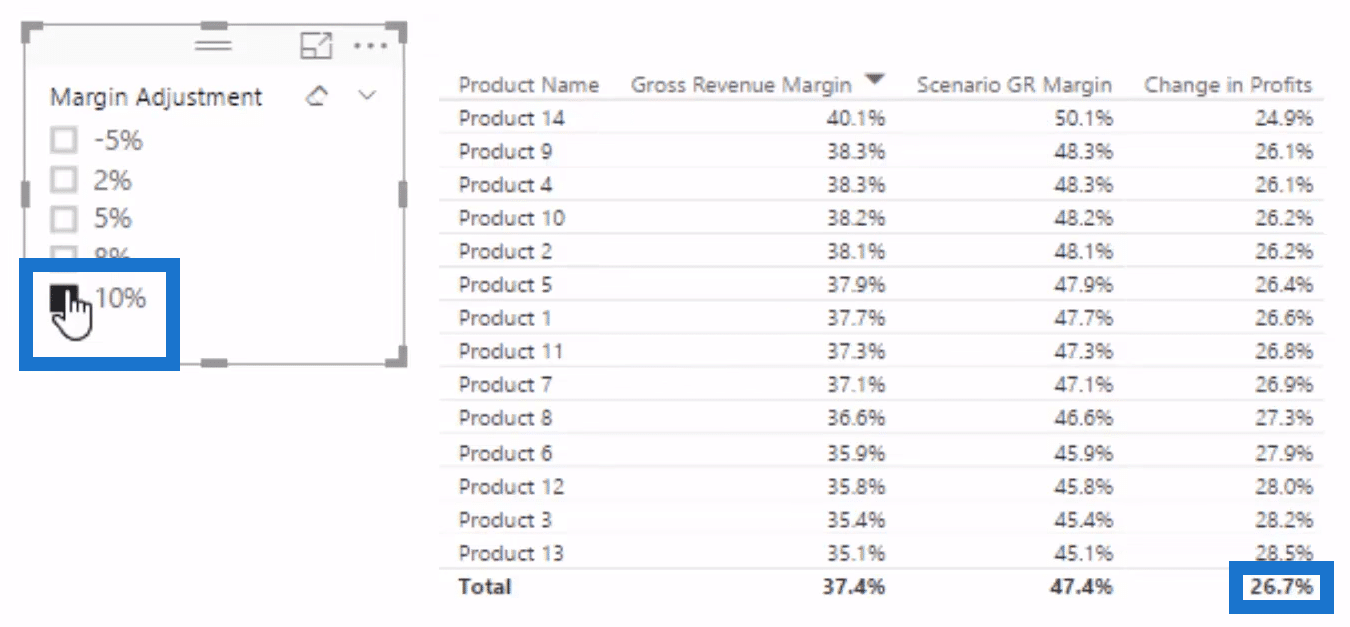
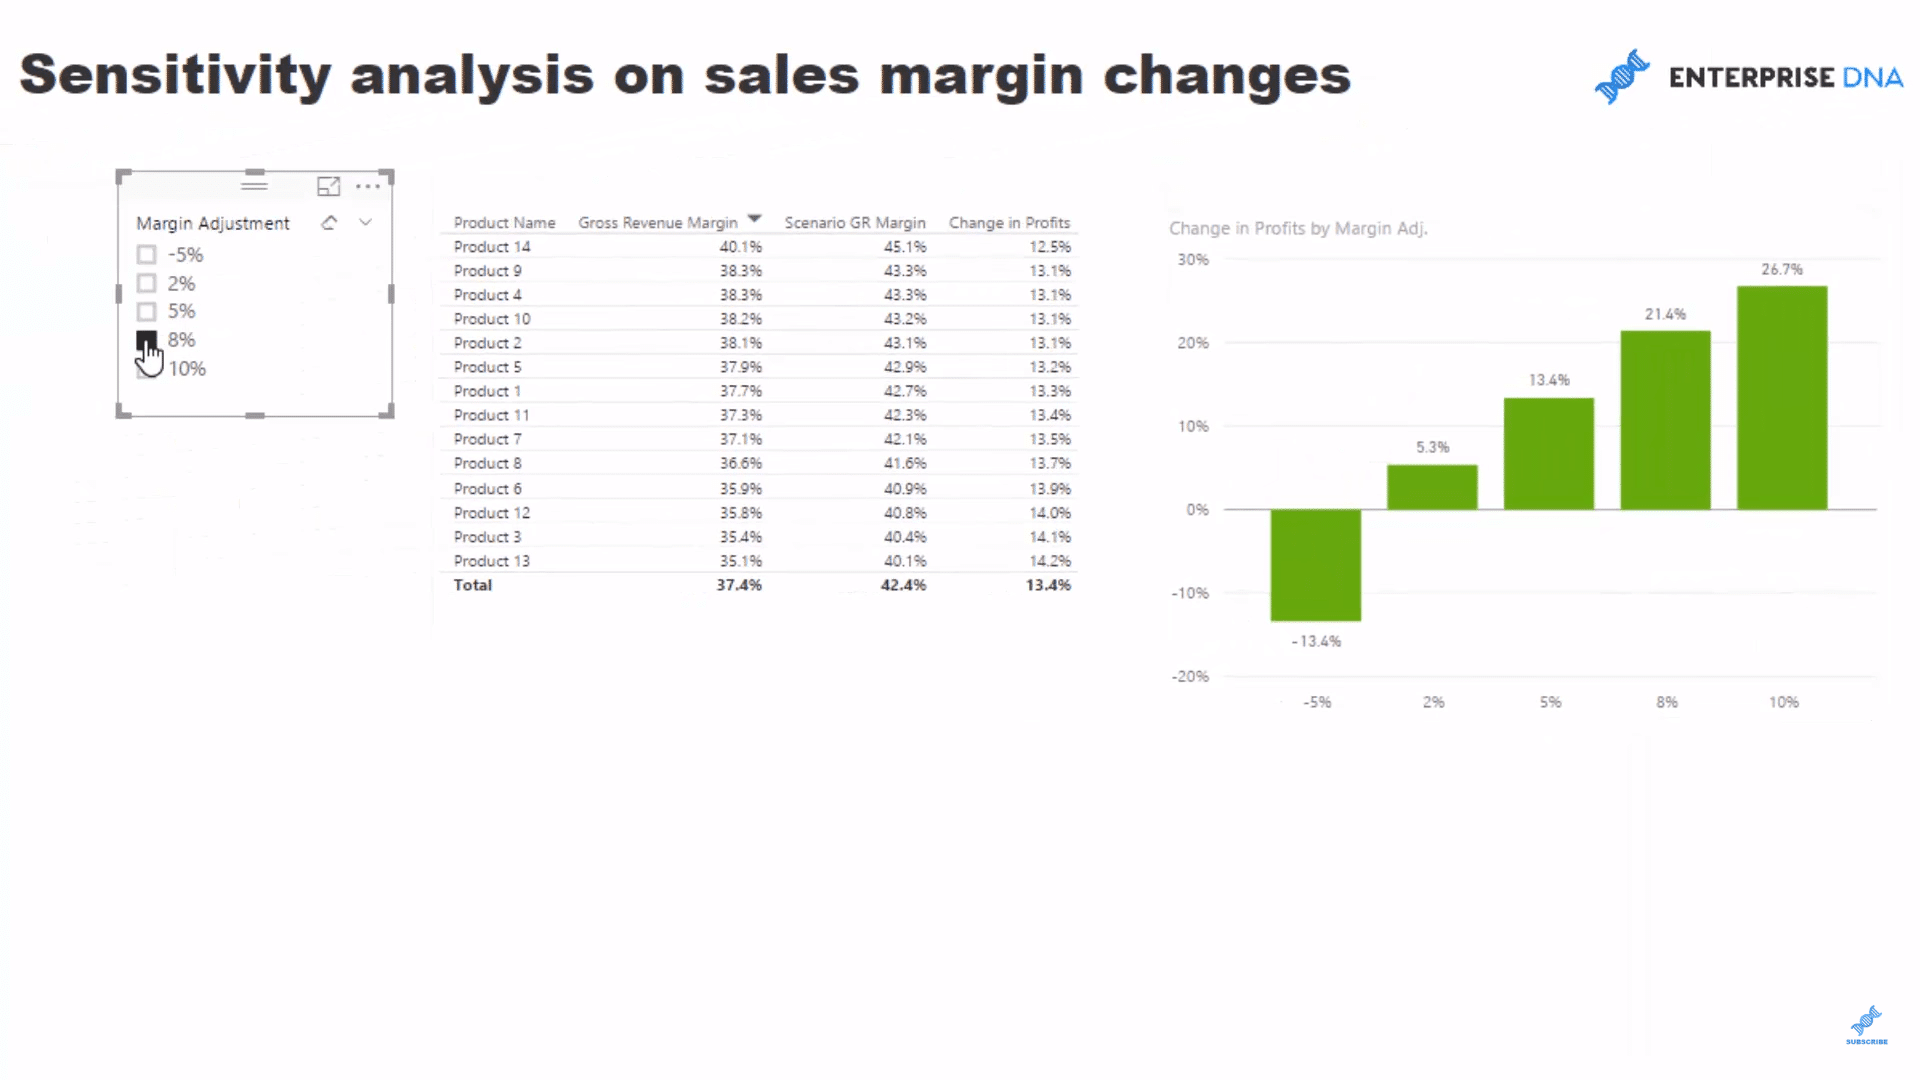
There are plenty of numbers in the table, so we can get rid of some of the intermediary calculations to keep things simple and easier to understand. For example, if we increase our Gross Revenue Margin by 10%, what changes will happen to our profits? As we can see in the Change in Profits columns, there is a pretty significant change. If we can increase the margins of our product sales by 10%, then we can increase our profits by 26.7% across every single product.
This is a pretty cool analysis, right? But what would also be cool is if we were be able to see from a total perspective, meaning what the total is for all of these changes. We can put these in a visualization which enables us to do just that.
Visualising The Data
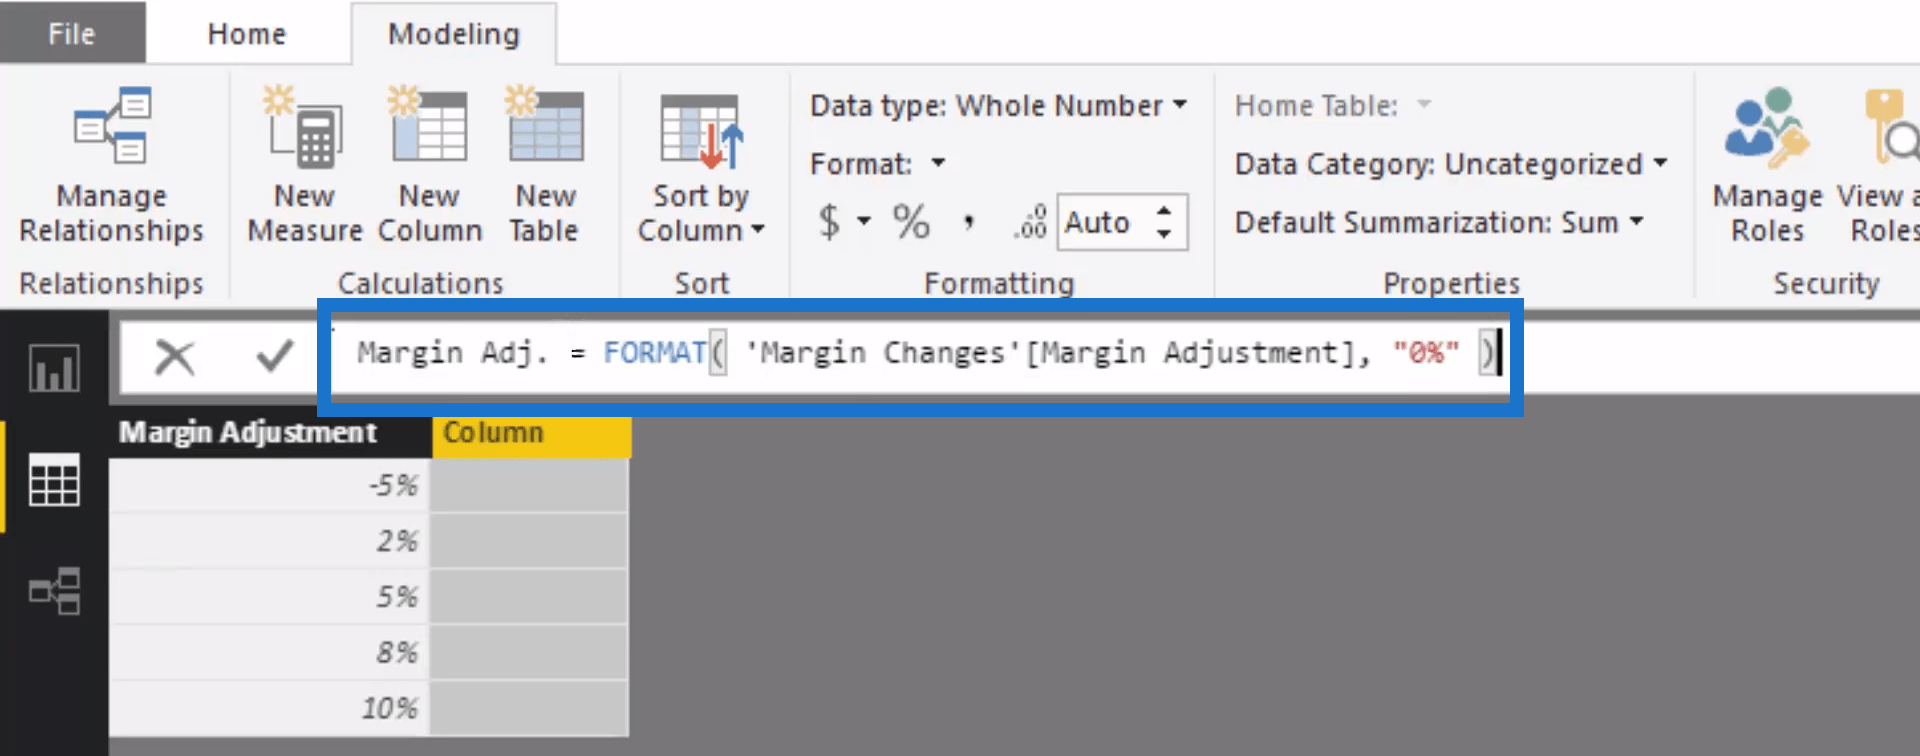
We will create a new table of our Margin Adjustment, edit the interaction, and click on Don’t Summarize. Then we will grab our Change in Profits and put it in the new table as well. Once we turn this into a visualization, we run into a small problem. Because it is a number, we have to create a text value out of it. So we need to create a new column, name it Margin Adjustment, and format it into a percentage like this:
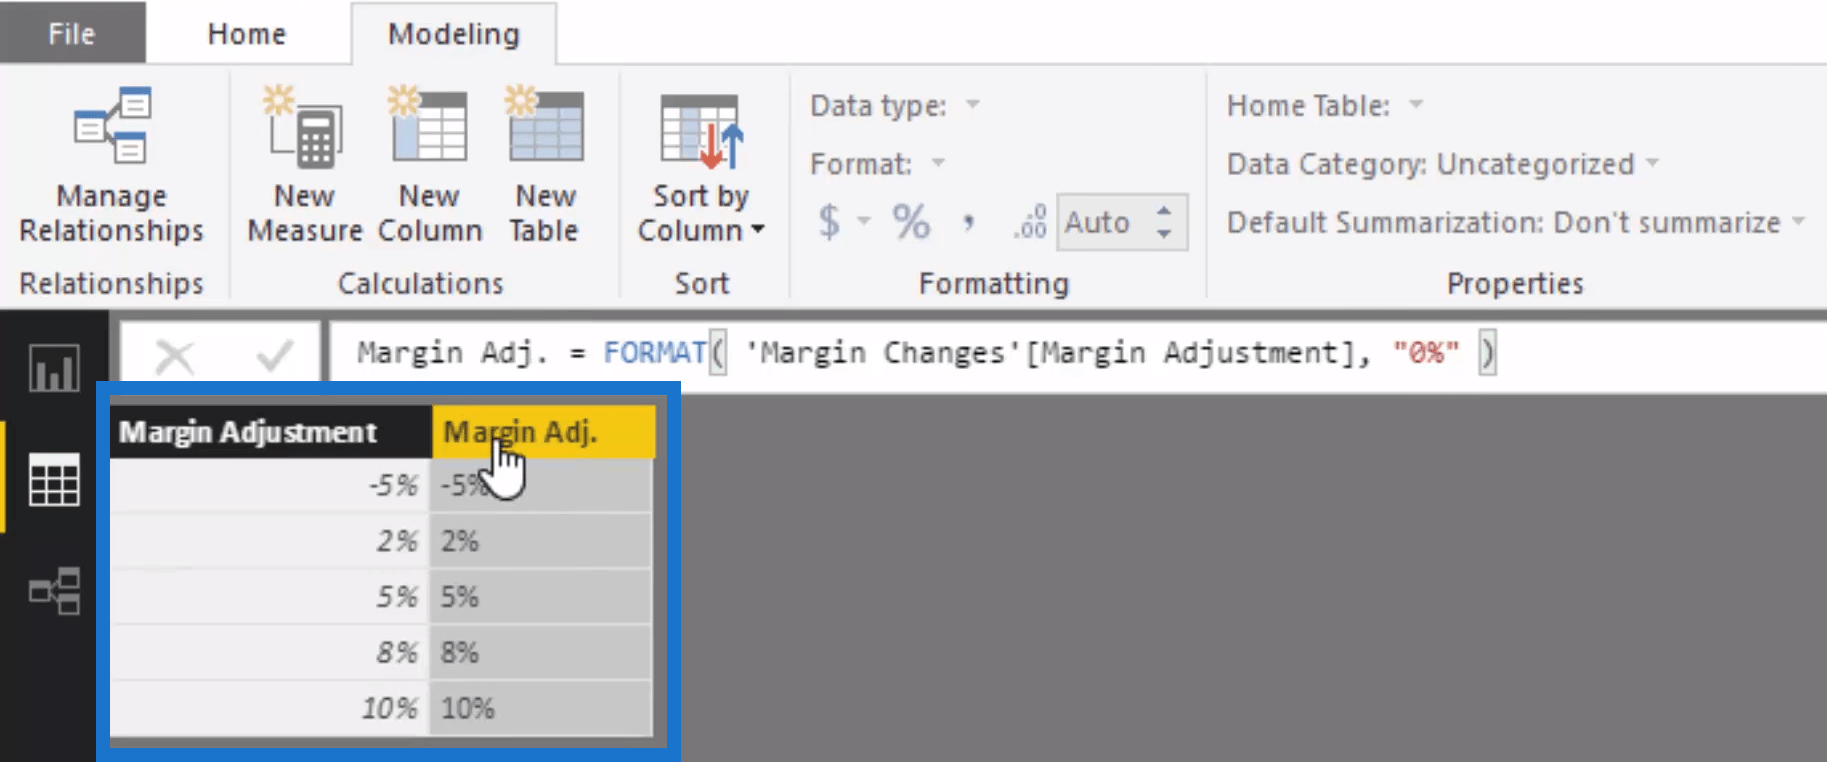
Now we can see that this data type is a text value.

Once we put this into the axis, we are now able to see all 5 values: -5%, 2% 5%, 8%, and 10%.
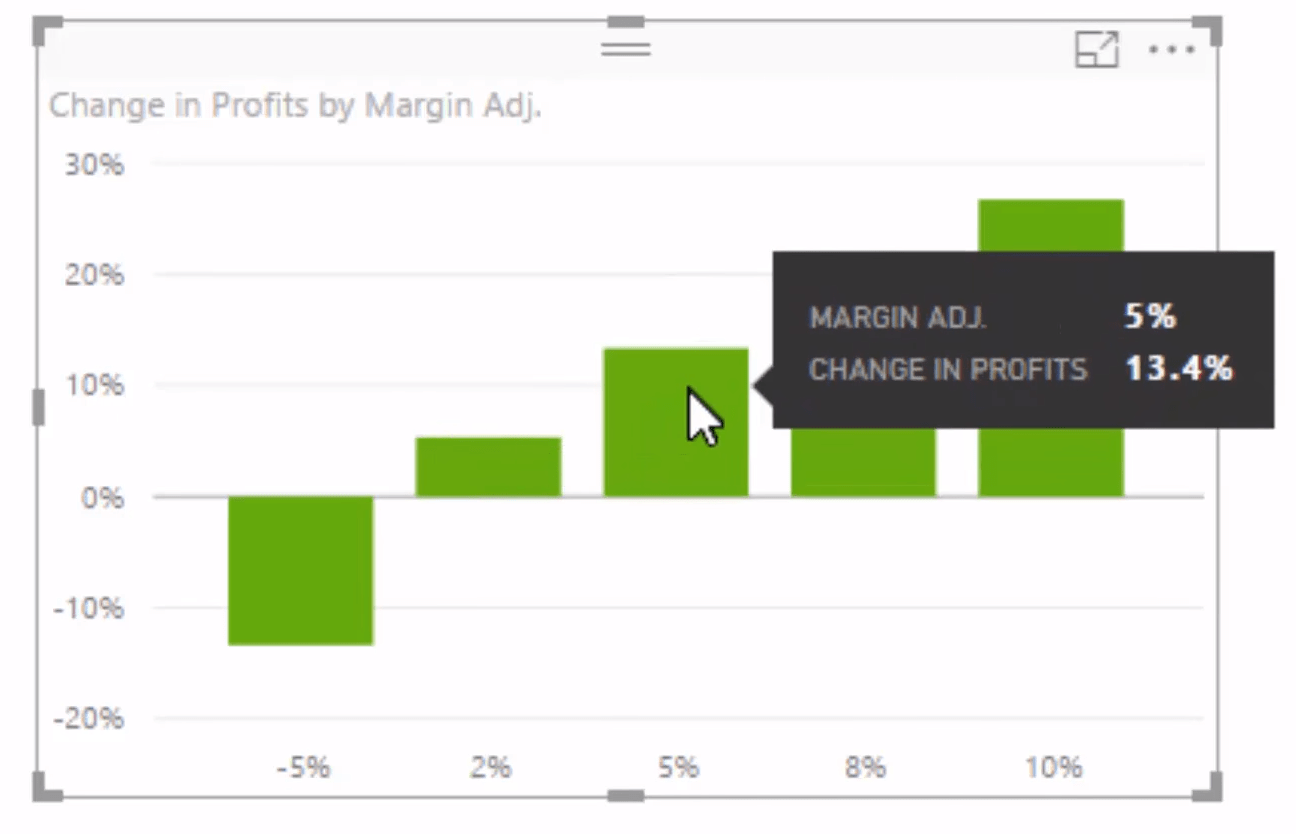
Now we have a compelling visual which showcases what will be the changes in profits based on any margin adjustment that we make. We can look at it from an individual product perspective (left table) or look at it from a portfolio perspective (right table). This is a cool technique that is applicable to lots of different scenarios. Once you nail down this technique of bringing in parameters and incorporating them through measure branching in your logic, you can do some pretty awesome stuff in your sensitivity analysis, scenario analysis, etc.
***** Related Links *****
Sensitivity Analysis Techniques For Power BI Using DAX
Calculating Percent Profit Margins Using DAX In Power BI
How To Start Using ‘What If’ Parameters Inside Power BI
Conclusion
There are ultimately so many things you could run sensitivity analysis technique on as well. And try to think about showcasing not just the immediate results, but think of the second or third order effects that changing a variable inside your calculated results will create. In this example, I’m not interested in just the straight change in profits from a change in gross margin – I’m actually looking for the percentage change in profits.
I also show you in this video a little trick around getting your sensitivity visualization sorted out so that they fit into you reports well. Definitely check it out to learn more.
You’ll see that it’s always going to be much larger than the scenario change you place into it. This is terrific insight that a CFO and employees at board level would want to understand about your results, or potential future results for that matter.
If you want to see how I develop and build reports from scratch, you can check out my Dashboarding and Visualisation Intensive course. It’s here that I show you, end to end, how to develop compelling Power BI solutions, combining techniques just like this one into a all-encompassing analytical report.
Got some thoughts or feedback on this sensitivity analysis technique? Let me know in the comments. Good luck implementing this one.