In this blog post, I’ll be bringing you the solution for working with timetables in Power BI, which is our Problem of the Week #10. This wasn’t an overly difficult challenge. But still, it was quite a niggly one that threw in quite a few curveballs. You can watch the full video of this tutorial at the bottom of this blog.
For those who are not familiar, Problem of the Week is an ongoing series that happens every 1st and 3rd Wednesday on the Enterprise DNA forum. The problem posted in the 1st week requires a DAX-based solution, while the 3rd-week problem asks for a Power Query-based one.
Just a quick reminder that for this DAX-only challenge, it was not only about picking a date, but also being able to select a start time and an end time for that particular time period.

How The Experts Worked With Time Tables In Power BI
While reviewing the entries, I saw some of the Enterprise DNA experts had provided excellent solutions. For instance, I really liked Jose’s approach to this challenge.

As you can see below, there was a very clever use of VARIABLES. The code was clean and tidy as well.

Greg’s approach was probably the most similar to mine in terms of splitting out the start time and end time into two separate tables, whereas Jose just used one.


I also think Alex made another nice entry. He used variables and a virtual table for the challenge.

Alex’s and Jose’s entries were my favorites for this challenge; I learned a lot, so definitely check out their submissions in the Enterprise DNA forum.
Haroon’s Solution For Working With Time Tables In Power BI
Let me walk you through my solution for the challenge. The first step was separating the start time and end time. Let’s change the header for our start time.
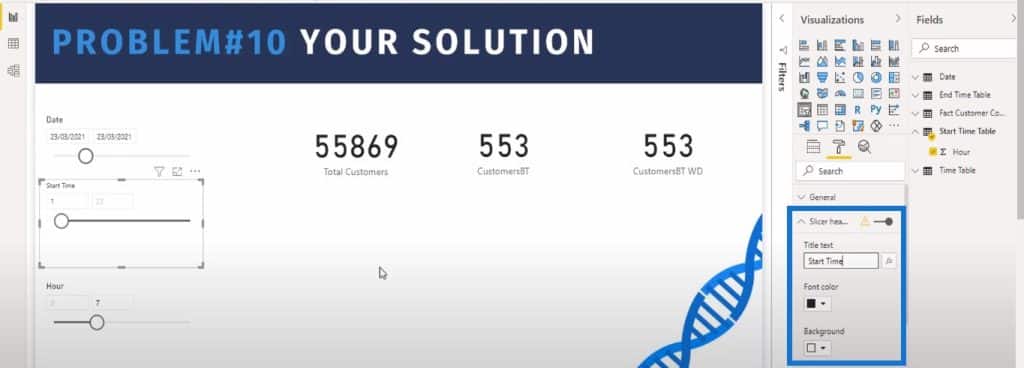
All I did was generate a series between 1 to 24. This allowed me to harvest that selection into our DAX calculation.

I know there isn’t much data in there, but what we want to be able to do is to see the results between April 23rd and 25th. The start time is at 5 o’clock on April 23rd and the end time is at 2 o’clock on April 25th.

Once we put in the start and end times, we can see the results updating.

The first step was setting up these filters. I created my start time and end time tables. I clicked on the Modeling ribbon and clicked on New parameter to generate the series.

And then I created a simple customer count calculation.

The next step is to determine the customers between the times. I wanted to find out what’s the date selected, and used the MAX and MIN functions to find out what was the biggest and smallest.

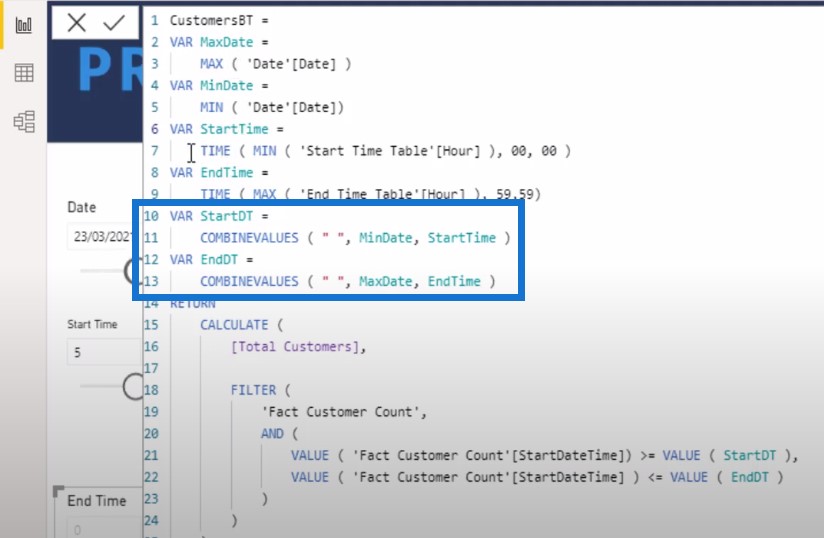
The MIN and the MAX are giving us the start and end times in this section of the calculation.

And then I just combined the start date with the start time, and the end date with the end time.
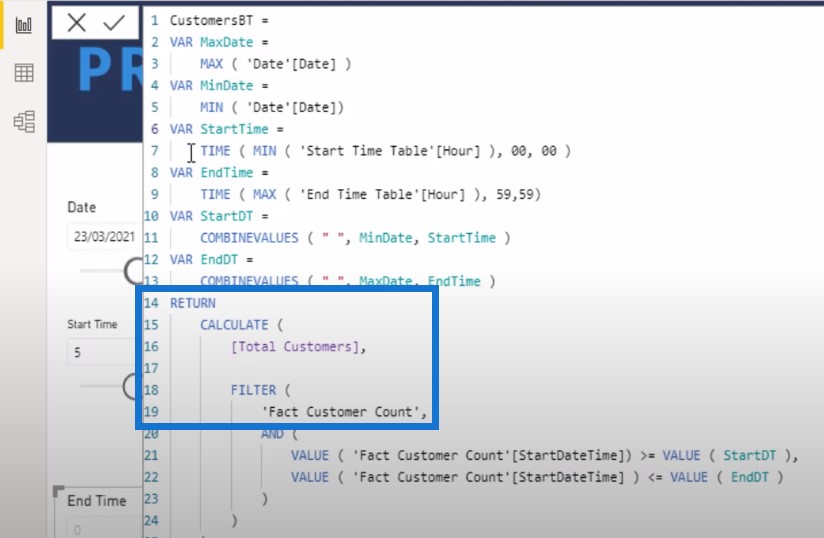
After that, I used the CALCULATE function on Total Customers, which filtered the Fact Customer Count.
I also wanted the StartDateTime to be greater than the StartDT, and less than or equal to the EndDT.
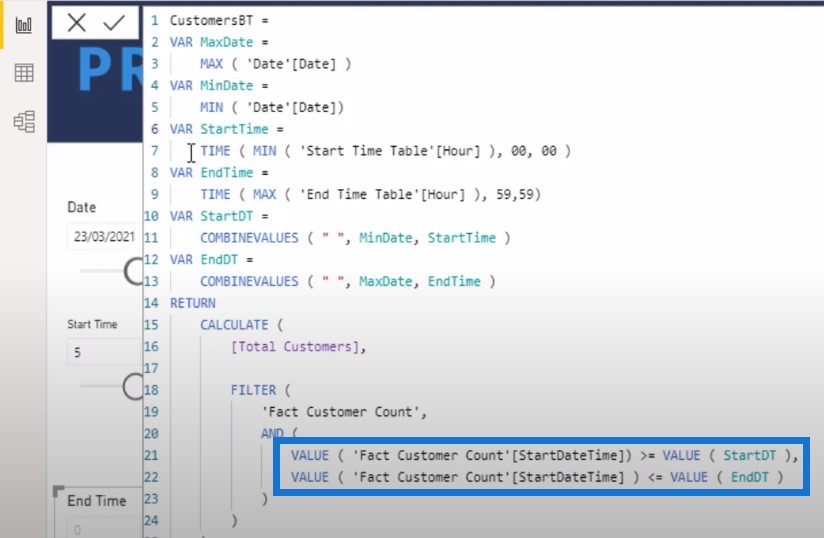
So this is what needed to be done for the first part of the calculation. I think one of the challenges was just being careful in terms of what was selected here.

The way you set up additional timetables to get the filter context can give you some funky-looking results.
Basically, we found out that if you don’t select Greater than or equal to for the start time and Less than or equal to in the end time, you will be getting some dubious results. But despite this glitch, this calculation still worked for me.
Using The Extended Date Table
The next step is to bring in the weekdays. Doing this has been made super easy with this amazing date table from our resident M code expert, Melissa de Korte.
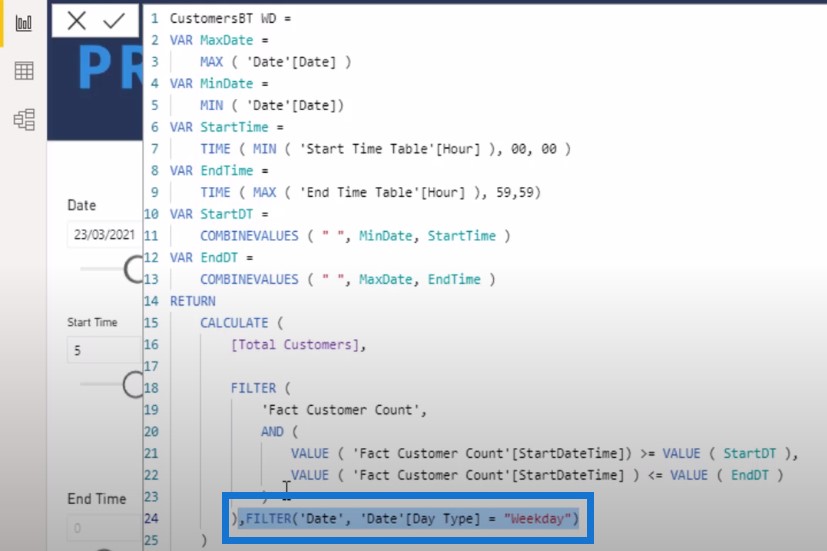
Before, we’ve been struggling to work out which are our weekdays and which aren’t, but using this absolutely amazing data from Melissa has been helpful. It covers everything you can think of, from custom financial years to offsets. This is a very powerful table, and it just makes your documents easier to write and even understand.
Conclusion
In this blog post, we learned how to work with time tables in Power BI, and how using tools like Melissa’s extended date table can make life easier.
If you enjoyed the content covered in this particular post, please check out others like this in our Problem of the Week series, which you can find in our forum.
Also, don’t forget to subscribe to the Enterprise DNA TV channel on YouTube, where we have a huge amount of content coming from a range of content creators who are all dedicated to improving the way that you use Power BI and the Power Platform.
***** Related Links *****
Time Period Analysis – Intro To Problem Of The Week #10
DAX Calculation Groups – Power BI Report for Problem Of The Week #7
Extended Date Table Power Query M Function
***** Related Course Modules *****
Ultimate Beginners Guide to DAX
Problem Of The Week
Mastering DAX Calculations
***** Related Support Forum Posts *****
Problem of the Week #10- Dealing With Time Periods
Problem of the Week #11 – Project Balance
Problem of the Week #12 (PQ) – Perpetual Holiday Calendar
For more on time period analysis, please see here…


