
Using variables is a great way to make sure that your results add up the way they should at the end of your measures. Variables are such a crucial part of writing and solving formulas inside Power BI and I’m going to show you why. You may watch the full video of this tutorial at the bottom of this blog.
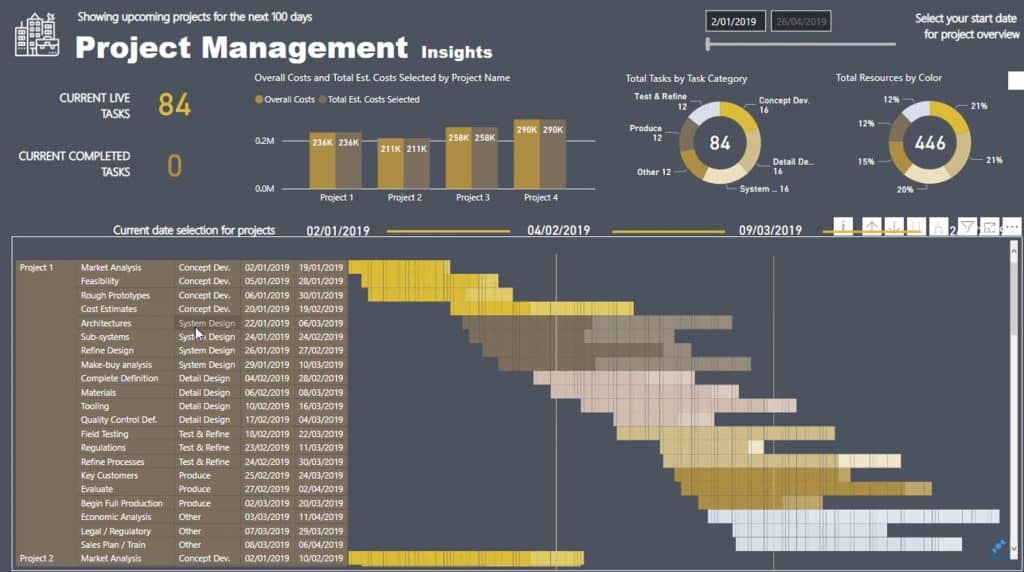
Sample Data Visualized In Gantt Chart
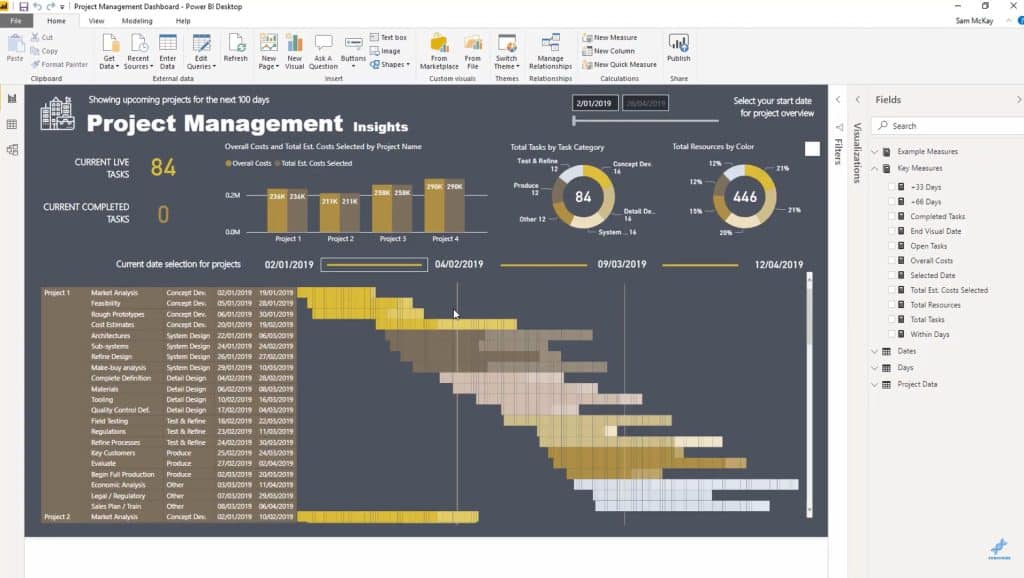
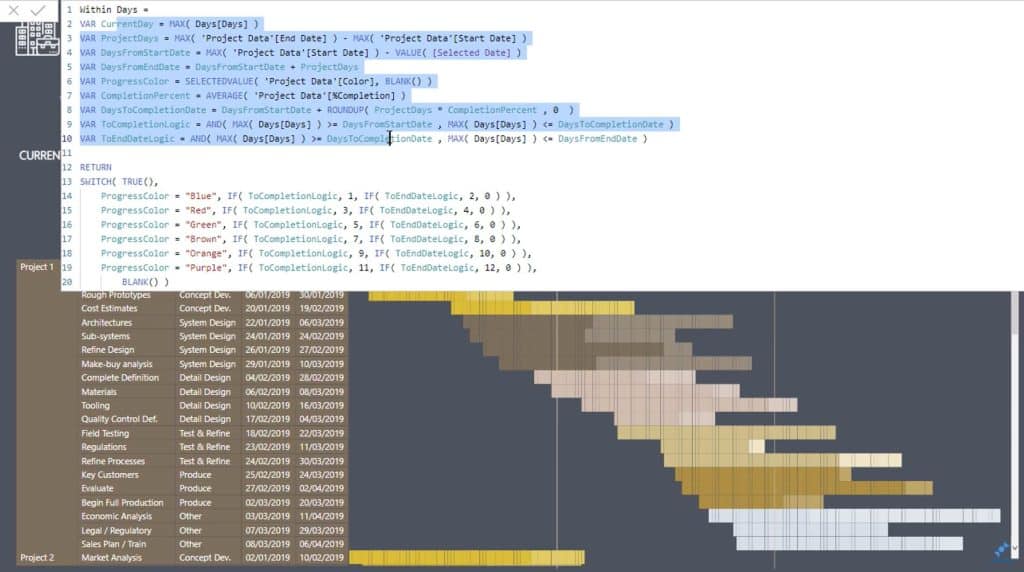
To showcase the importance of using variables in your DAX measures, I’ll be using this reasonably complex formula as an example. I used this for a recent member-only event for Enterprise DNA about project management.

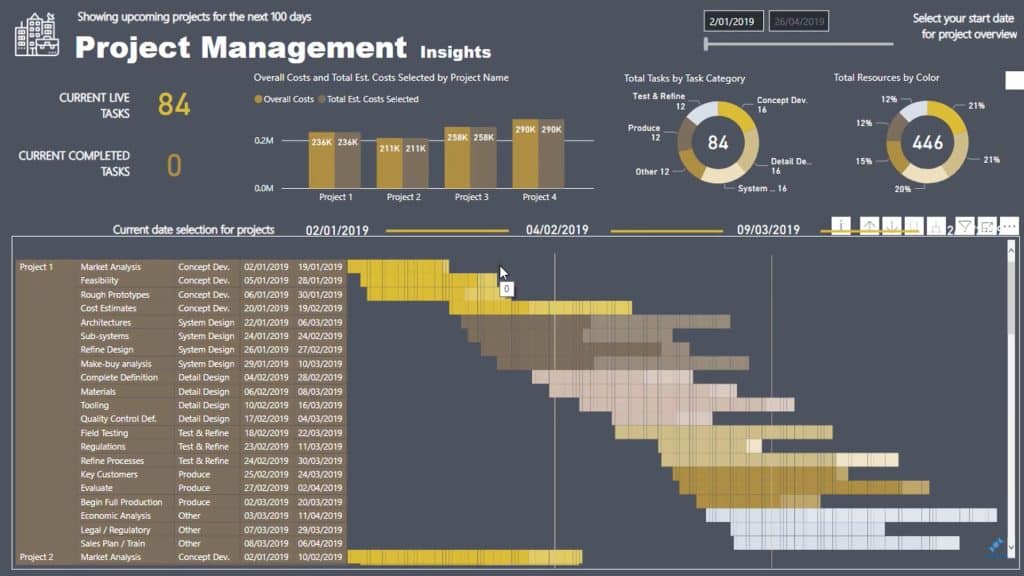
To visualize the data, I created this unique Gantt chart. You’ll see that there’s a lot of logic embedded in it, allowing me to color code the data showing information like when a project started, when it ended, and so on.
Let’s do a quick review of the data behind this chart.
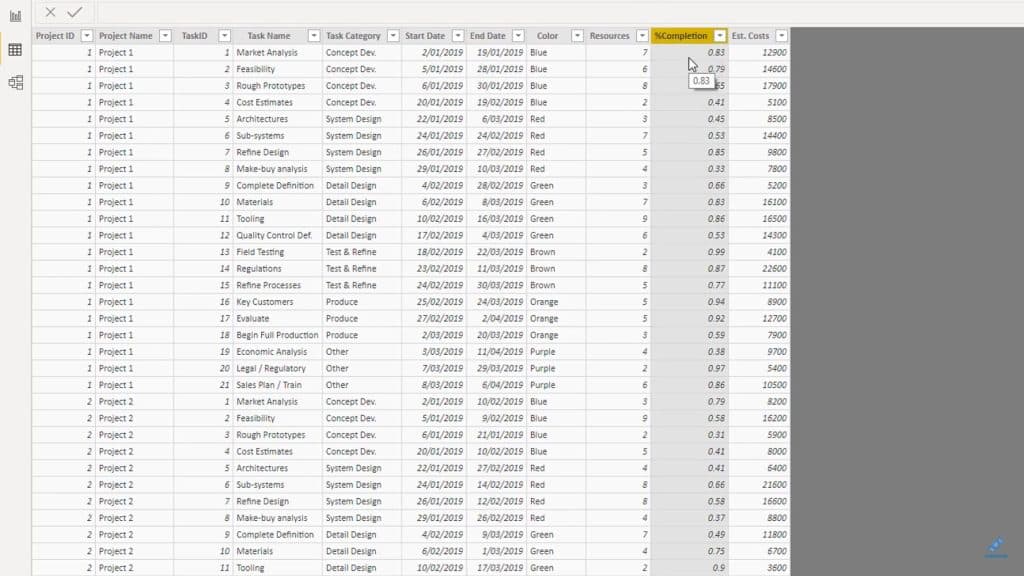
You’ll see that I have the start and end date for every single task in a particular project. What adds complexity to the formula is the fact that I also have a column for %Completion.
How do I visualize that completion rate in my chart? This is showcased by showing the Current Live Tasks itemized based on the different live tasks for each category.
I also had to use a number of different colors on my chart for different task categories in each different project, so I ended up using conditional formatting within my matrix to make all that happen.
Now, when I browse through the Enterprise DNA support forum, I would often see users applying highly complex formulas when dealing with data like this. The truth is, a lot of those should be broken down into variables.
Using Variables In Complex Formulas
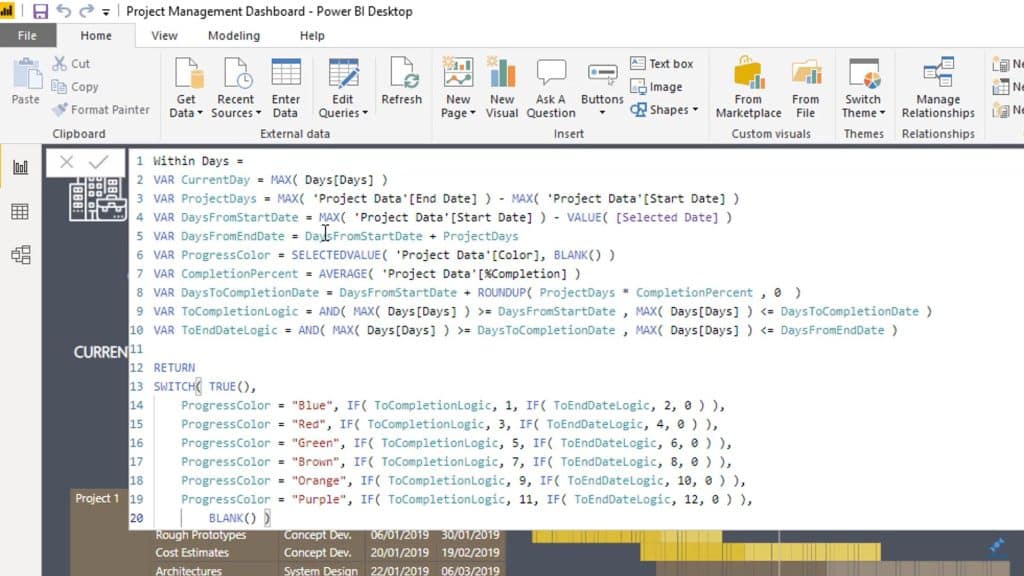
Regardless of what you are trying to calculate, I just want to show you the setup that you should aim for if you aren’t using variables that much. I want you to see why you need to use variables here and how I’ve used them to actually make this work.

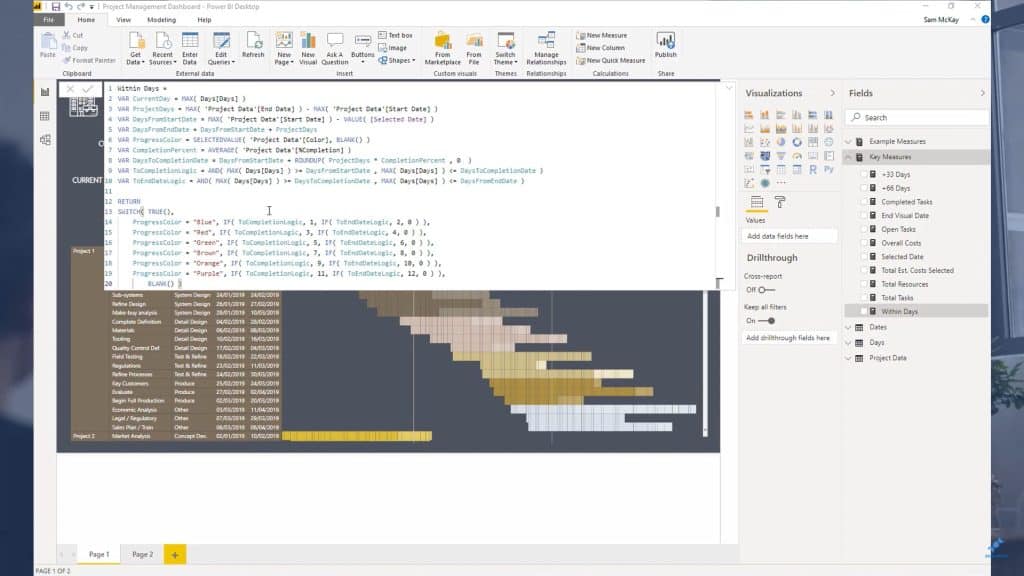
You can actually reference variables within variables. This means that you can build up a lot of your calculation before you enter anything under RETURN.
It’s important to remember that every result is calculated individually in Power BI. So you have to consider the context for each individual result as well.
So you’ll see that I used VAR for CurrentDay, ProjectDays, and DaysFromStartDate. I also took the DaysFromEndDate by referencing DaysFromStartDate and ProjectDays.
After that, I did further logic work on ProgressColor and CompletionPercent.
Another interesting thing about variables is that you can also embed some TRUE or FALSE logic. Normally, you’d see a long list of IF statements up here on the main formula. But this time, I chose to place that TRUE or FALSE logic inside the VAR by using ToCompletionLogic and MAX Days greater than or equal to MAX Days less than or equal to, and so on.
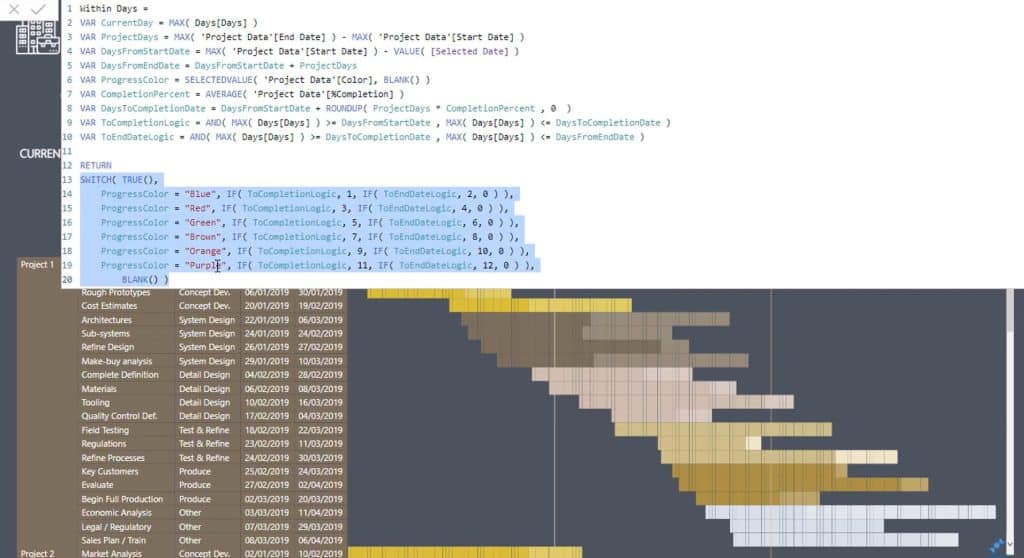
You’ll also see that I’ve entered my IF statements into my SWITCH formula here, which is a more efficient approach.
The IF statements are now easier to understand because the logic only needs to be written once into the variables instead of being references for every statement on this list.
Using Variables Vs Measure Branching
You may be wondering why I didn’t use measure branching in this case, knowing that I’ve also mentioned it quite a number of times before.
It’s because a lot of the logic used here is purely just for this specific calculation. It’s not reusable throughout the rest of my model.
So in this particular case, it’s better just to put it as a variable inside one formula where you actually use it, versus having it take up a lot of room inside of your measure groups.
Because it is local to just this calculation, I decided to place all of these things inside of variables and create a single formula that works it all out.
It’s important to note that I didn’t build this formula from scratch. I did originally have all these separated in different measures. That’s to make sure that I was calculating the correct results at each different context. From there, I cleaned it all up by building this one particular measure.
So in terms of the syntax, you have your variables on top then the RETURN function to enter your logic down here.
***** Related Links *****
Using Variables In Power BI – A Detailed Example
Scenario Analysis Techniques Using Multiple ‘What If’ Parameters
Getting Started With The “What If” Parameter In Power BI
Conclusion
Now that you see the application I used, hopefully, you understand why I prefer using variables in cases like these.

One thing that I would like to emphasize here is the importance of understanding each individual variable before creating a complex formula like the one I made.
I also see this a lot in our support forum. They go straight into the long measure and wonder why the results aren’t displaying correctly. You really have to understand how each individual result is calculated. Once you place them all in the single final measure, there’s no way to audit the individual results.
Once you have a good understanding of how that works, you can finally create more advanced formulas using variables without having more issues in the end.
All the best
Sam


