This tutorial will review how to use TOPN as a virtual ranking function to generate interesting insights based on ranking logic in Power BI. You may watch the full video of this tutorial at the bottom of this blog.

Using TOPN as a virtual ranking function allows you to dynamically produce the top and bottom results for any measure.
This example will show how to work out the locations that generate the highest and lowest revenue per customer.
Total Number Of Cities With Purchases
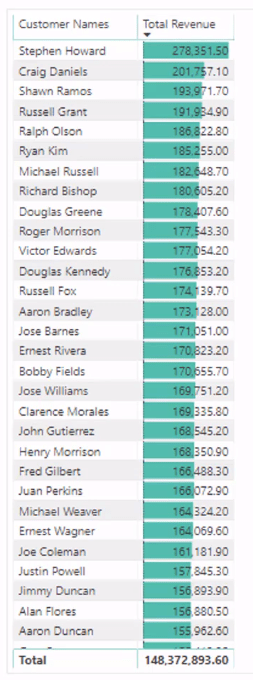
This table contains the Revenue for each customer.

You want to work out which locations have the highest and lowest Revenue.
Let’s say that a customer bought your products from a range of different locations.
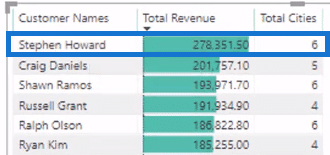
Using Stephen Howard as an example, you can see that he bought products from six different cities:

You now want to know how much revenue was generated for each city. Then, you want to virtually rank the cities and calculate which of them belong to the top and bottom two.
This formula counts the number of locations a customer has purchased from:

The COUNTROWS function works out each unique place where a product has been bought.
However, this formula can’t give you with the ranking results you need.
This is where the TOPN function comes in. It allows you to have a virtual ranking inside a formula.
Calculating The Top Two Cities
To calculate the top two cities with the highest revenue for each customer, you need to use this formula:

The CALCULATE function computes the Total Revenue using a different context for the top two cities.
Let’s now focus on the TOPN statement in the formula:

The first parameter for this TOPN statement is the total ranking that needs a virtual calculation. Thus, 2 is used to get the top two cities.
If it’s 4, it will return the top four cities.
You need to make sure that you’re only iterating through the places that a customer has purchased from. This is why Index is used rather than an element in the model.

Using Index ensures that you’re only counting the regions your customers have purchased from, and not all the regions in your model.

If you were to put the VALUES function along with the actual Name of the City, you’d get the overall Total Revenue from the top two cities — not from each individual customer.

The TOPN function creates a brand new context for each result in the table.
It’s creating a virtual table containing only the top two locations a customer has purchased from.
Calculating The Bottom Two Cities
This is the formula used to calculate the bottom two cities:

It’s exactly the same formula as the first, but you need to change DESC to ASC.
Here’s how to check if this formula is correct:
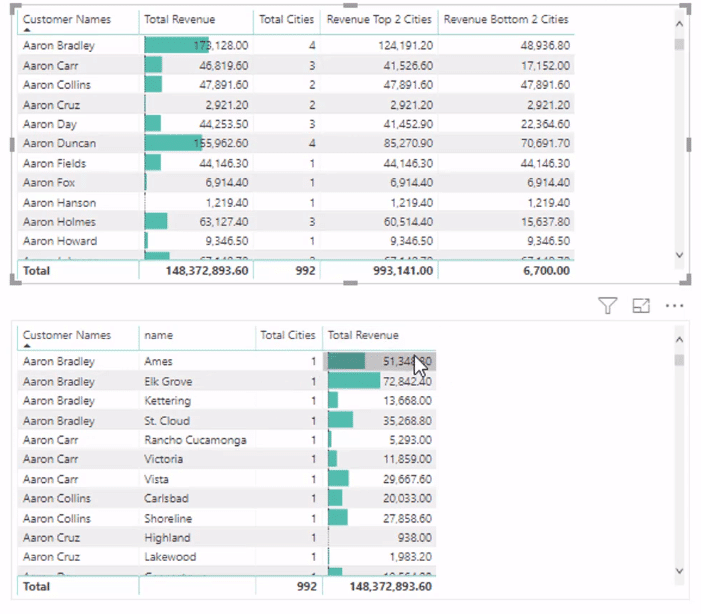
If you bring the cities with purchases to the table, you can see that the number of iterations matches the result of the Total Cities.

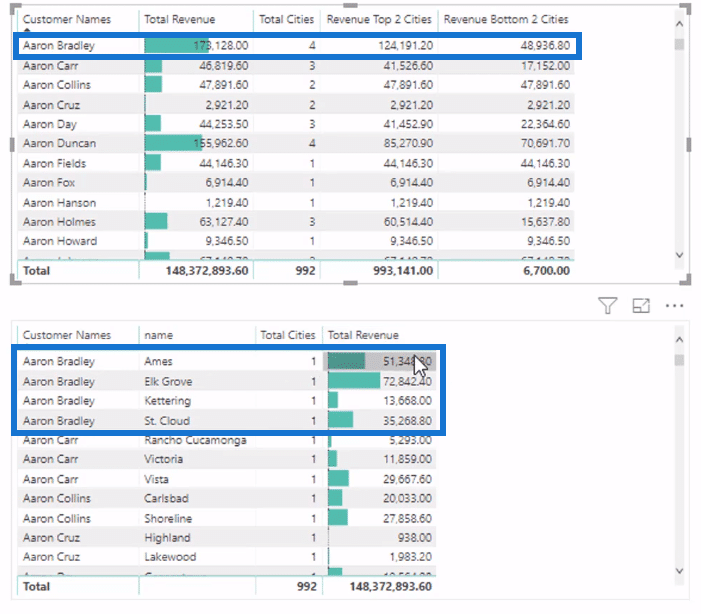
For example, Aaron Bradley bought from four different locations. So, there are four iterations showing in the second table.

You can see the four different purchase amounts the customer has for each location.
If you calculate and compare the figures of the two tables, you will see that they both match. All of Aaron Bradley’s amounts equal to 173,128.00, which is the Total Revenue. The top two cities have a Revenue of 124, 191.20, and the bottom two 48,936.80.
***** Related Links *****
Discover Unique Insights Using Power BI TOPN Function
Ranking Insights Using TOPN In Power BI
First Purchase Of Customer Insight Using DAX
Conclusion
This tutorial discussed how to use TOPN as a virtual ranking function to create effective ranking visuals in Power BI.
You can wrap the TOPN function in COUNTROWS, SUMX, or AVERAGE to create more valuable insights in your reports. It’s a very flexible and reusable tool to use.
All the best,
Sam
[youtube https://www.youtube.com/watch?v=xT6xPr5mLaE?rel=0&w=784&h=441]


