
In today’s dynamic and data-driven business landscape, organizations require robust tools such as Power BI to effectively analyze and visualize data.
Power BI is used for producing data visualizations and actionable insights from data. It is a BI (business intelligence) software developed by Microsoft, somewhat similar to Tableau.
Power BI provides a wide range of features that enable users to create interactive and visually appealing reports and dashboards from various data sources.

In this article, we provide a comprehensive introduction to the diverse applications and benefits of Power BI in modern business environments.
Whether you’re new to Power BI or seeking to expand your understanding, this article offers valuable insights into what Power BI is used for.
Let’s dive in.
Table of Contents
ToggleUnderstanding Power BI
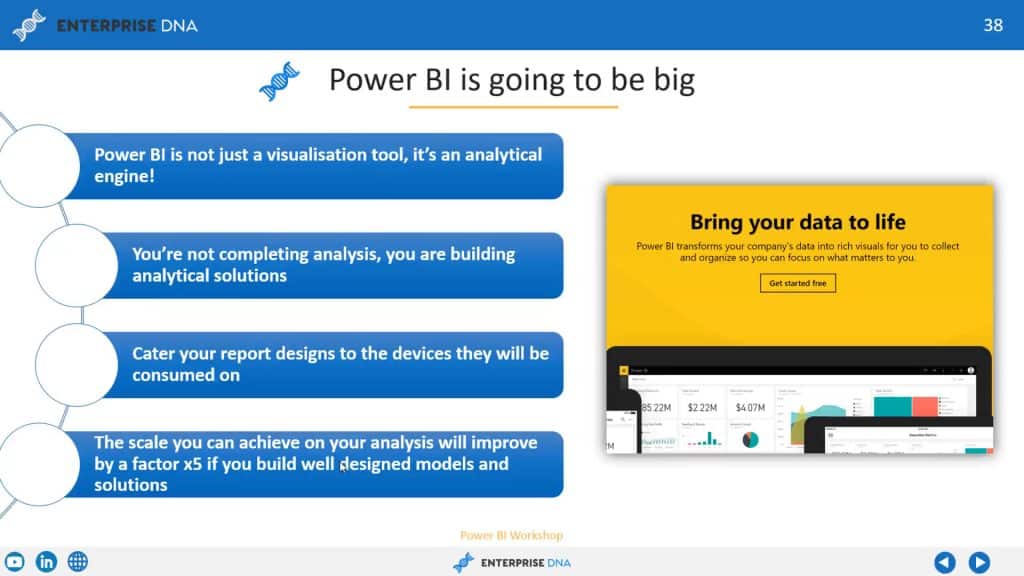
Power BI is a versatile, user-friendly platform for extracting insights from your data. It’s a unified and scalable way to create powerful business intelligence (BI) visualizations that help drive your organization’s decisions.
The platform offers a variety of tools and services, allowing users to connect and analyze data from various sources, whether it’s an Excel spreadsheet, a cloud-based system, or an on-premises data warehouse.
Key Features of Power BI
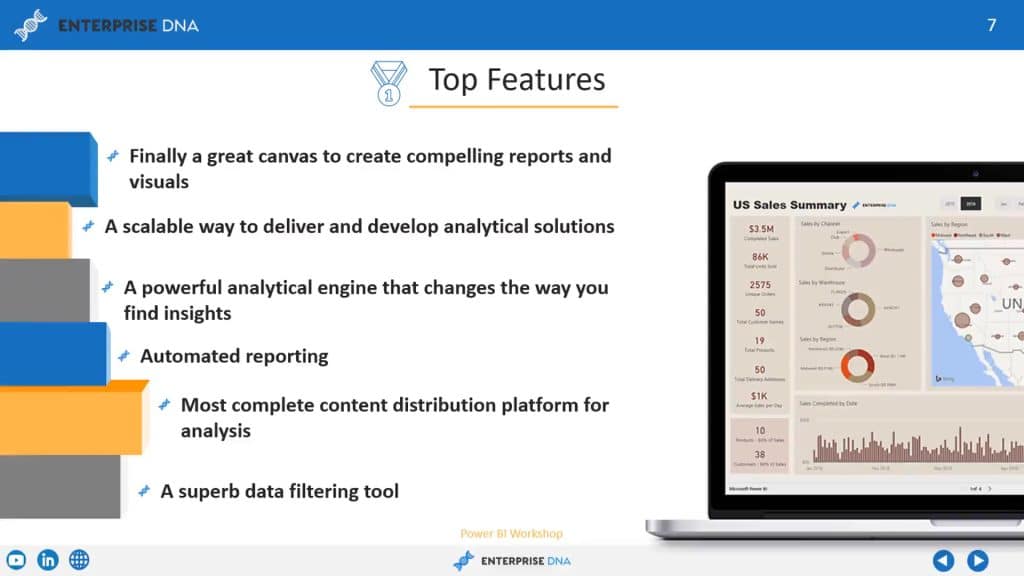
Microsoft Power BI has a variety of features that make it an attractive option for companies of all sizes looking for a comprehensive business intelligence tool. Some of its main features include:
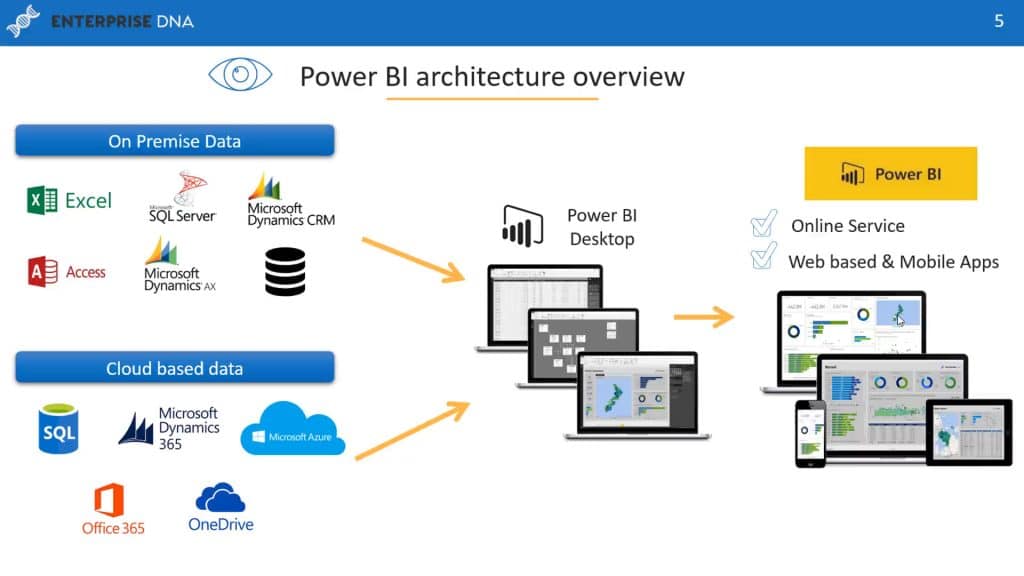
- Data connectivity: A core feature of Power BI is its ability to connect to a wide range of data sources, including Excel spreadsheets, databases, cloud-based sources, web APIs, and more. Users can easily create reports and dashboards that consolidate data from multiple sources for comprehensive analysis.
- Data modeling: Power BI provides data modeling capabilities that allow users to shape and transform their data. This includes data cleansing, data enrichment, data aggregation, and data modeling using a visual interface. Users can effortlessly create Power BI reports that analyze relationships between data tables, define measures, and calculated columns to derive insights from their data.
- Data visualization: Visualization is where Power BI shines. The platform features an incredibly rich set of data visualization options, including bar charts, line charts, pie charts, maps, gauges, and more. Users can customize the appearance of Power BI reports and apply filters and interact with the data to gain insights.
- Interactive dashboards: Pretty charts and graphs are nice, but Power BI can take it to another level with its interactive dashboards that provide a real-time view of their data. You can add multiple visualizations to a dashboard, create filters and slicers, and add drill-down functionality for in-depth analysis.
- Collaboration: Collaborating with your team and external partners has never been easier. Power BI provides collaboration features that allow users to share reports, dashboards, and datasets with other users within their organization or externally with clients or partners. You can also set up data alerts and notifications to keep track of changes in data.
- Natural language query: One of Power BI’s most powerful features is its natural language query ability called Q&A, which uses artificial intelligence (AI) and machine learning to respond to queries. You can use this feature to ask it questions about your data in plain English, and it’ll automatically generate insights. It’s a handy tool that makes it easy for non-technical users to analyze complex datasets.
- Mobile support: In addition to Power BI Desktop available on Windows, the platform is also available as Power BI Mobile, which allows users to access their reports and dashboards on Android and iOS mobile devices. You can easily view, interact with, and share reports and dashboards via Power BI mobile apps for on-the-go data analysis.
- Security: Data security is naturally a concern when handling raw data. Power BI provides robust security features to protect data, including data encryption, role-based access control, secure embedding in custom applications, and integration with Azure Active Directory for user authentication. It also supports a variety of data-level security options, allowing users to define row-level or column-level security based on user roles and permissions.
These are just some of the key features of Power BI that make it a powerful tool for business intelligence and data visualization.

To learn more about how to effectively use Power BI features, check out the video tutorial below:
Why Use Power BI? Here Are Some Notable Benefits
Now that we’ve gone over some of Microsft Power BI features, let’s talk about how using it can benefit your organization. The ability to properly analyze and visualize data is crucial for any modern company; potential benefits include:
- Faster decision-making: By using Power BI’s robust data analytics and visualization capabilities, businesses can quickly uncover valuable insights from their data. You can easily connect to a wide range of data sources, clean and transform data, and create interactive and dynamic reports and Power BI dashboards. These insights enable businesses to make data-driven decisions, identify opportunities, and address challenges effectively, leading to improved performance and competitive advantage.
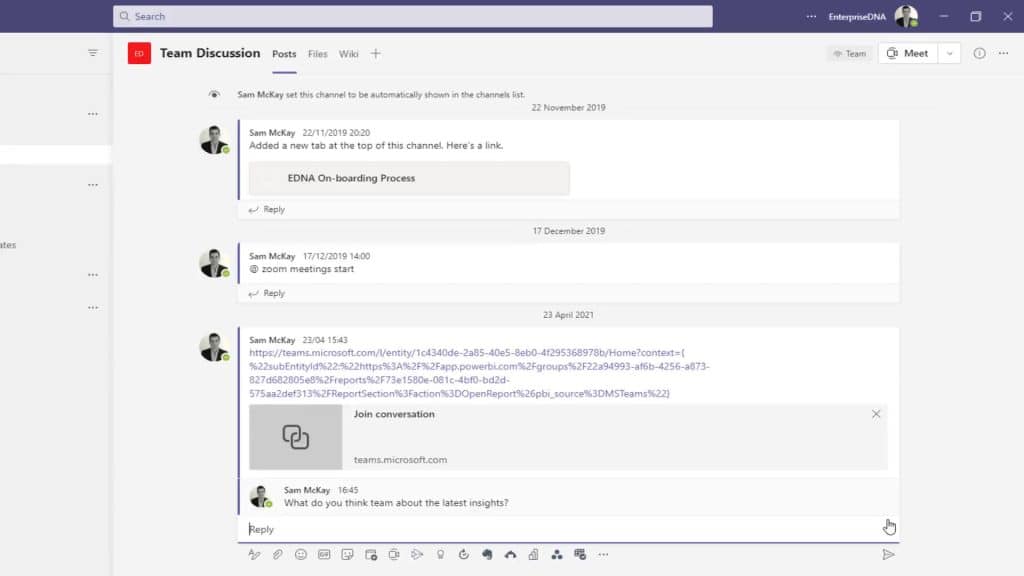
- Self-service analytics and collaboration: Power BI enables self-service analytics, allowing users across your organization to create their own reports and dashboards without relying on IT or data analysts. This reduces the burden on IT teams and accelerates the decision-making process. The platform also promotes collaboration by allowing users to seamlessly share reports and dashboards with colleagues, teams, or the entire organization. You can also collaborate in real-time, add comments, and share insights, which is a huge benefit if you’re trying to cultivate a data-driven culture within your organization.
- Scalability and accessibility: As your business grows, you’re going to collect increasingly larger volumes of data. Power BI is designed to scale to accommodate growing business requirements. The platform’s cloud-based capabilities will enable it to efficiently process large amounts of data while at the same time making it easy for you and your organization to access reports and dashboards from anywhere, anytime, through web browsers or mobile devices.
- Cost-effective thanks to flexible licensing: As a software as a service (SaaS) product, Power BI offers flexible pricing options, including free and paid versions that cater to different budgets. The free version, Power BI Desktop, provides powerful data analytics and visualization capabilities for individual users, while the paid versions, Power BI Pro and Power BI Premium, offer additional features such as collaboration, sharing, and scalability for team and enterprise-level requirements. This flexibility enables you to choose the licensing model that best suits your organization’s needs.
Power BI offers a lot of benefits for organizations thanks to its robust features and user-friendly interface, Harnessing the power of data to gain a competitive edge has never been easier.
In the next sections, we take an in-depth look at some of the Power BI platform’s core features, including data visualization and analysis, connectivity and integration, and collaboration and sharing.
Power BI for Data Visualization and Analysis
Data is at the heart of decision-making, and the ability to effectively analyze and visualize data is crucial for businesses to stay competitive.
Data visualization and analysis are arguably Power BI’s strongest features. The platform is excellent for creating dynamic and interactive dashboards and interpreting insights from data.
In this section, we explore how Power BI can be utilized for visualization and analysis, focusing on two key aspects: creating compelling dashboards and interpreting insights.
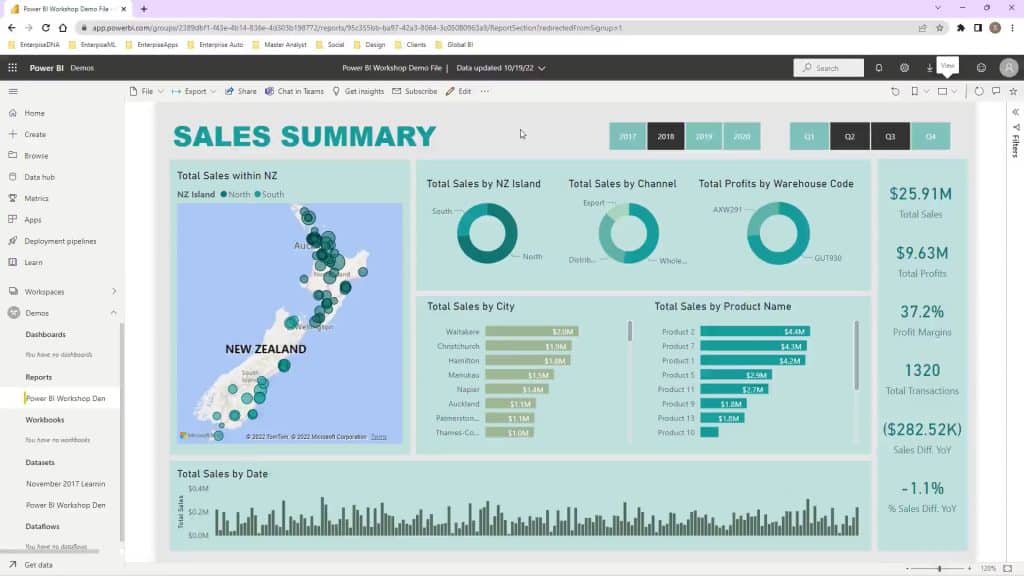
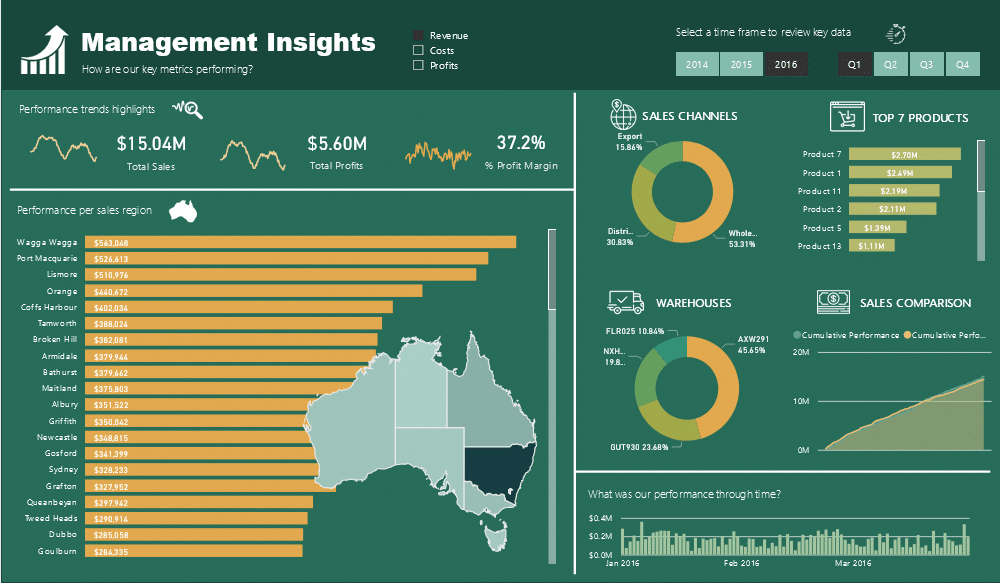
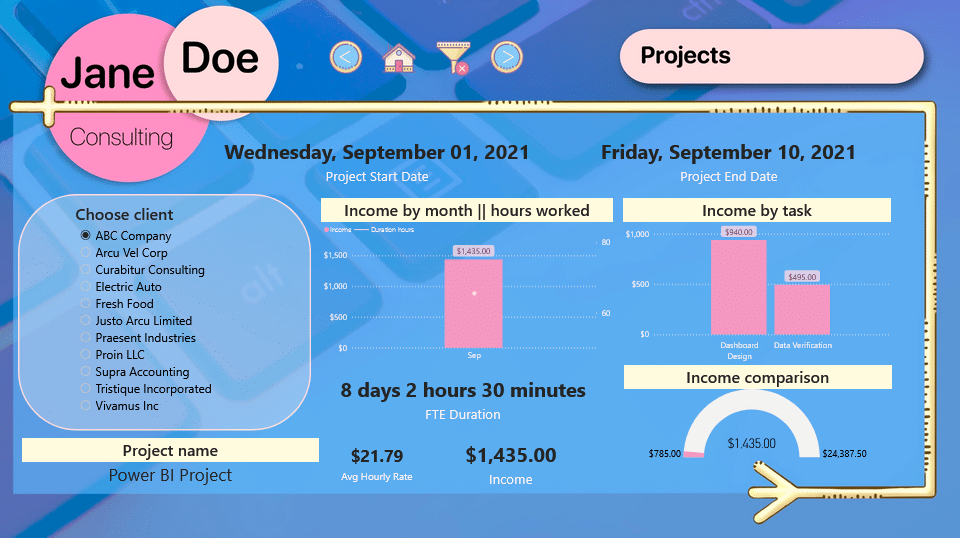
Creating Dashboards
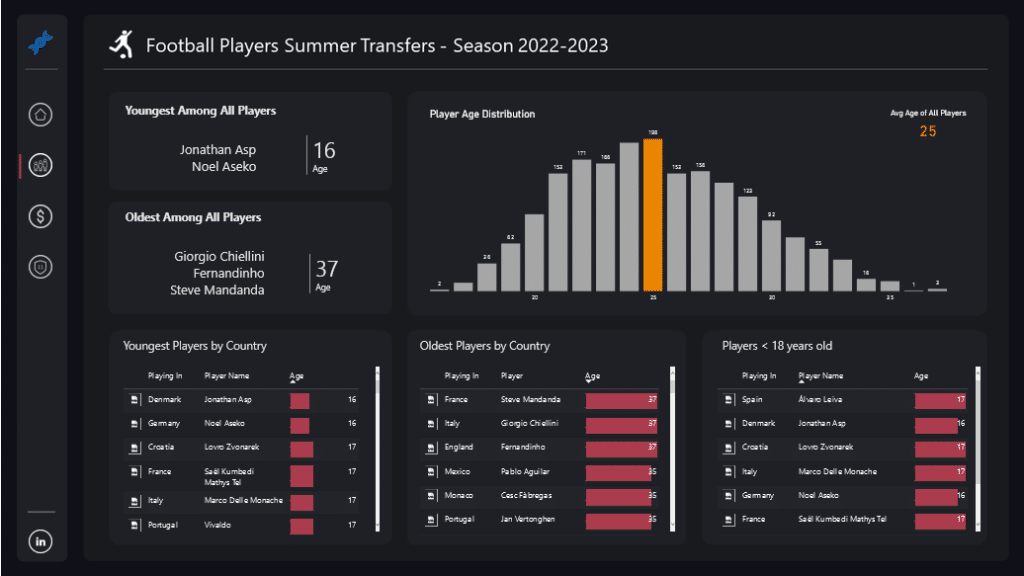
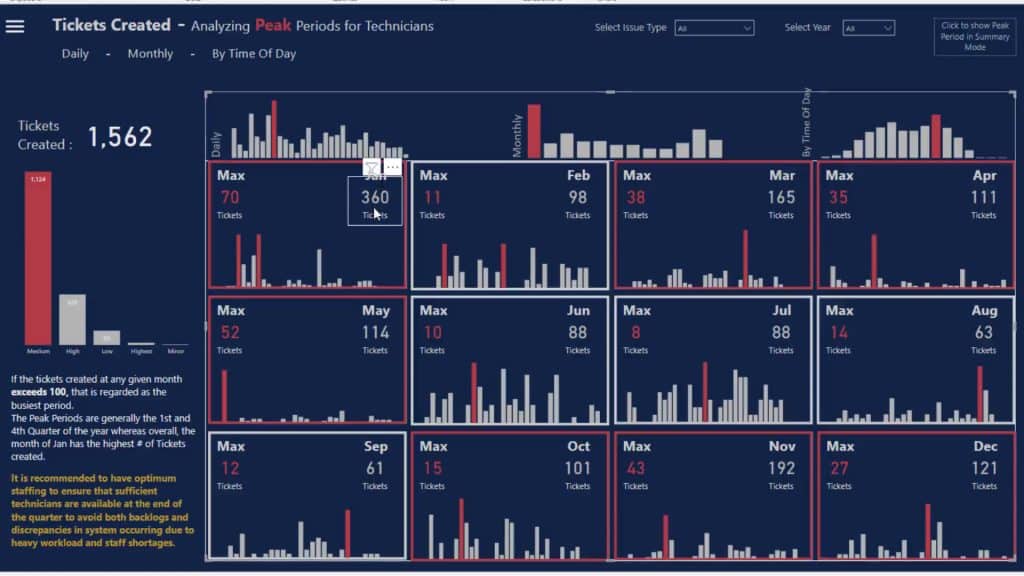
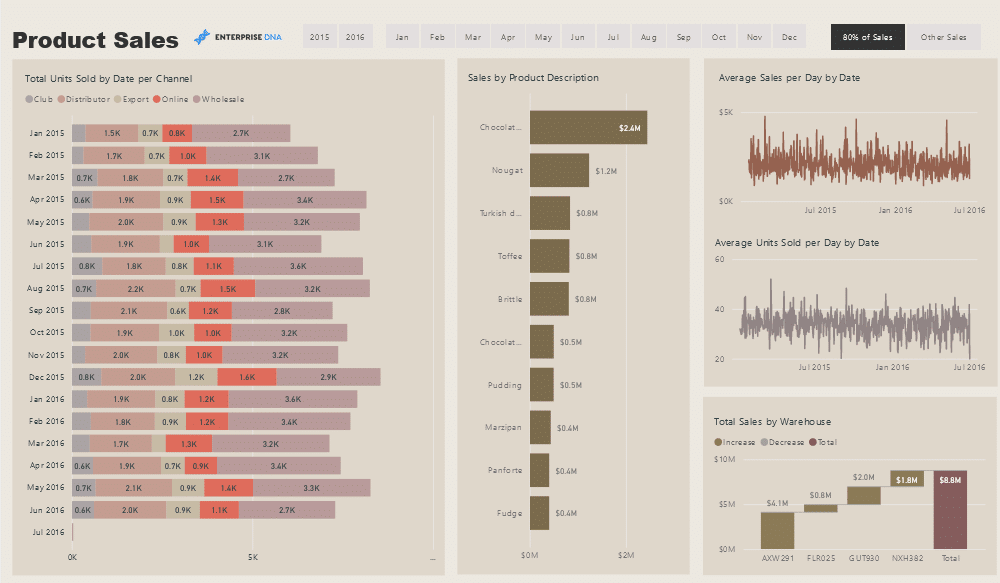
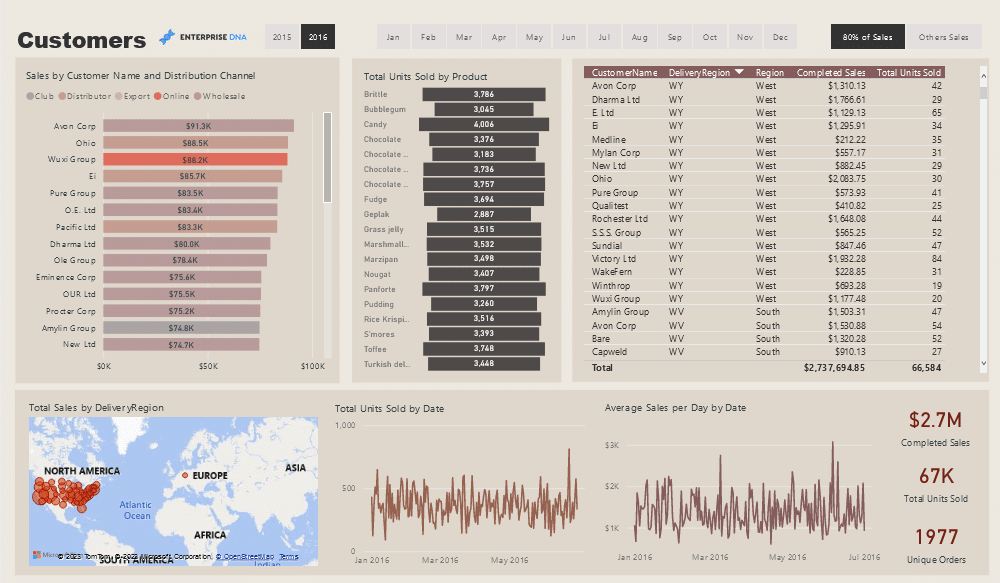
One useful visualization feature of Power BI is the ability to create interactive and visually appealing dashboards. These dashboards can be designed and customized with a variety of charts, graphs, maps, and more through a drag-and-drop interface.
Users can also create multiple layers within a dashboard for interactive visualizations, allowing for the simple categorization of complex data. Dashboards can easily be shared with colleagues for collaboration and discussions.
Interpreting Insights
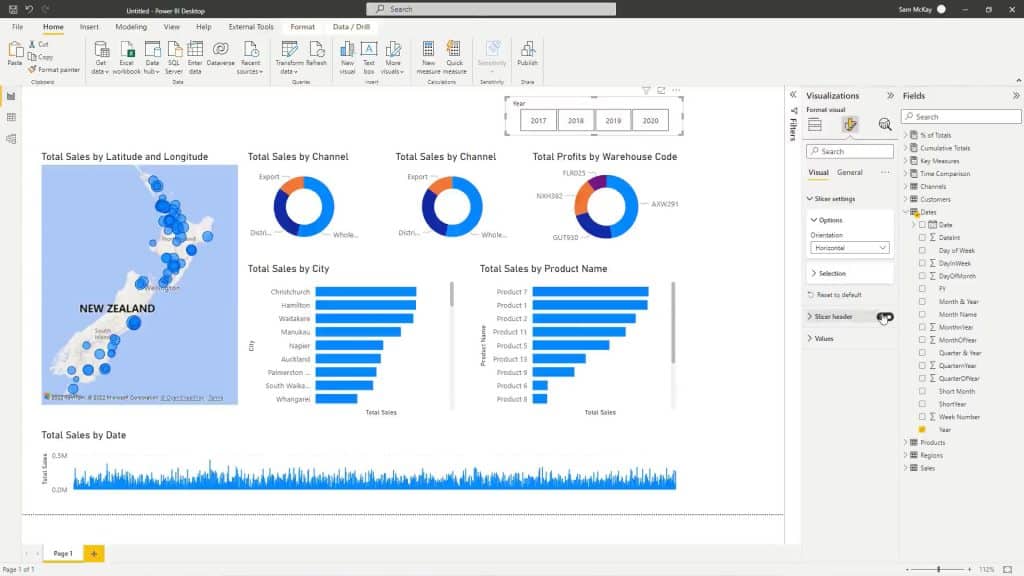
After importing data into Power BI, you can perform a variety of data analysis tasks, such as data filtering, sorting, aggregation, and calculations. The platform has powerful data modeling capabilities that can enable you to create relationships between different data sources, merge data from multiple sources, and create calculated measures and columns.
Power BI also includes advanced data visualization tools such as conditional formatting, trend lines, forecasting, and custom expressions so you can analyze data in a more sophisticated and informative manner.
Depending on what version of Power BI you’re using, you can create interactive reports that provide insights into key performance indicators (KPIs), trends, patterns, and anomalies, helping you quickly identify opportunities and detect issues.
Furthermore, thanks to Power BI’s Q&A feature, you can ask the platform’s built-in AI direct queries and get instant responses in the form of custom visualizations and insights. The Q&A feature makes it easy for Power BI users of all technical skill levels to interpret complex data and gain actionable insights.
What about integration?
Data Connectivity and Integration Using Power BI
Power BI’s data connectivity and integration capabilities are fundamental to its power as a data analysis and visualization tool. The platform supports an extensive list of data sources and also has the ability to connect to real-time data sources.

In this section, we explore two key features of Power BI’s data connectivity and integration: supported data sources and real-time data connectivity.
1. Supported Data Sources
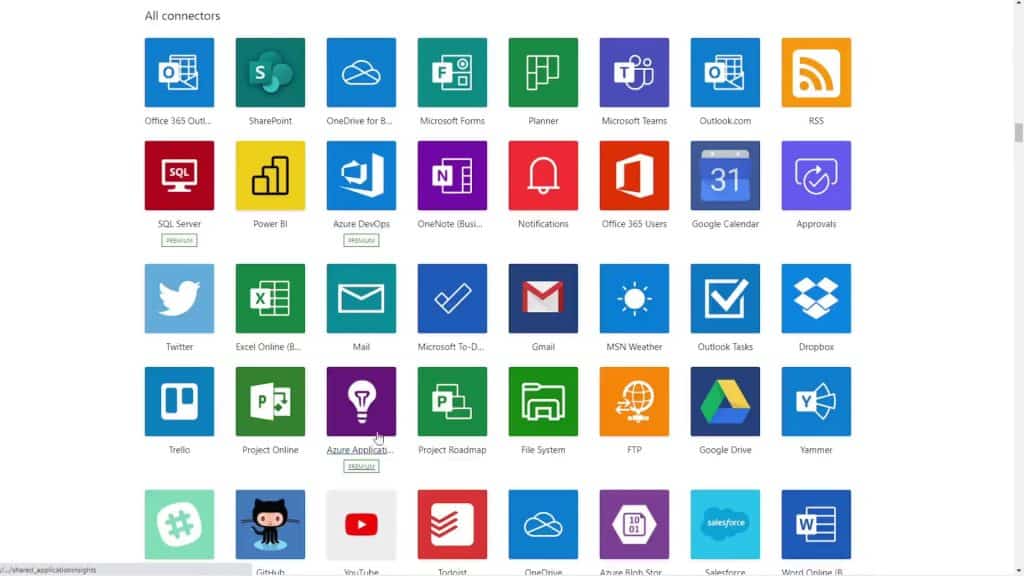
The Power BI tool offers an impressive range of data connectors, making it easy to connect to various applications, websites, databases, and online services.
The platform supports an extensive range of data sources, including popular databases such as Microsoft SQL Server, Oracle, MySQL, and PostgreSQL, cloud-based platforms like Salesforce, Azure SQL Database, Azure Blob Storage, and Azure Cosmos DB, as well as data from Excel, Power Query, Power Pivot, Power View, Power Map, CSV, XML, JSON, and more.
Additionally, as a Microsoft product, Power BI can seamlessly integrate with other popular Microsoft products, such as Excel, Azure services, and Dynamics 365. With no coding experience necessary, you can leverage existing data assets and create comprehensive visualizations and reports.
2. Real-Time Data
Power BI can also connect to real-time data sources, so you can monitor and analyze data in real-time.
This is a really useful feature, particularly for organizations that need to track and respond to rapidly changing data, such as stock prices, social media trends, or Internet of Things (IoT) sensor data.
The platform supports real-time data from numerous sources, including:
- Azure Stream Analytics
- Azure IoT Hub
- Azure Event Hubs
- Azure Analysis Services
- SQL Server Analysis Services
- Power BI Dataflows
- Power Apps
- Dynamics 365
- Google Analytics
- Salesforce
- SharePoint
- Microsoft Excel
- REST APIs
- OData feeds
So, what about collaborating and sharing?
How to Use Power BI for Collaboration and Sharing
Effective collaboration is essential if your organization is to maximize the value of its data analysis and visualization efforts.
Power BI has some great collaboration features that enable teams to work together seamlessly on data analysis and visualization projects.
In this section, we explore two key collaboration features of Power BI — Power BI Workspaces and Report Publishing — that help to promote teamwork and facilitate sharing of insights.
1. Power BI Workspaces
Power BI Workspaces are collaborative spaces where teams can work together and collaborate on creating, sharing, and managing Power BI content.
They function as a centralized hub for data analysts, business users, and other stakeholders to collaborate on data models, reports, and dashboards.
By using Workspaces, you can manage projects handled by different teams, grant access permissions to specific team members, and enable collaboration on shared datasets and apps like SharePoint in real-time.
2. Report Publishing
In addition to collaboration, you can use Power BI to publish reports and securely share them with people within or outside your organization.
Since the Power BI Service is a cloud-based platform, it’s very easy to share reports and dashboards with authorized users. You can embed reports from the Power BI report server directly into your organization’s website, share reports with specific external users or organizations, and set up scheduled report refreshes.
People you share reports with can view and interact with the content and receive timely updates when you make updates or changes to the data.
These collaboration and report publishing capabilities can help to streamline communication, enable teams within your organization to work together more effectively and facilitate real-time collaboration, which is particularly in industries that need to make time-sensitive decisions.
In the next section, we take a look at some industry use cases for the Power BI platform.
Real-Wolrld Use Cases for Power BI
Power BI has gained adoption in a variety of industries because of its advanced visualization and analysis capabilities. Here are some prominent industry use cases:

- Retail: Power BI can help retailers analyze business data to optimize inventory management, predict shopping patterns, and create personalized marketing campaigns. By tracking sales data, retailers can identify trends and address customer demands more effectively.
- Healthcare: In the healthcare sector, Power BI is employed to process and visualize patient data, helping professionals monitor and track patient health, optimize hospital operations, and make informed decisions regarding treatment plans.
- Finance: Financial institutions can leverage Power BI to monitor and analyze their financial performance, manage risks, and ensure regulatory compliance. By visualizing complex financial data, companies can quickly understand their financial health.
- Manufacturing: Power BI is used in the manufacturing industry to analyze production data, optimize supply chain management, and monitor equipment performance. This enables manufacturers to improve efficiency while reducing costs and ensuring product quality.
- Education: Power BI can help educational institutions to identify trends in student performance, optimize course offerings, and allocate resources based on data-driven insights.
These are just a few examples demonstrating how Power BI plays a crucial role in various industries by providing a comprehensive and accessible platform for handling big data.
The Bottom Line
Power BI is a versatile and powerful business intelligence platform that caters to all data visualization needs. It facilitates the creation of visually appealing and interactive reports, offering insights into various data sources, be it an Excel spreadsheet, DAX, or cloud-based or on-premises data warehouses.
The platform’s primary focus is to make data more accessible and understandable for business analytics and data science. Its user-friendly dashboard allows for the creation of a range of visualization styles, such as graphs, maps, and charts.
Power BI visuals have become for data-driven decision-making in the business world. With its robust security features and seamless integration with other Microsoft products, the platform is becoming the go-to solution for businesses of all sizes looking to drive data-centric decision-making.
If you’re looking to unleash the full power of your data, consider leveraging the capabilities of Power BI and take your data analysis and visualization to the next level!
Ready to start learning? Check out our Free Power BI Course and start your data journey!


