In this tutorial, you’ll learn how to visualize the filter context in Power BI DAX Studio. Specifically, you’ll learn how to enable tooltips that show the active filter context of any cell in a table or matrix.
A filter context reflects any active filter on a currently selected cell in Power BI.
When you right-click on any table in your data model, you can see two options: Define Filter Dump Measure and Define Filter Dump Measure (All tables).
These two options allow you to understand the filter context of a given visual at particular points in time.
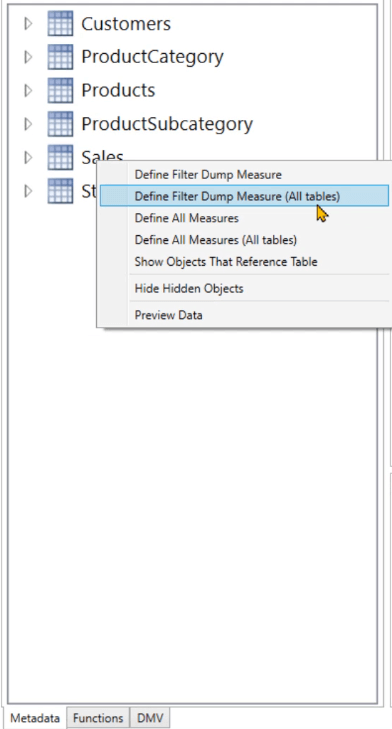
The difference between the first and second option is the scope of the filter context visualization. If you choose the first option, you’ll only see the filter context of the selected table. Whereas, the second option allows you to view the filter context of all the tables in your data model.
Enable Filter Context In Power BI DAX Studio
When you click on the second option, DAX Studio declares a DAX code that contains the DEFINE and MEASURE keywords. This code also has multiple IF statements that are concatenated with an ampersand (&).
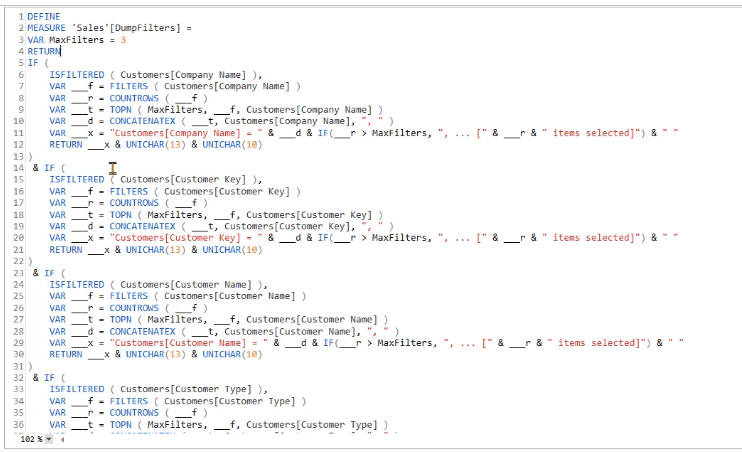
In this case, there are a total 652 lines of code. The length of the code depends on the number of columns in your data model.
Copy the code and paste it as a new measure in Power BI. Remove the DEFINE and MEASURE keywords since they’re not available in the Power BI software.

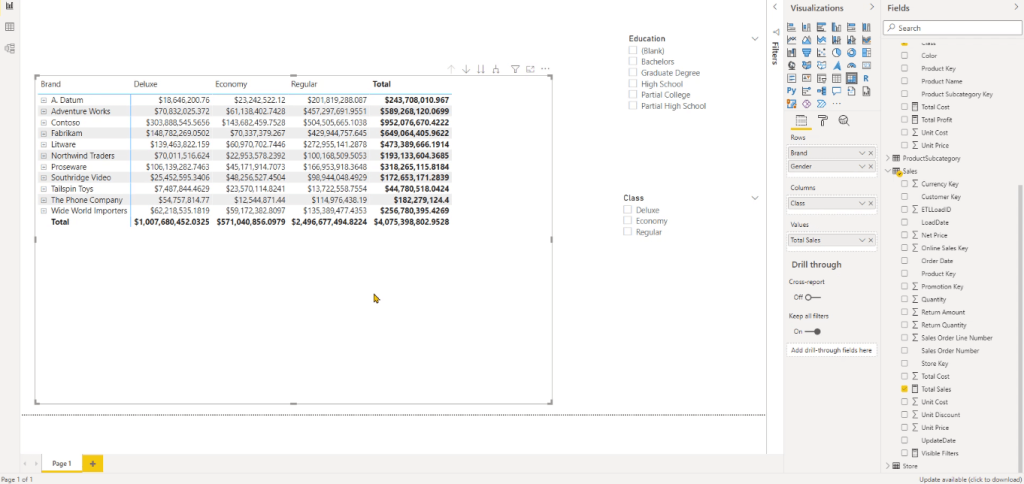
Create a report. Drag and drop Fields from your data model to your report page. In this case, the Brand, Class, and Total Sales are placed in a matrix. Meanwhile, the Education and Class fields are used as slicers.
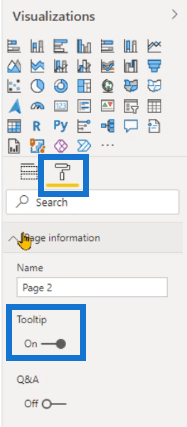
Next, create another page. In the Visualizations pane, go to the Format option and turn on the Tooltip under Page Information.
The Page Size Type should also be changed to Tooltip.
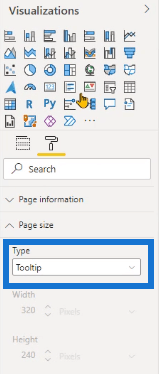
Create A Tooltip For The Filter Context
Create a Card and place the new measure in it.
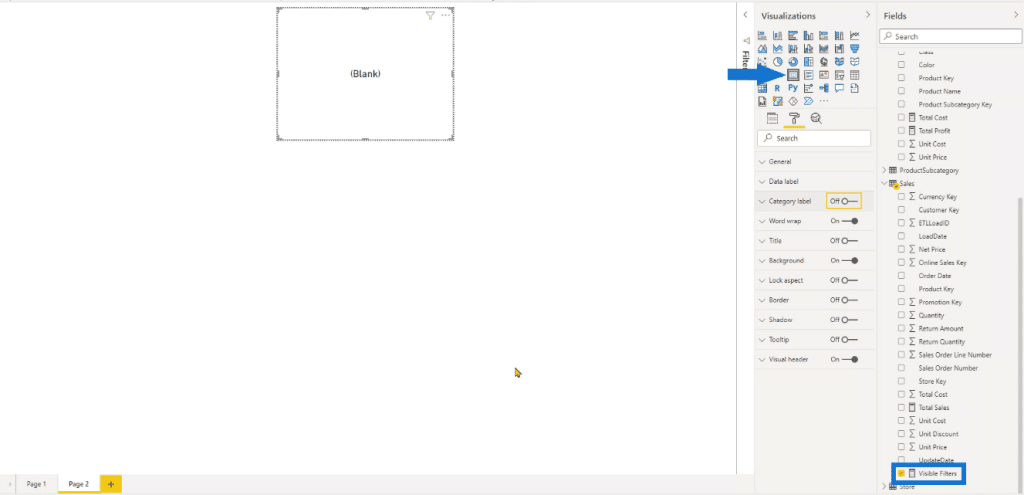
Go back to the first page. Select the matrix and click the Format option. Turn on the Tooltip and change the Page to Tooltip.
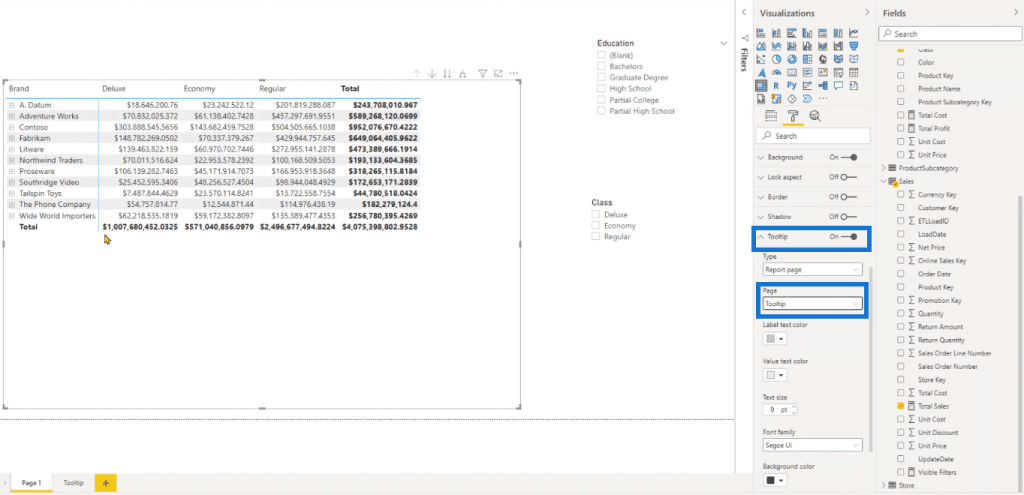
When you hover over a cell in your matrix, you’ll now see a tooltip that shows the filter context.
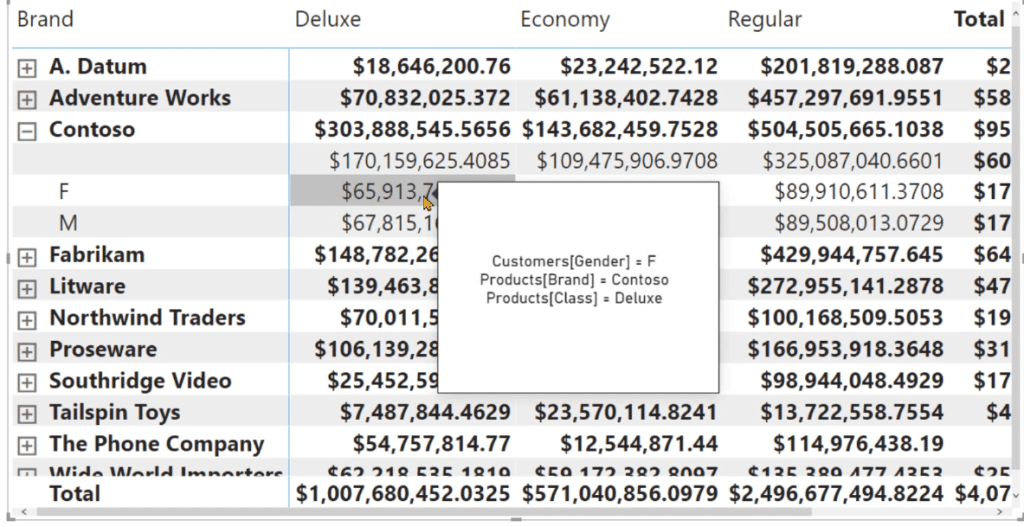
You can also use the slicer to introduce more filters to the matrix.
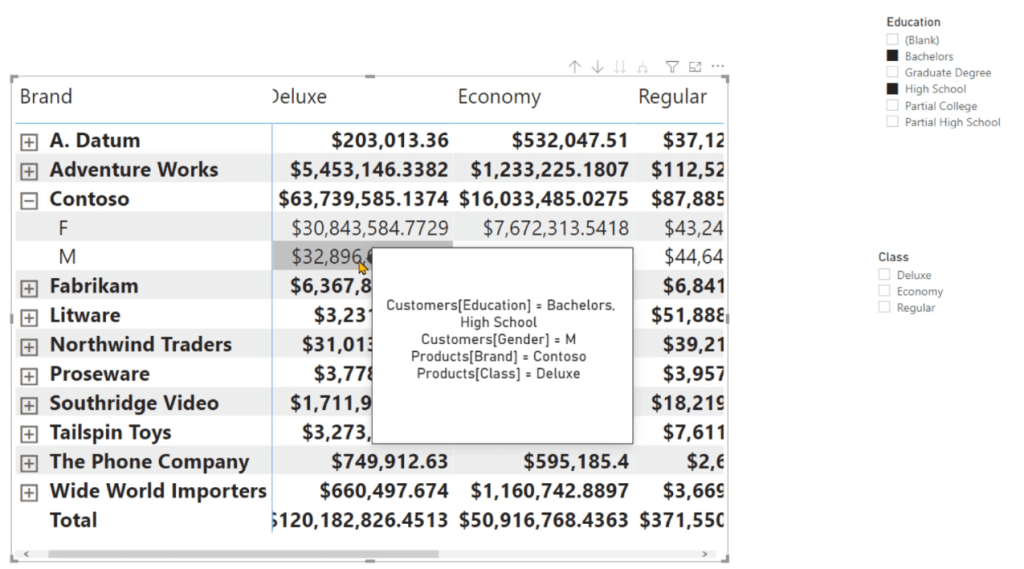
Being able to visualize the filter context of each cell in your table or matrix is a great feature to enable for beginners. This helps to better understand what active filters are affecting your data. It’s also a good way to double-check your results.
***** Related Links *****
The DAX Studio MEASURE Keyword: An Overview
Power BI Filtering Techniques For Tables
Metadata Filtering In SharePoint Files
Conclusion
This tutorial showed a quick demonstration of how you can use the Filter Dump technique in DAX Studio to create a tooltip. This tooltip allows you to view the filter context of each cell in a visualization.
The filter context plays an important role in Power BI and DAX Studio reports. So its important to understand what it is and how you can view it as a means to double-check your work.
Enterprise DNA Experts


