In this tutorial, I’ll discuss how the VALUES Function (DAX) allows you to create useful automation when working on a model with multiple date measures. You can watch the full video of this tutorial at the bottom of this blog.
The VALUES function (DAX) returns a one-column table that contains the distinct values from the specified table or column. In other words, duplicate values are removed and only unique values are returned. You can also check the Microsoft documentation for this function here.
Sample Scenario Using VALUES Function (DAX)
Here’s an example on how to use the VALUES function.
Let’s use a fact table called Jobs which has around 15-16 Date tables.

Having a lot of Date tables can make it challenging to create measures, especially if you need to include or do a date range.
As you can see, there’s a Received, Estimate Approved, and Started date in this table.
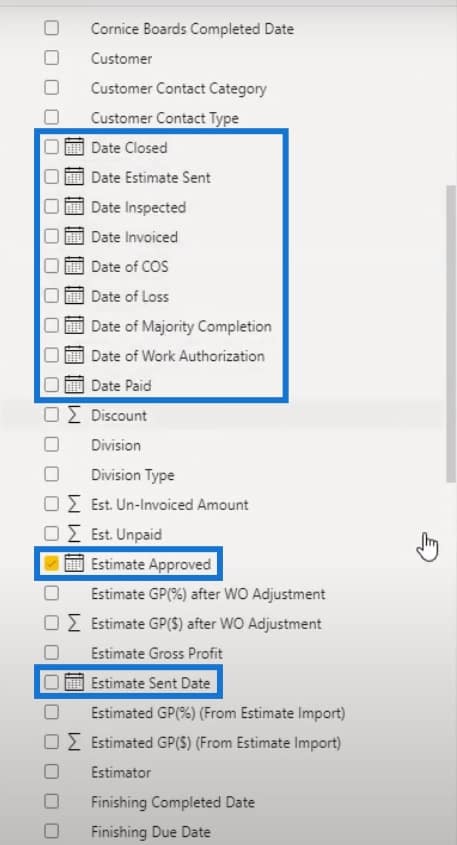
By setting up the proper measures, I can identify the number of jobs with date in the Received, Estimated Approved, and Started date columns within a given date range.

Let’s check out how I came up with these measures.
Measures Using VALUES Function (DAX)
I created two measures for this certain scenario. The first one is to count the number of jobs that had all three of these dates (Received, Estimated Approved, and Started date) within a date range.
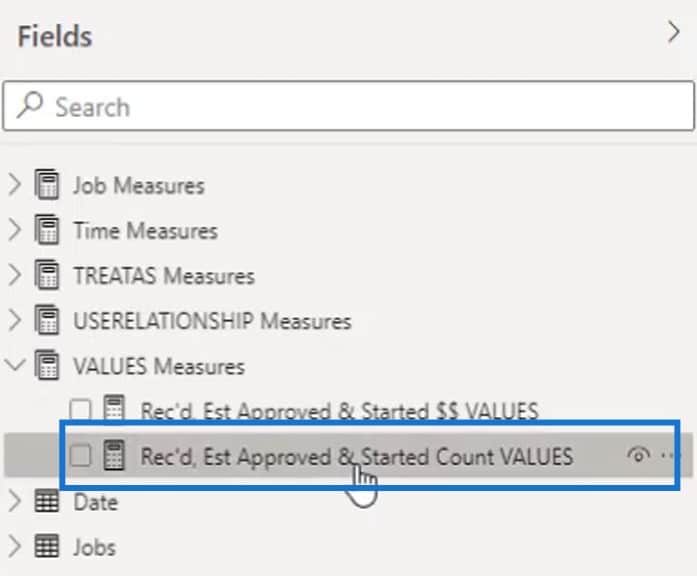
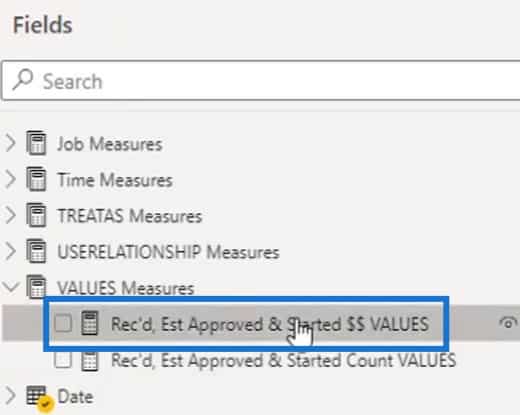
Then, the second measure is for calculating the Total Estimates.
1. Job Count Measure
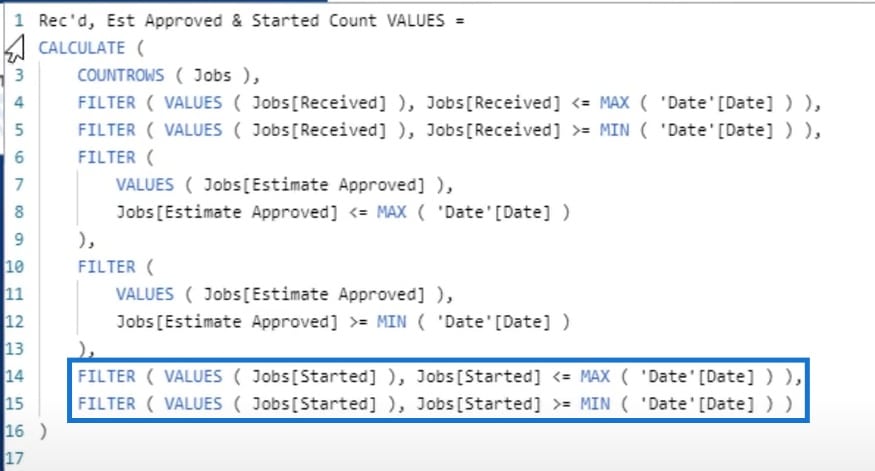
I used the CALCULATE DAX function to do the calculation. Inside this function, I used the COUNTROWS function to count the rows of the Jobs table.
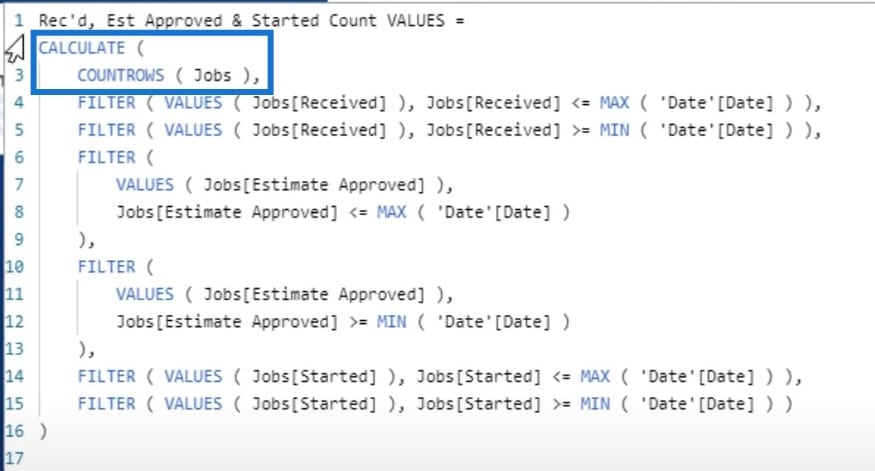
Then, I wanted to filter the result by the values of the Received date.
This will count the jobs which had a Received date that was less than or equal to the MAX date of the given date range.
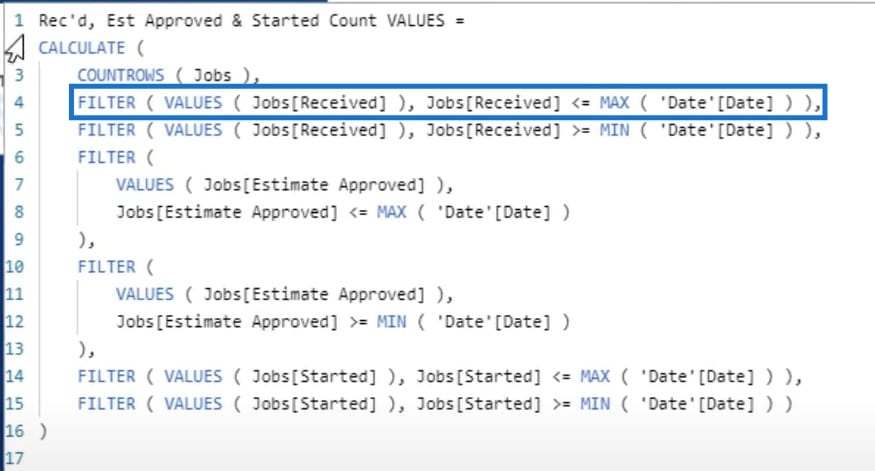
This will also count the jobs which had a Received date that was greater than or equal to the MIN date of the given date range.
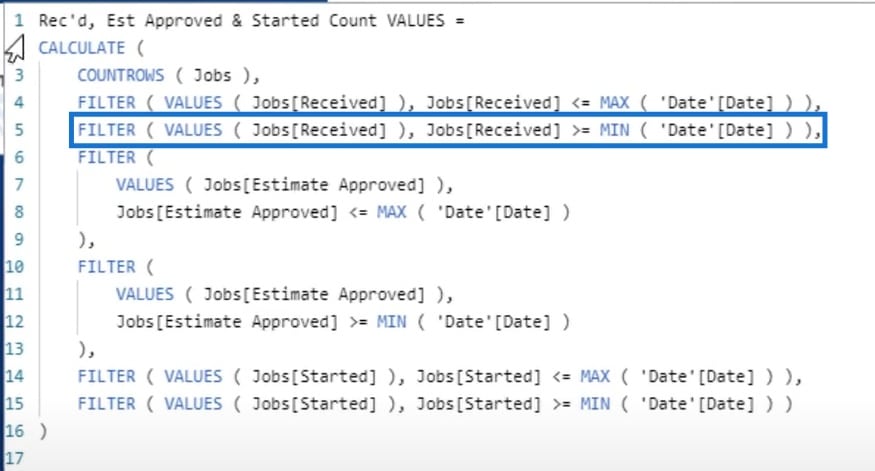
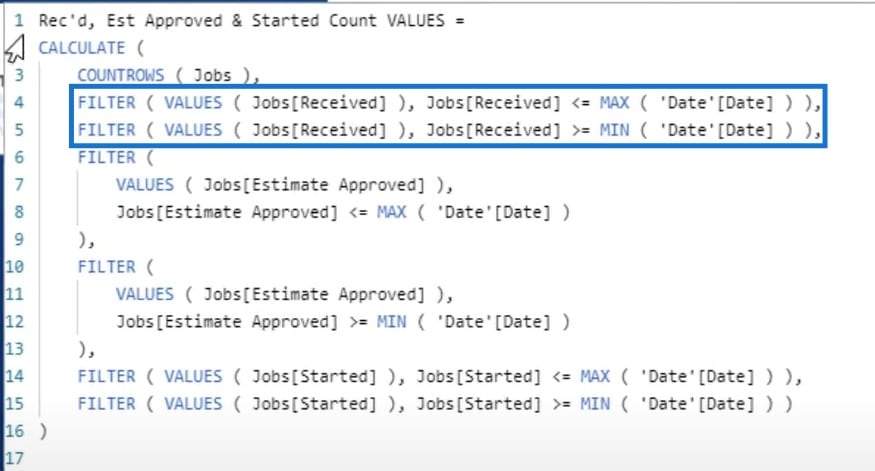
Generally, these 2 rows of DAX formula count the jobs that have a Received date within the given date range that was selected on the page.
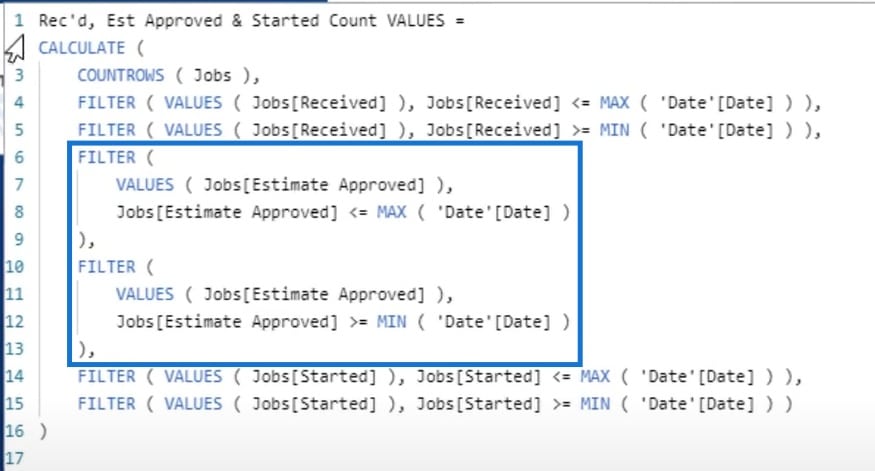
The other rows do the same thing. As you can see, I used the same kind of code here. This is simply counting the jobs that have an Estimated Approved date within the given date range.
Similarly, this part is also for counting the jobs but only those with a Started date in the given date range.
As a result, the Job Count measure calculated all the jobs that met the criteria within the formula. In this example, the date range is from January 1, 2020 to December 31, 2020.
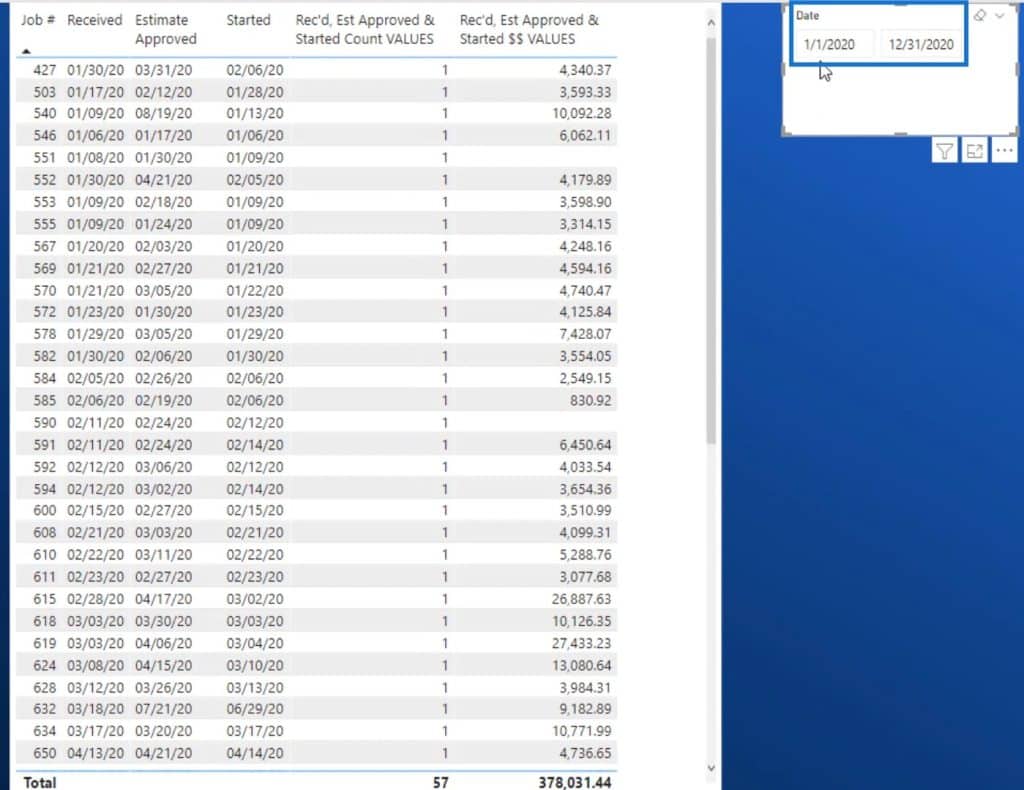
Overall, there were 57 jobs that met all the given criteria from the measure.

After that, I had to do a technique called Measure Branching.
2. Total Estimates Measure
Basically, I just need to copy and paste the previous formula that I’ve used for the Job Count measure to create the measure for the Total Estimates.
As you can see, this looks very similar to the Job Count measure. The only difference is that I used the SUM function to calculate Total Estimates.
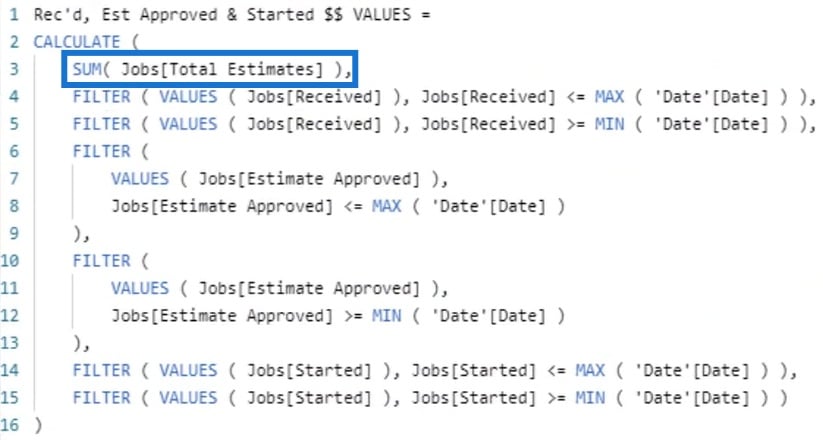
Instead of just counting the number of jobs, it will also sum up the total amount of Estimates for each one of those jobs that have a Received, Estimate Approved, and Started date within the given date range.
This will then display a total of 57 jobs and 378,000 total estimates.

Testing The Results
Lastly, I should test this out to see if this is displaying the correct results.
I created a page called the TESTING page.
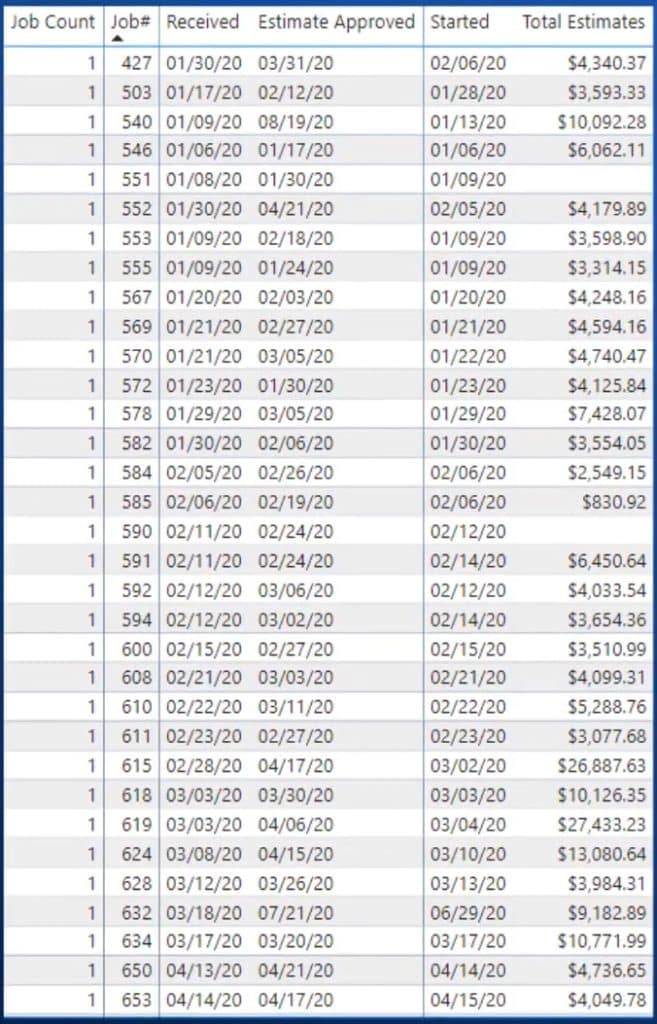
In this table, I included the Estimated Approved date, Received date, Started date, and Total Estimates from my fact table called Jobs.
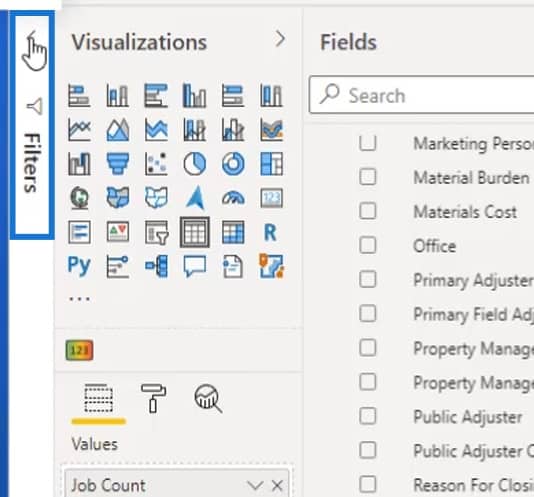
Then, I’ll open up the Filters pane to show you what I did to validate this information.
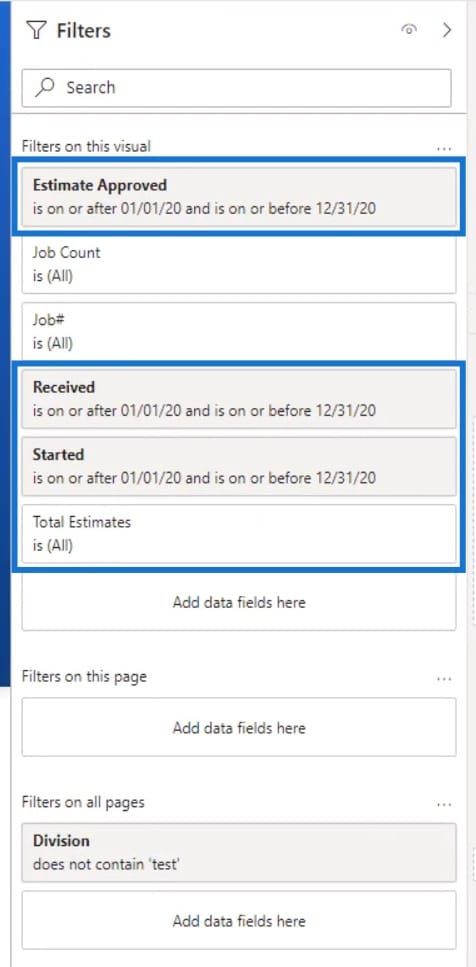
First, I filtered the date field of the Estimate Approved date, Received date, and Started date from January 1, 2020, to December 31, 2020. Then, the Total Estimates field was set to All, which is an automatic function here.
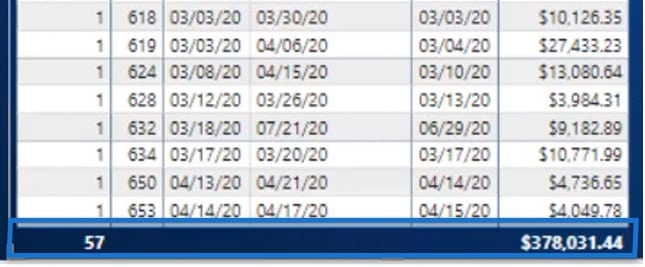
That will be summed up at the end of the page. As you can see, there’s a total of 57 jobs and 378,031 Total Estimates, which matches the results that I had when creating the Total Estimates measure.
***** Related Links *****
Using Table Functions In Power BI
Manage Multiple Date Calculations In Your Fact Table – Advanced Power BI Technique
How To Work With Multiple Dates In Power BI
Conclusion
I hope this tutorial makes it clear for those who encounter the same issue when working with multiple dates in one fact table. This definitely includes some interesting and valuable measures to create scenarios just like what I’ve previously discussed in this tutorial.
Check out the links below and our website as well for more examples and related content.
Jarrett


