
I want to introduce you to a group of functions in Power BI called table functions. These functions include FILTER and ALL which we already used or mentioned in other topics.
There is a whole range of other table functions which includes functions like VALUES, TOPN, and ADDCOLUMNS. However, we are not going to cover all of them.
If you want to get a deeper understanding of these functions, I would recommend downloading the DAX Formula Reference Guide, checking out the Enterprise DNA Knowledge Base about some of your more specific questions. You may watch the full video of this tutorial at the bottom of this blog.

Visualizing How Table Functions Work
What I want to show you in this article is how table functions work.
If you look at this example, it is hard to imagine what this FILTER function is actually doing behind the scenes.
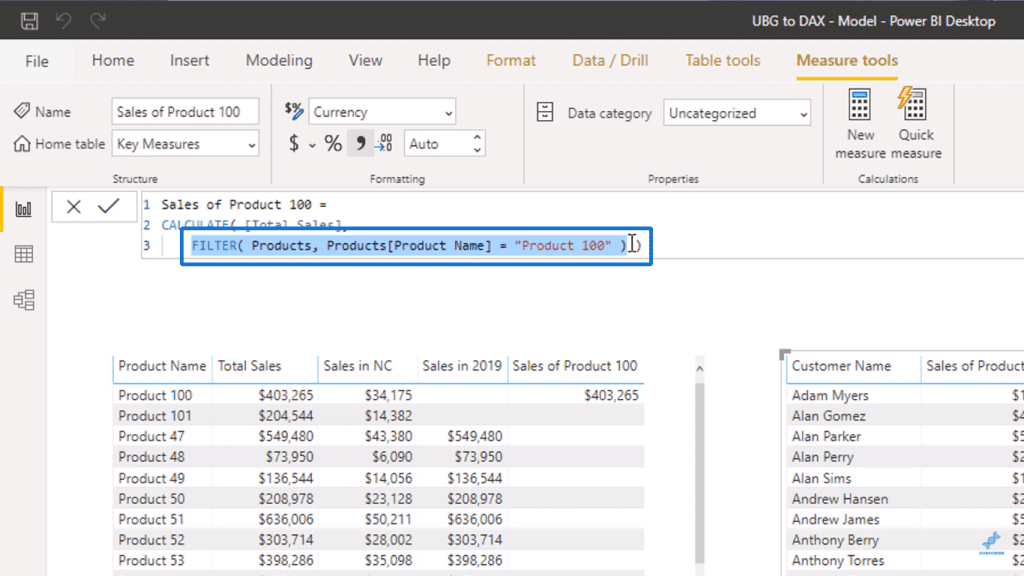
This is because when you call the FILTER function, there is no way for us to see the table that is being created in the background.
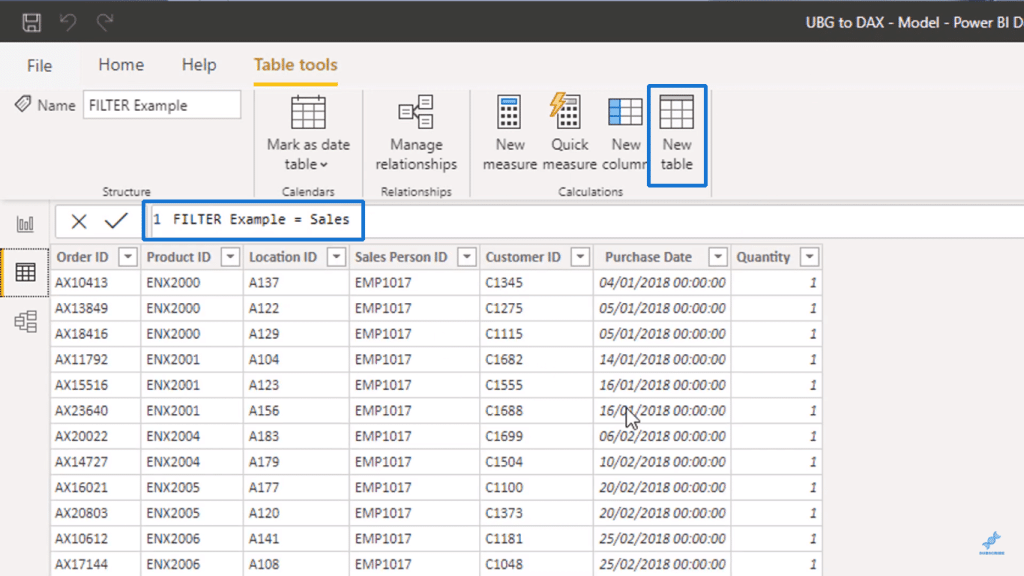
However, we can do it instead by creating a new table with just the formula.
First of all, you can duplicate a table just by entering the table name when creating a new table, as shown in this example where I duplicated the Sales table.
However, you can also use table functions here. What I will do is use FILTER, put in the Sales table, and then set the Quantity column greater than two to serve as the filter expression.

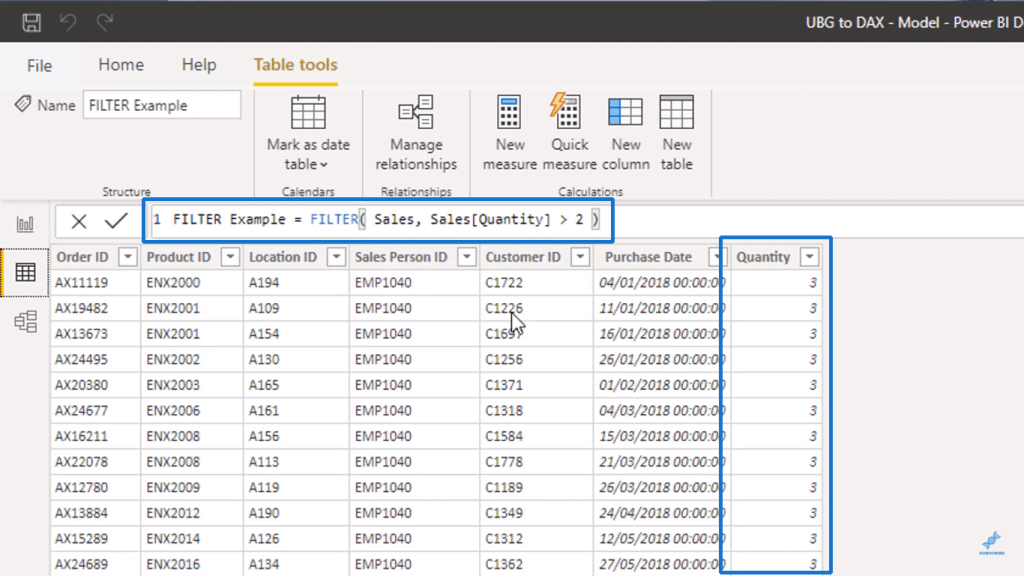
The original Sales table has about 15,000 rows, but now it only has 4,700 rows since the results have been filtered to only look at results with Quantity greater than two.
To show another example, I will use the FILTER function again, insert the Products table, use the Product Name column as the Filter Expression, and set it equal to “Product 100” to return a table with one product.
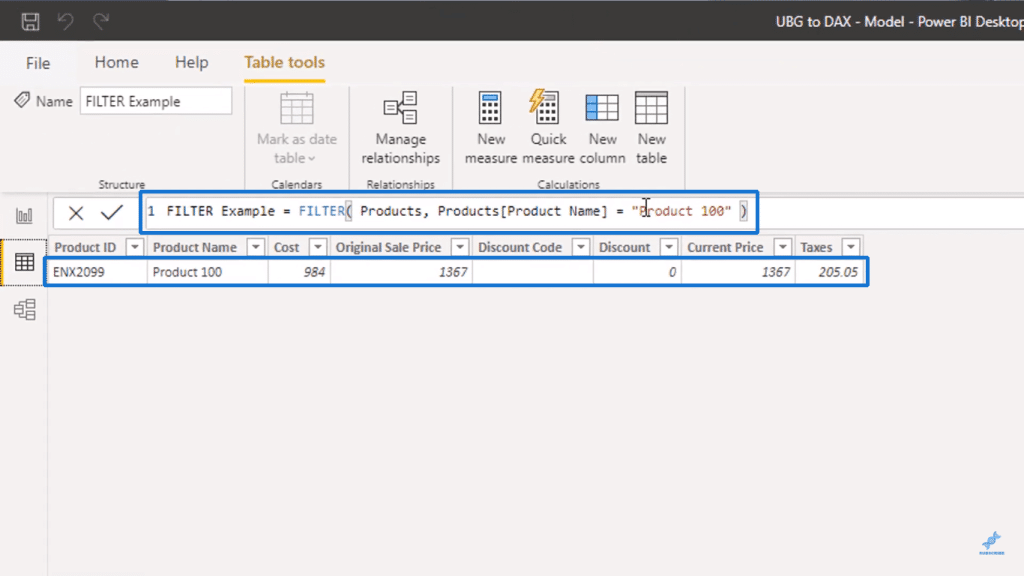
That is what happens behind the scenes when the formula is running within this table.
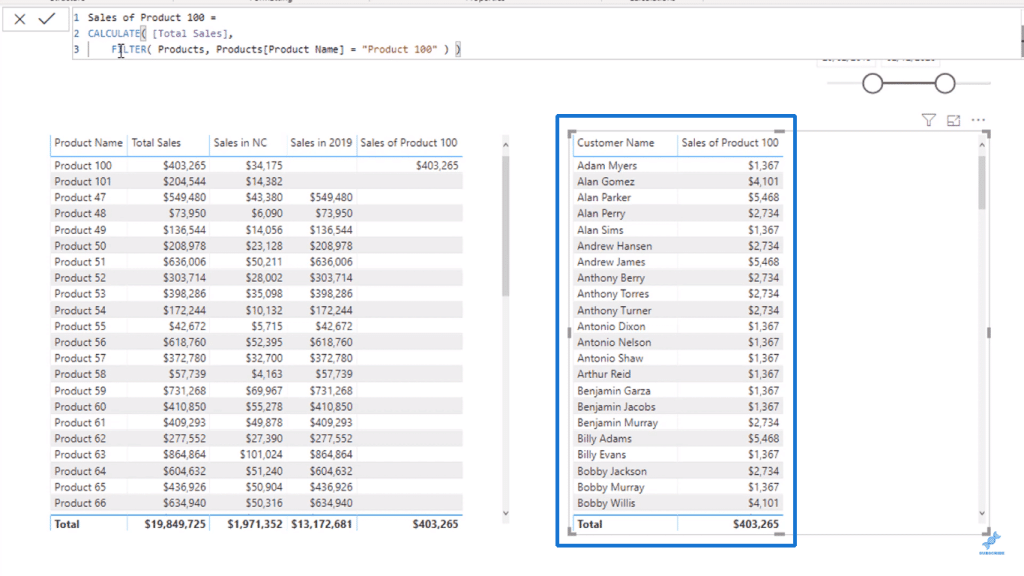
First, the evaluation context was applied through the Customer Name column. Then the FILTER function was added to provide additional context by reducing that Product table to just Product 100.
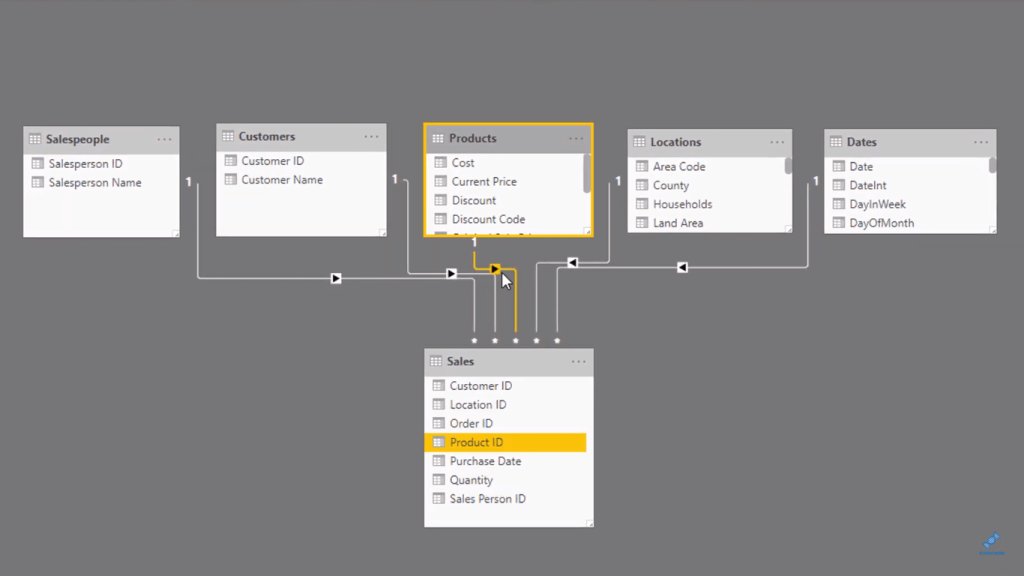
After that, Product 100 is being filtered behind the scenes which automatically flows down to the relationship with the Sales table, ultimately returning the Sales table of just Product 100.
VALUES Function Example
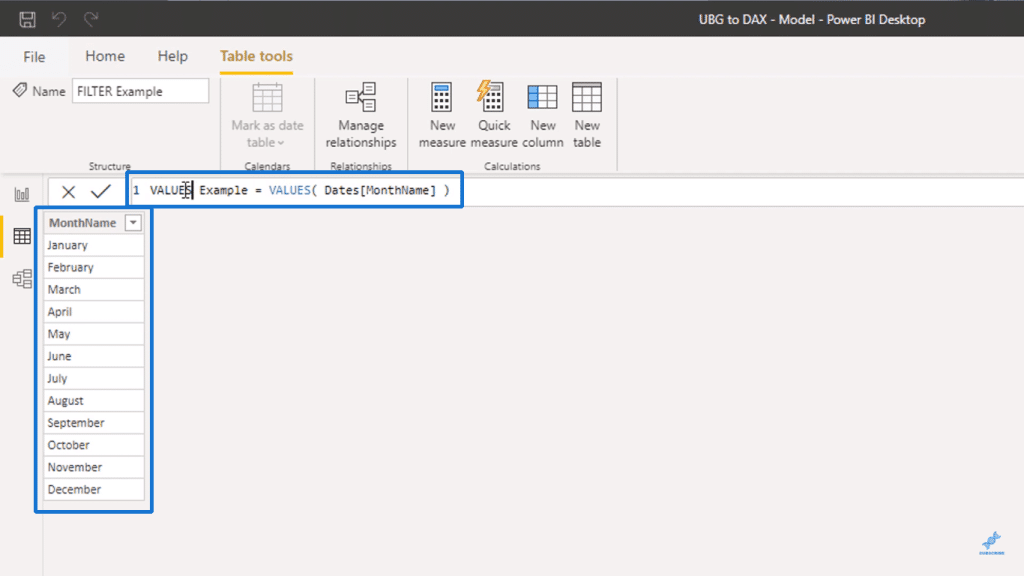
I want to introduce you to another table function in Power BI called VALUES. This function returns a one-column table of unique values.
For example within our Dates table, we can get a table of just the months.
To do this, I just have to use the VALUES function and put in the MonthName column from the Dates table.
Another thing we can do is to put the VALUES function inside measures. But again, it is hard to recognize the process within the measure since we cannot actually see the tables being generated.
That is why this is a good method for evaluating how these table functions actually work.
But what if we wanted to work out the average monthly sales for each individual person?
It is not immediately obvious how to do that without knowing how to combine the things that we have touched on before.
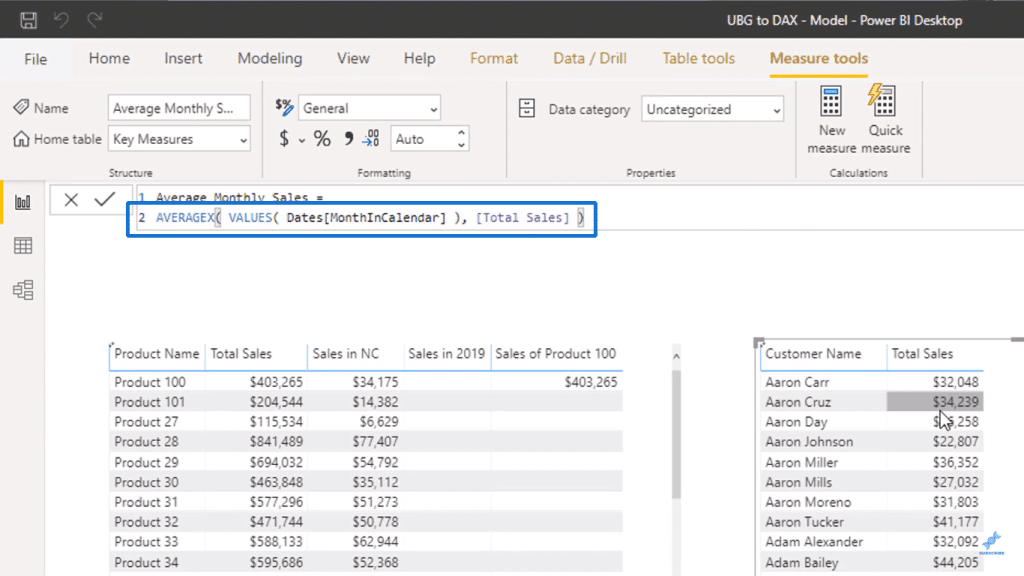
What I will do is create a new measure called Average Monthly Sales. Since we are dealing with the average, using the AVERAGE function would most likely come to mind first.
However, we actually need to use the AVERAGEX function here because an iterating function is required to evaluate the average at a monthly level.
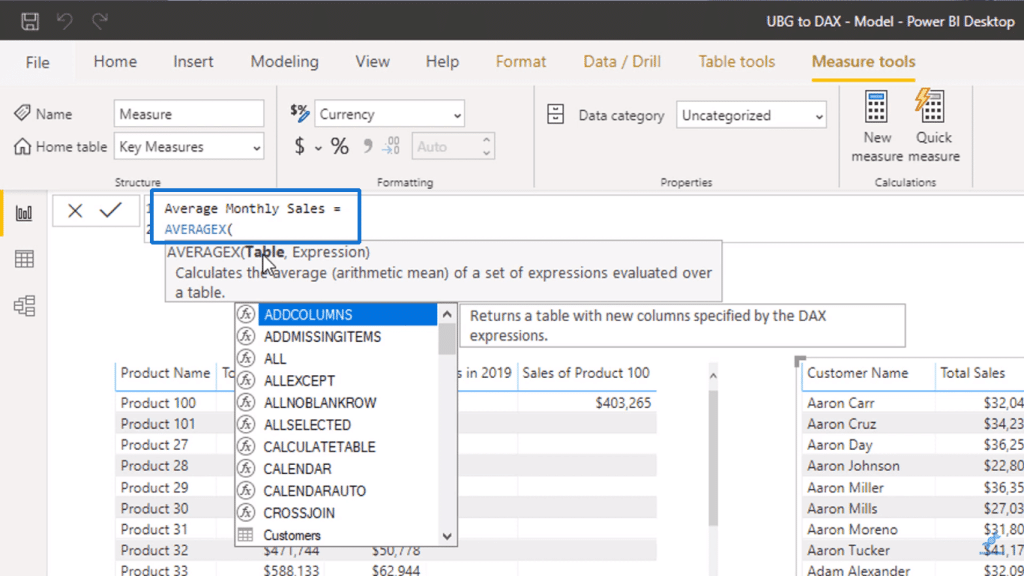
Within an iterating function, you can put in a table as its first parameter. However, you are not just restricted to using physical tables. You can also use table functions.

Since VALUES is a table function, I will use it and put in the MonthInCalendar column from the Dates table.
Iterating functions iterate through a table, and the table formed from VALUES through MonthInCalendar would contain unique values of months and years.
Using MonthInCalendar is necessary because if we just used the MonthName column instead, it will not work across different years.
To finish creating our measure, I will then put in Total Sales after VALUES to serve as the expression.
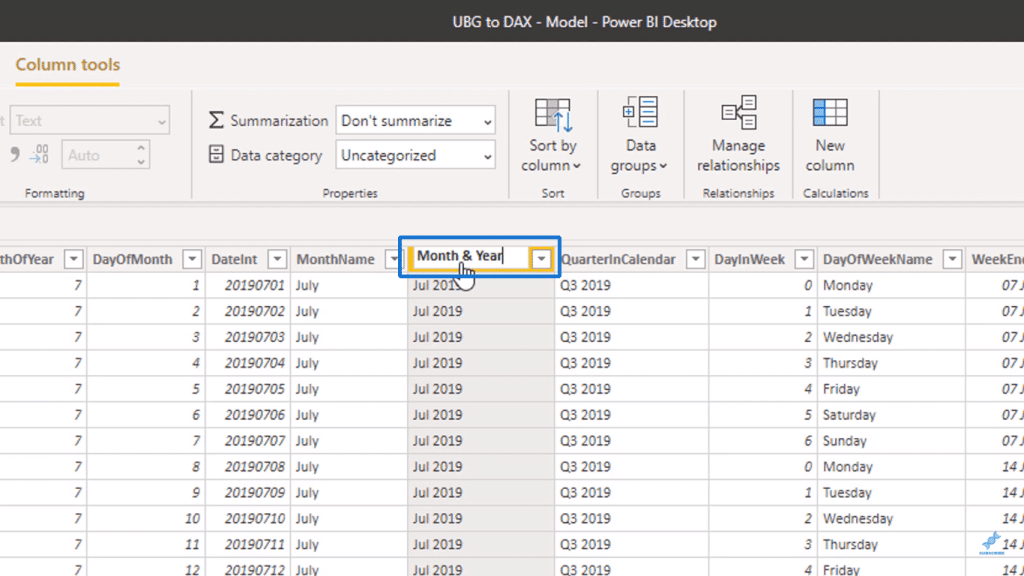
To avoid any confusion, I will go to the Data screen, select my Dates table, and rename MonthInCalendar to Month & Year.
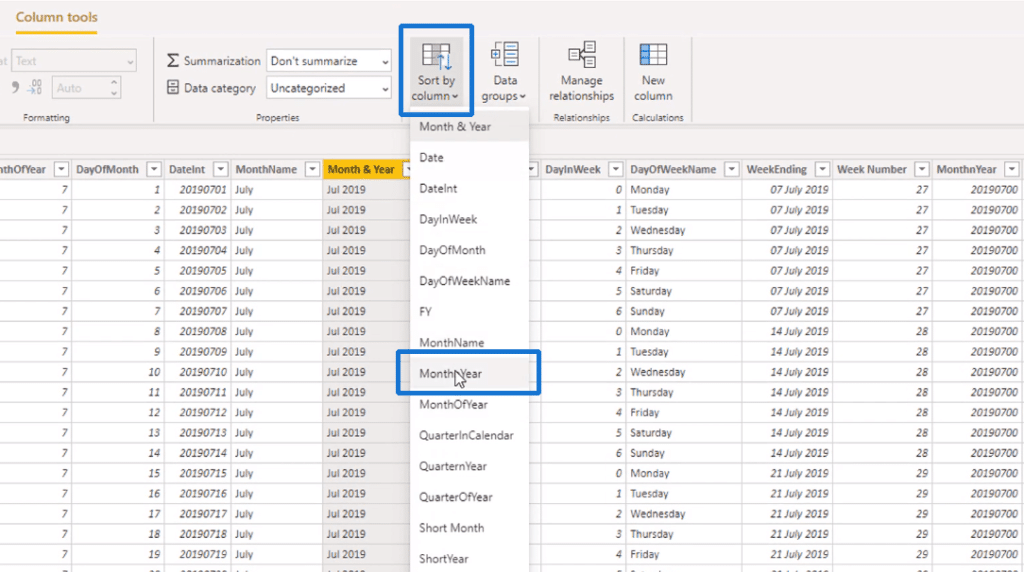
Then, I will click on Sort by column and sort it by the MonthInYear column to make sure that it is sorted correctly.
Finally, I can now drag and drop the new Average Monthly Sales measure so that we can see the values.
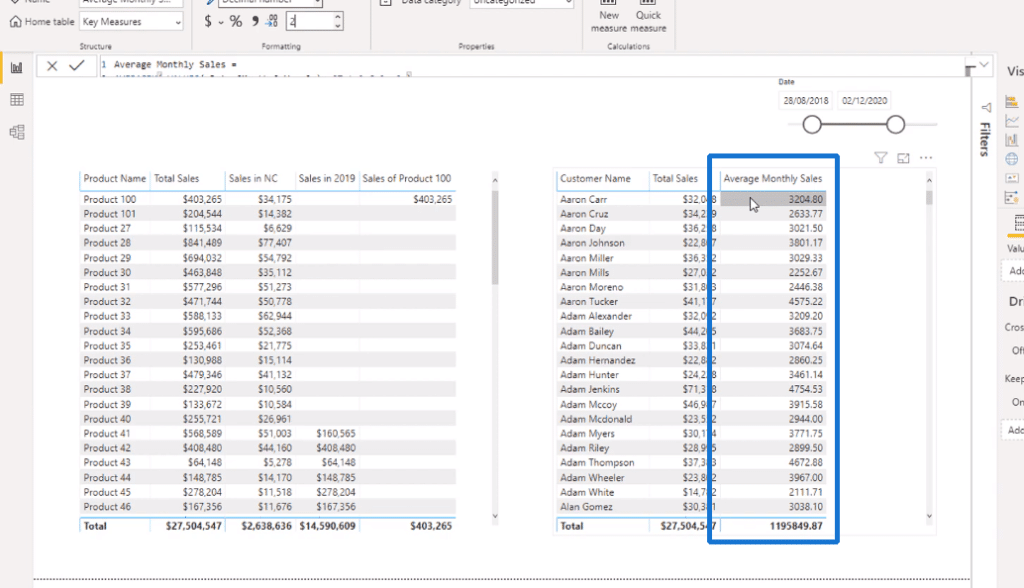
To review what we have done, the VALUES function returns a column of unique values.
The current context of the customer was first taken through the Customer Name column. Then, behind the scenes, I have created a one-column table of unique values of the month and year.
Inside AVERAGEX, I iterated through every single month and year to work out the Total Sales that each customer has made through those months and years. Those sales are then saved into the memory for each of the months.
Finally, all those calculated results were then ultimately averaged out to get the Average Monthly Sales.
This process is very versatile since you can put Year inside of VALUES instead of Month & Year to calculate for the average annual sales.
Additionally, you are not restricted to just use dates since you can also put in the Product Name to find the average sales by product instead.
You can find unique calculations quickly by combining these techniques.
ALL Function Example
I want to show you one more table function in Power BI called ALL which is also known as the remove filter function.
This function acts like the opposite of the VALUES function in a lot of ways.
To show you an example, I will create a new measure called All Customer Sales, use the CALCULATE function, and put in Total Sales as the expression.
Then, I will use the ALL function and put in the Customers table since you can put a table or a column inside of it.
After dragging in the new measure, you might notice that it provides the same values with the Total under Total Sales.
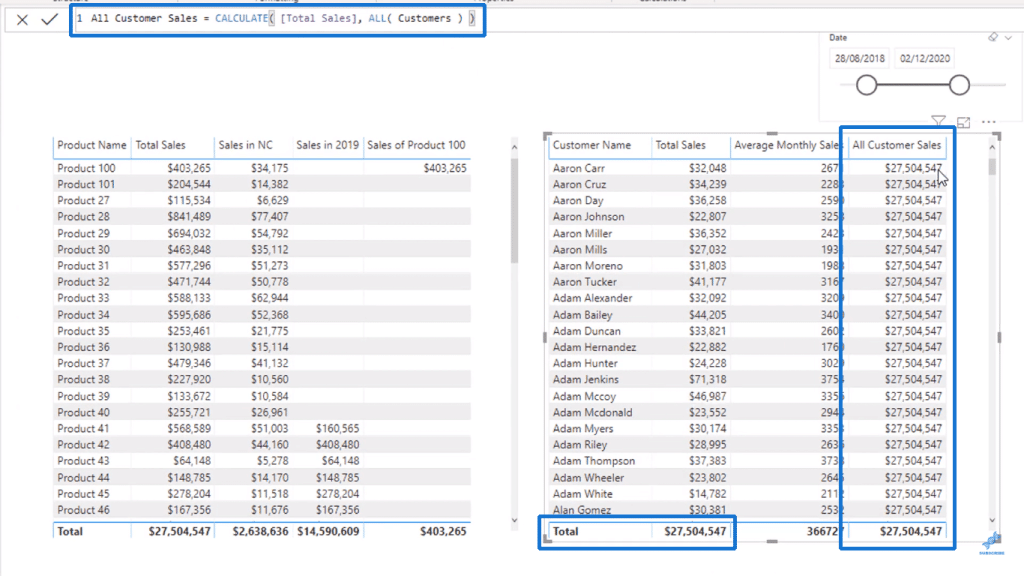
Basically, the ALL function removed any filters in the current context of the Customers table.

Because we have the Customer Name in our current context, the ALL function disregarded any filters from the Customers table and returned the total of every single result instead.
***** Related Links *****
How To Use The CROSSJOIN Function – Power BI & DAX Tutorial
Iterating Functions In DAX Language – A Detailed Example
Advanced Tips To Optimize Your Power BI Table
Conclusion
We discussed some of the key table functions and how they work inside Power BI.
Having a good understanding of these functions is crucial because you can actually combine a lot of them in the same formula.
You can create more interesting calculations when you start getting used to your formula combinations.
All the best,
Sam
[youtube https://www.youtube.com/watch?v=IkpyzOV-tpg&w=784&h=441]


