
I’m going to show you how to use IsAfterToday in extended date tables for Power BI time intelligence scenarios.
When it comes to DAX functions and other tools, I assign them certain jobs or personas in my head so that I can easily remember what they do. For example, I see SWITCH as an air traffic controller. I think of FILTER as a bouncer at a club who decides who gets in and who doesn’t.
As for IsAfterToday, I see it as the Terminator who sweeps through my data, tables and visuals to take out everything I don’t need. You may watch the full video of this tutorial at the bottom of this blog.

Accessing IsAfterToday Through The Extended Date Table
To access IsAfterToday, I need to use an extended date table. That’s because IsAfterToday is actually not a DAX function; it’s part of the table itself.
If you go into your table’s data view, the IsAfterToday column looks like this.
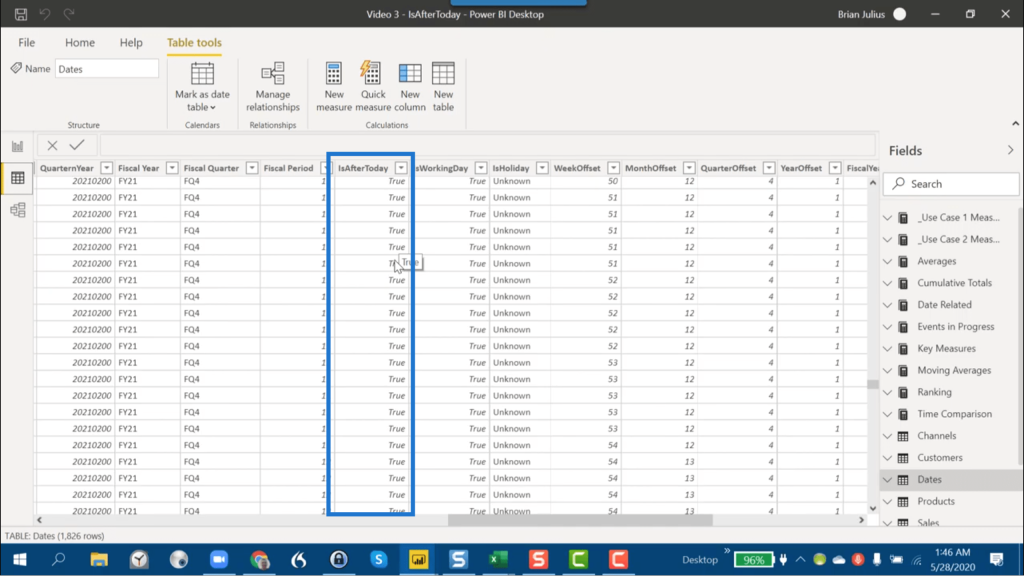
The logic behind IsAfterToday is simple. If the date falls after today, it’s TRUE. If it’s before today, it’s FALSE.
To further show you what IsAfterToday can do, I’m going go through two use cases that perfectly showcase its relevance in Power BI time intelligence scenarios.
Terminating Cumulative Totals
The first use case is about terminating cumulative totals. It’s a case that’s often asked about in the Enterprise DNA Forum.
In this example, I’m going to show you how using a DAX measure would require around 38 lines, but how using IsAfterToday can do the job in just 2 clicks without the use of DAX.
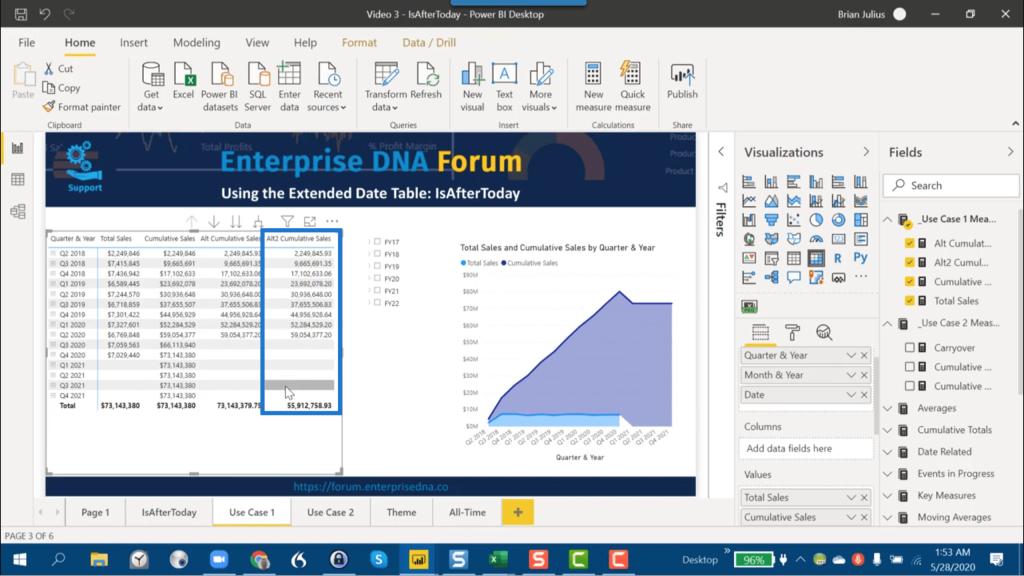
This case involves a basic structure.

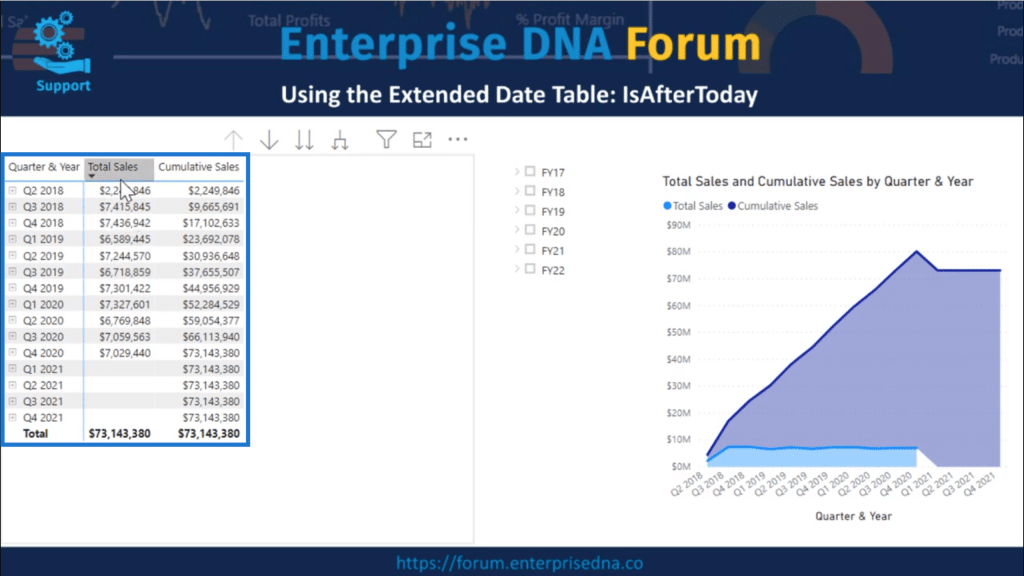
I have the Quarter & Year, the Total Sales and the Cumulative Sales.
The Total Sales runs from 2018 up to the present, and then continues with some forecast data through the end of 2020.
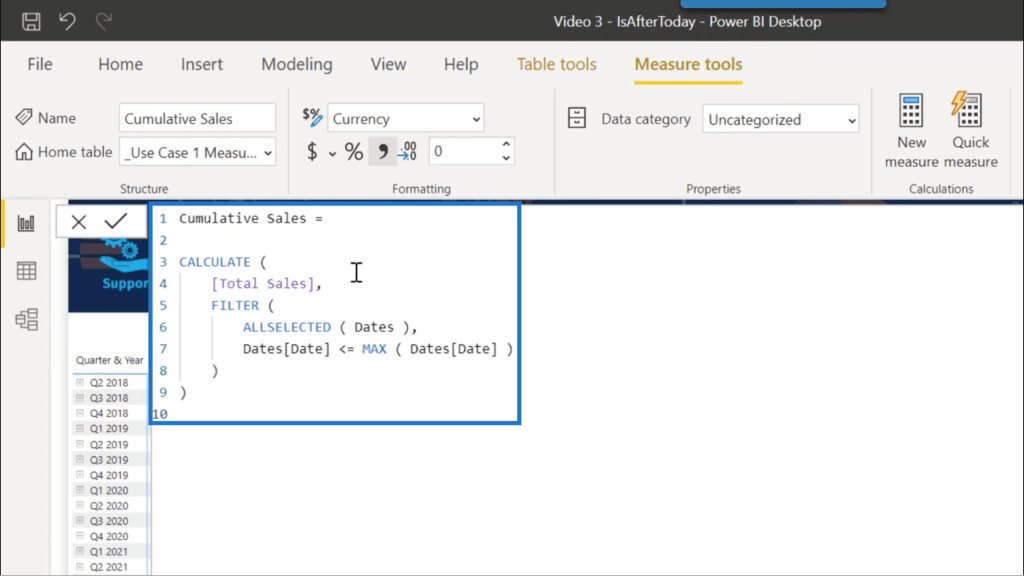
As for the Cumulative Sales, it’s just the basic Cumulative Sales pattern with ALLSELECTED applied on the Dates.
The visualization shows me that there’s a problem somewhere because the data becomes questionable after the Total Sales drops out.
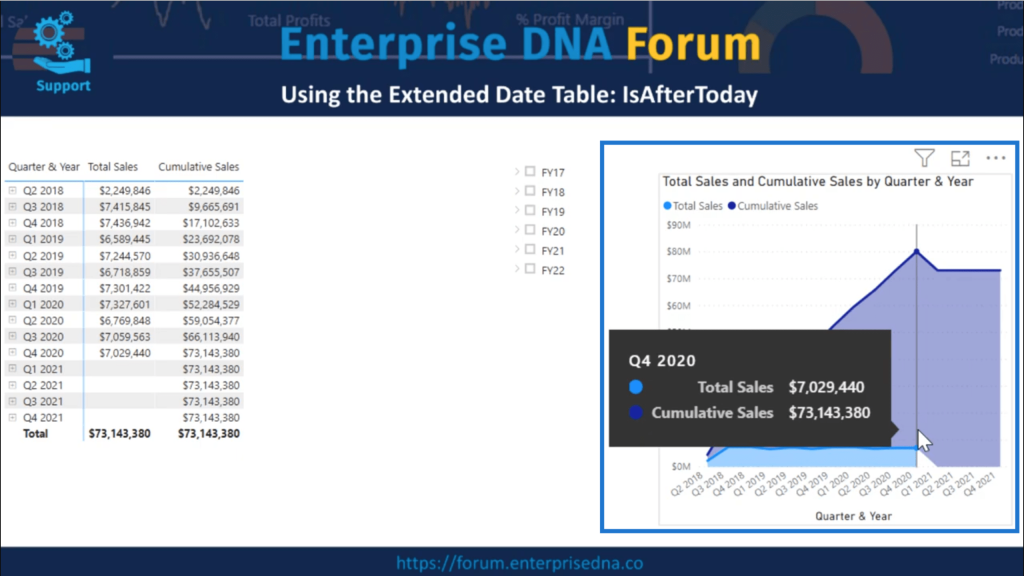
Looking back at the table, there’s no data for 2021.
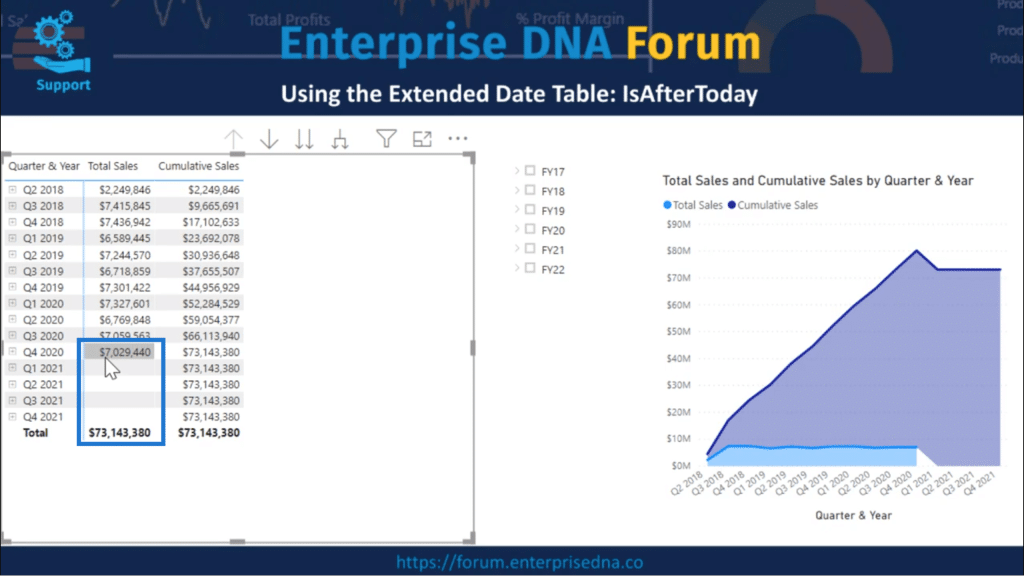
So in the chart, the last figure is just repeated over and over until the end of 2021.
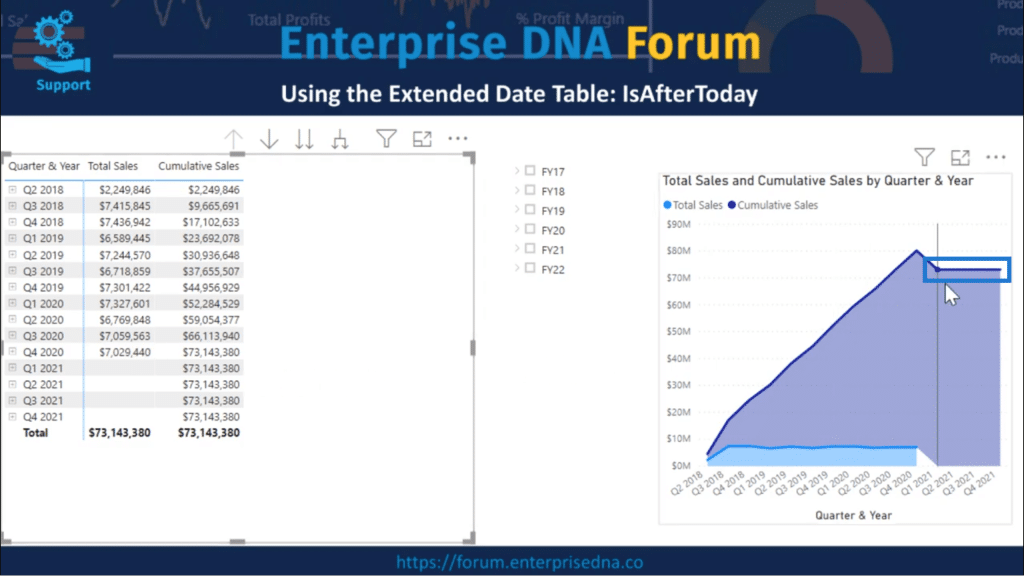
So how do we clean up the Total Sales and the Cumulative Sales?
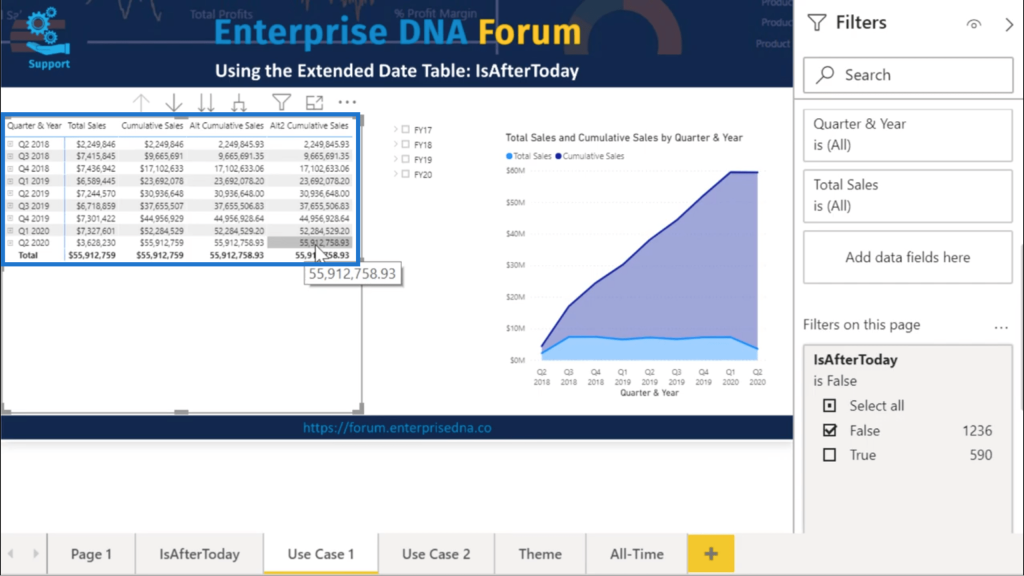
First, I’ll use the DAX approach. I’ll start off by dropping this column for Alt Cumulative Sales into the table.
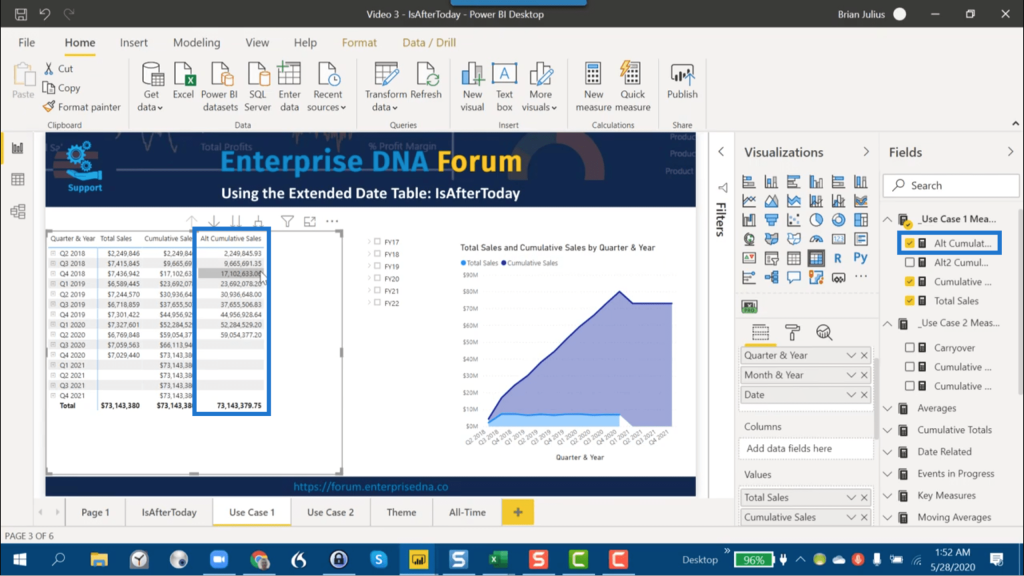
This is what the the Alt Cumulative Sales measure looks like.
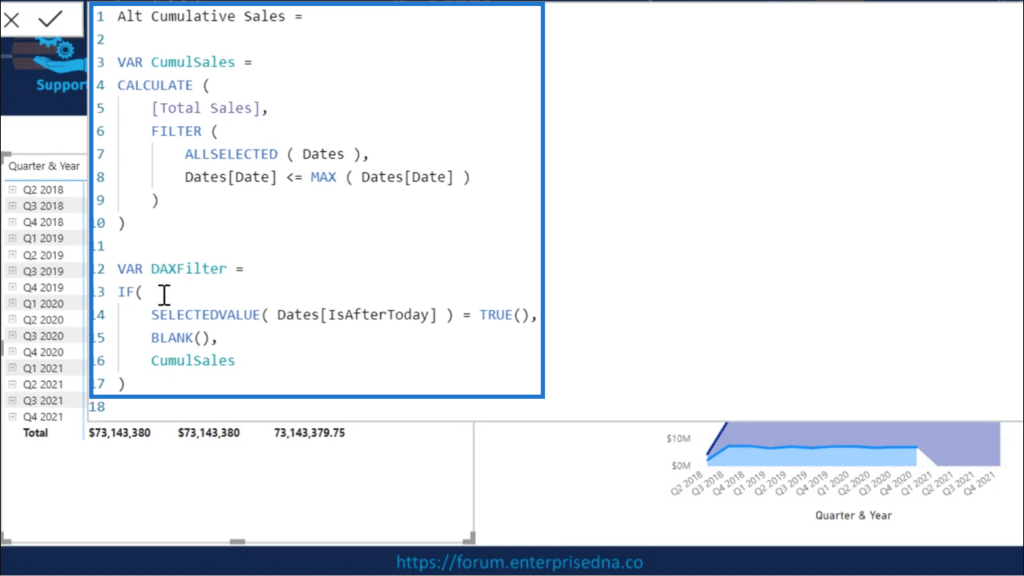
It also shows an IF filter that says if IsAfterToday is TRUE then a BLANK is assigned to it. If not then the Cumulative Sales value is assigned to it.

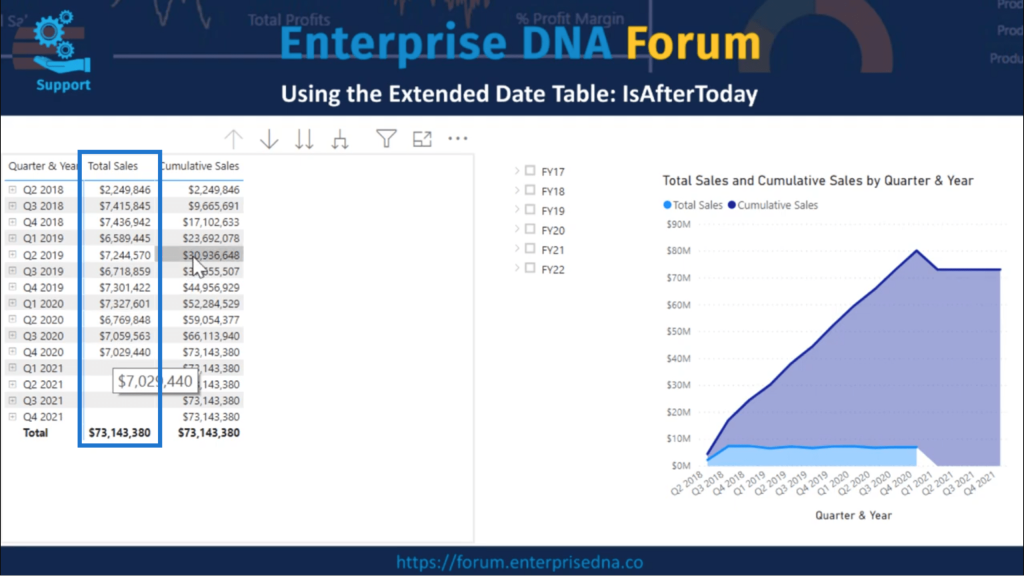
So, if I go back to the table and check, it does show that it returns the right value row by row.
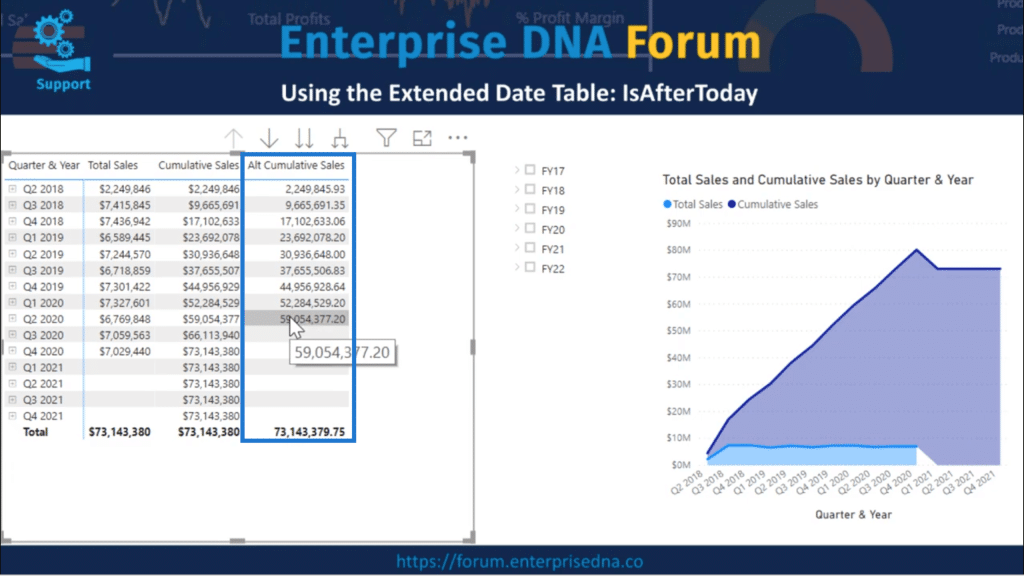
The problem, however, is in the Total.
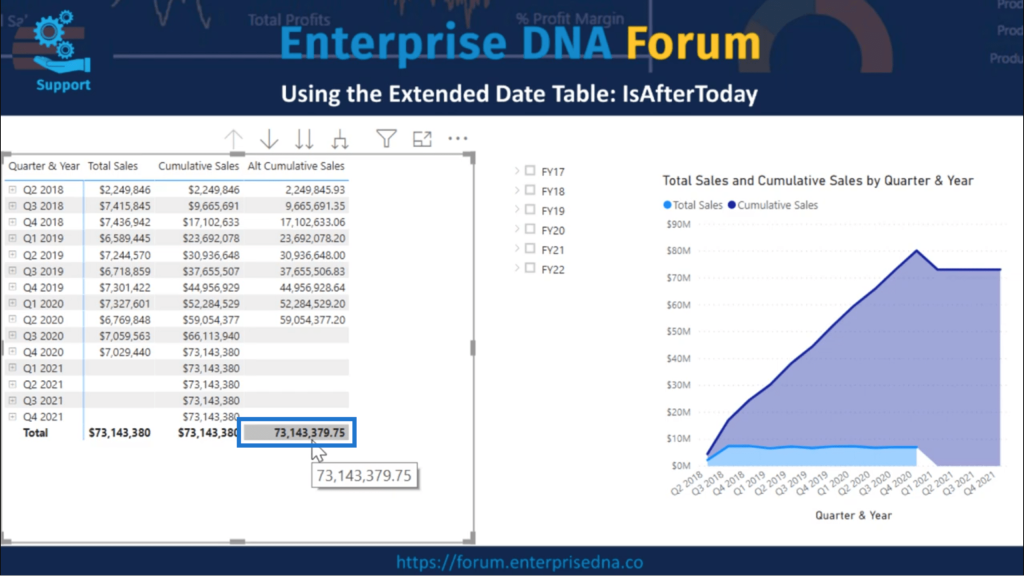
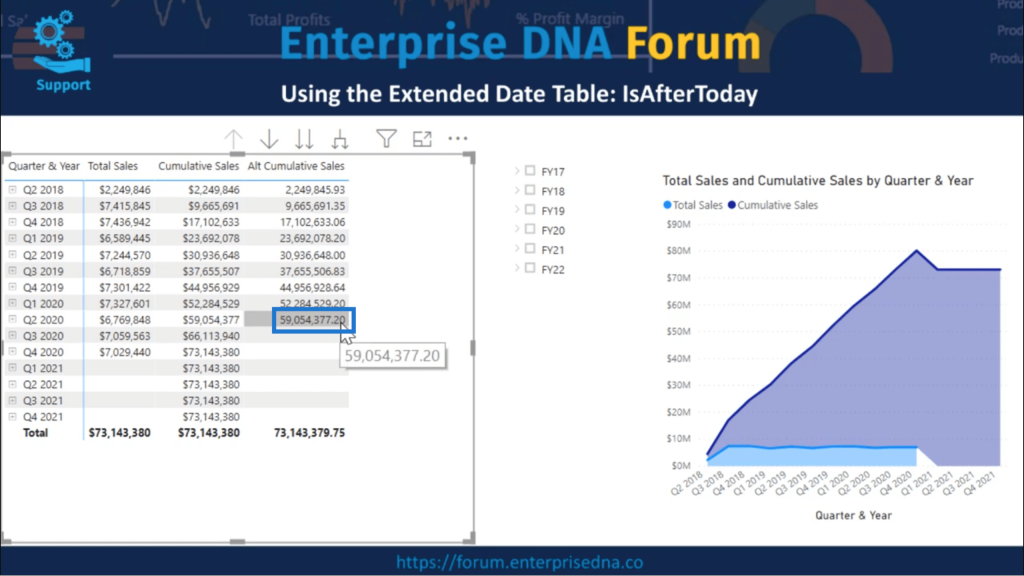
The Total is showing 73 million when it should show the last value, which is 59 million.
So, I’ll drop the Alt2 Cumulative Total into the table to show you what the correct data should look like.
Now, I’ll show you the difference between the Alt Cumulative Sales column and the Alt2 Cumulative Sales.

Here’s the same Cumulative Sales measure.
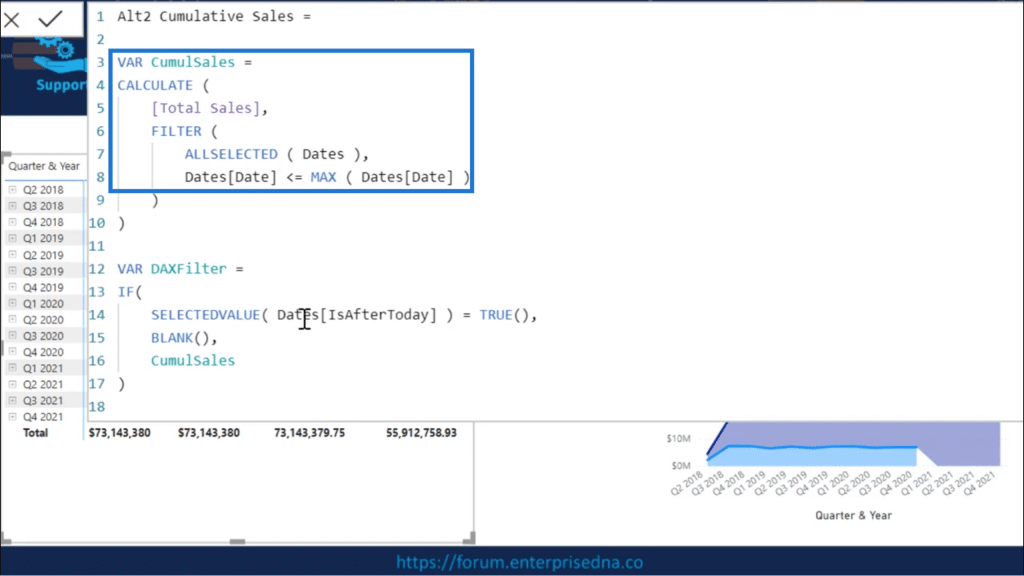
Then here’s the DAXFilter where IsAfterToday is applied.
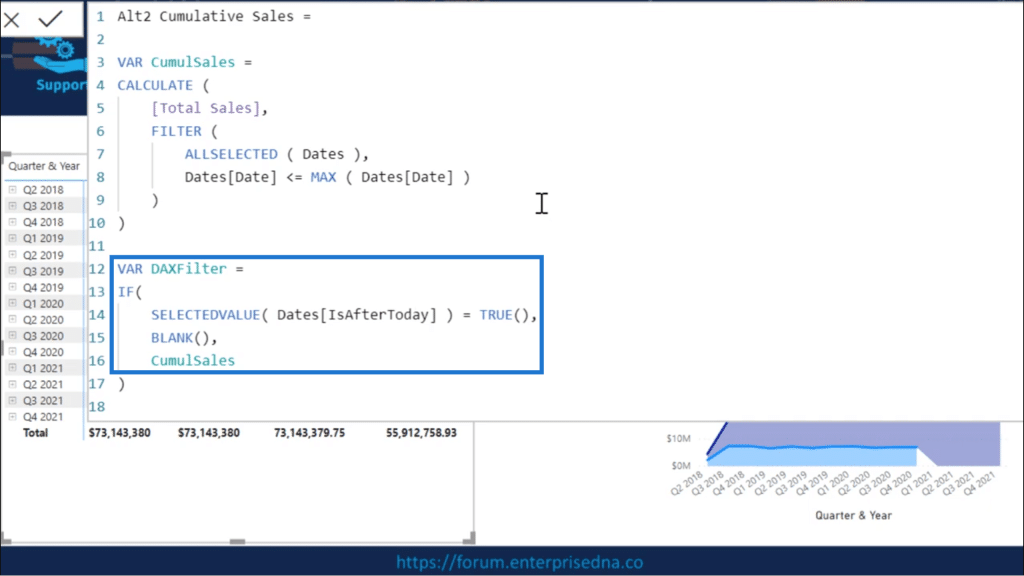
In the measure I used earlier, nothing came after that. That’s why the values were correct for each row, but there was no way the calculation could tell if it had reached the final row or not.
In this case, there’s a whole new structure that does that.
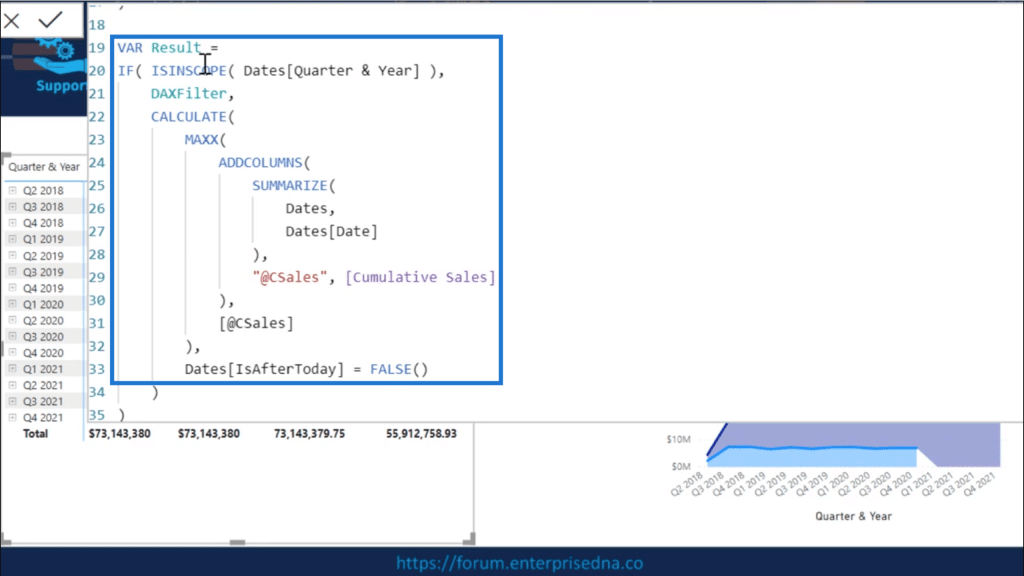
There’s an IF ISINSCOPE function being applied so that if I reach the total row, I automatically force a total of all the Cumulative Sales up to that point.
This is the approach that a lot of Power BI users apply, mostly because it actually works. But again, it also means having to write over 30 lines of DAX.
This time, I’ll show you how to do it in just a few clicks.
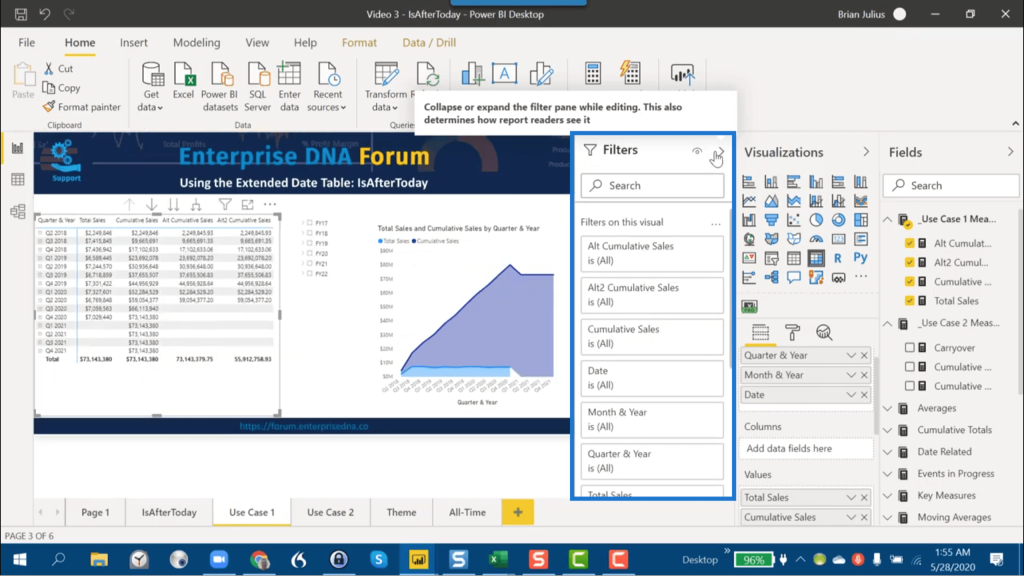
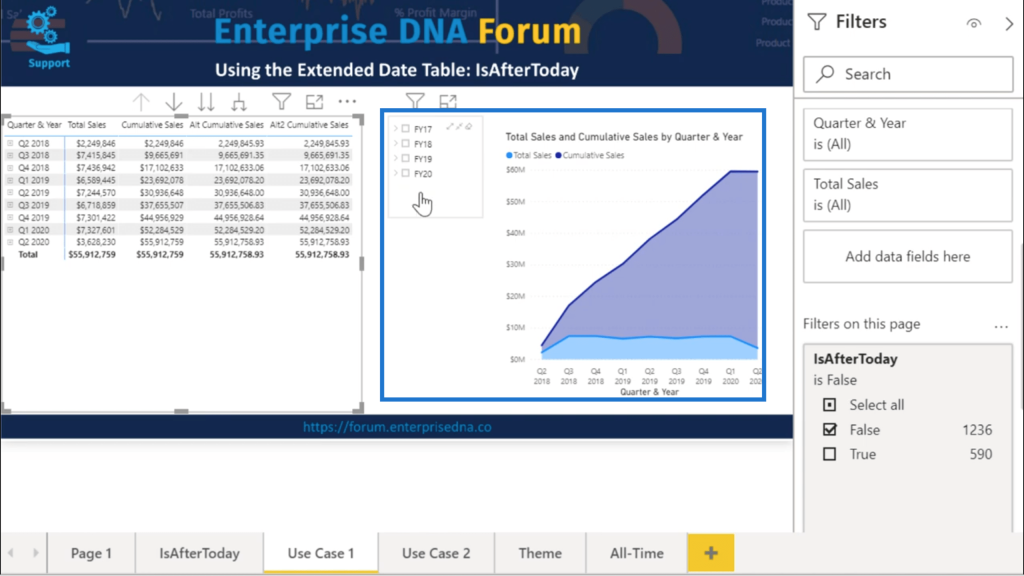
Just click on this small arrow here to show the filters.

This is what that’s going to look like once the filters are showing.
Then under Fields, I’ll search for IsAfterToday.
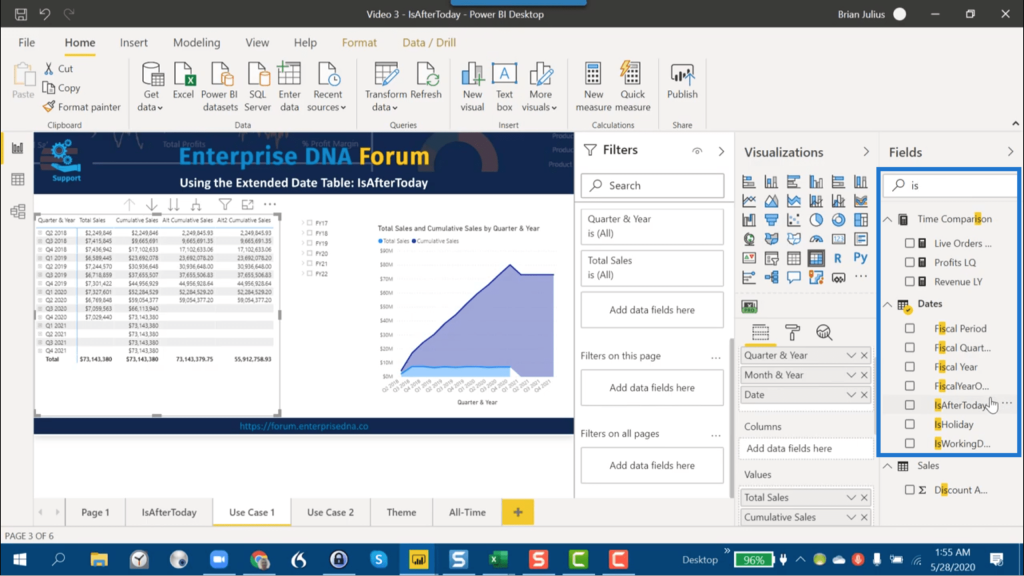
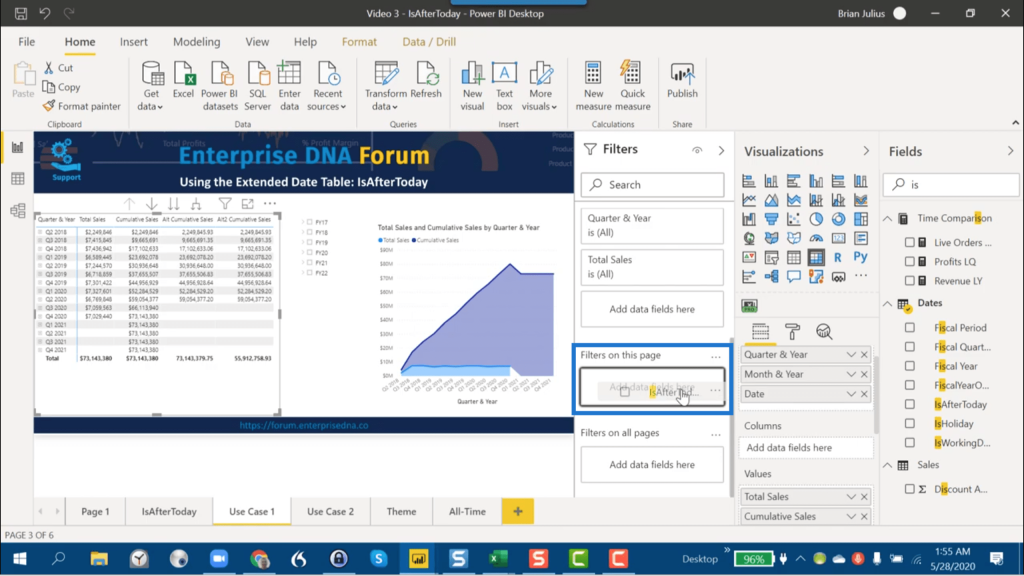
I’ll drag and drop that into my filters.
Then, under that IsAfterToday filter, I’ll tick False, which means I’m referring to today or earlier days.
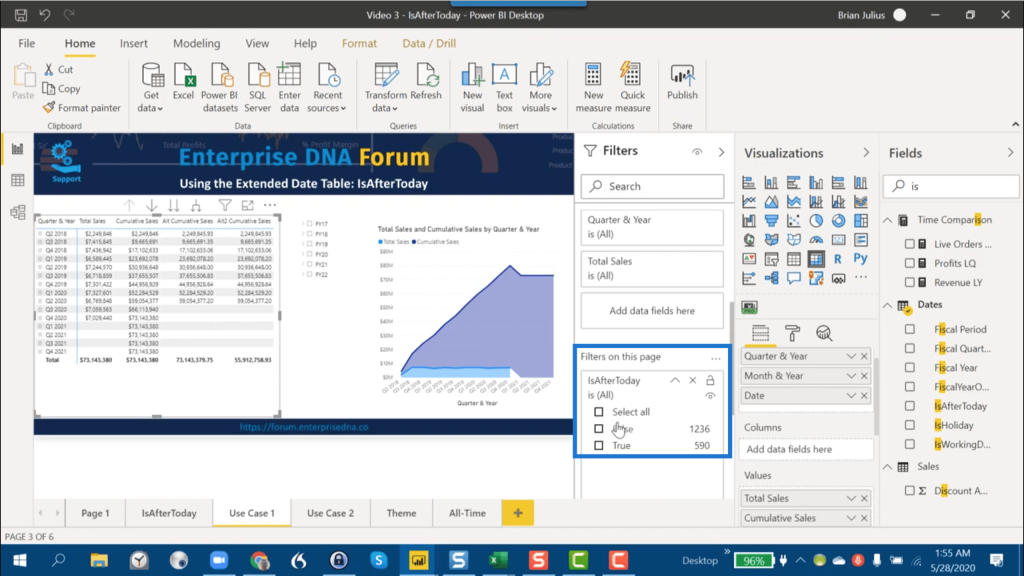
Look at how that cleans things up. All the values are in the right places now. The totals are also correct.
The same thing can be said for the visualization and the slicers.
Evidently, this approach is much more efficient than purely using a DAX approach.
Splitting Current Data And Forecast Data
I’ll now work on the second use case, which involves taking the Total Sales field and splitting the data into current data and forecast data using IsAfterToday.
I also want to make it dynamic so that over time it puts more data into the actual and less data in the forecast until it reaches the end of the forecast period and everything becomes actual.
I still have the Total Sales from the last example. As mentioned earlier, it has data from the past and the present, plus data towards the end of the year. So it’s a mix of actual data and forecast data.
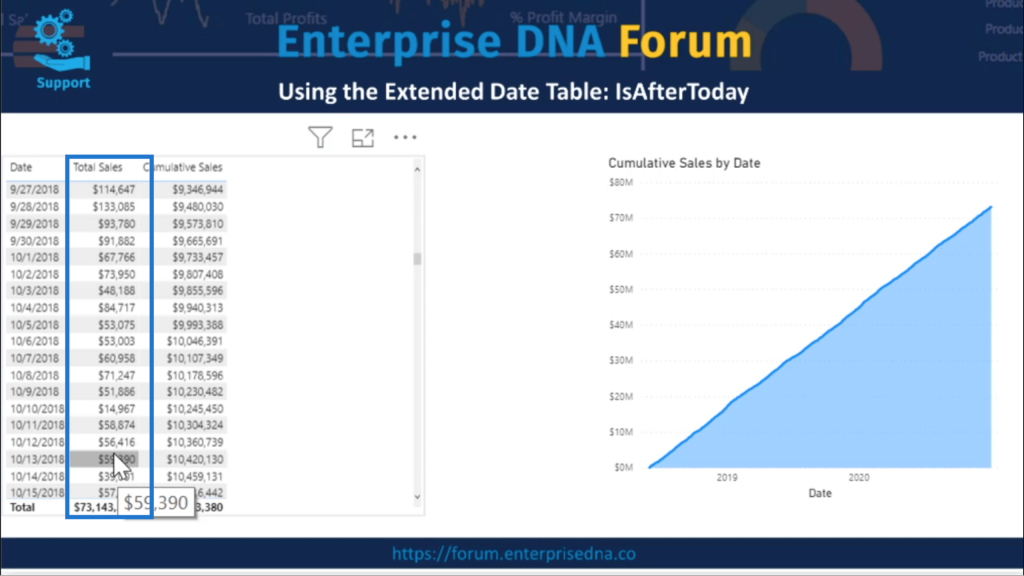
I also have my basic Cumulative Sales measure on top of that and a Cumulative Sales visual.
And let’s say what we wanted to do is to take and actually decompose that total sales in our visual into actual and forecast.

So, for Actual Sales, this is what the DAX measure is going to look like.
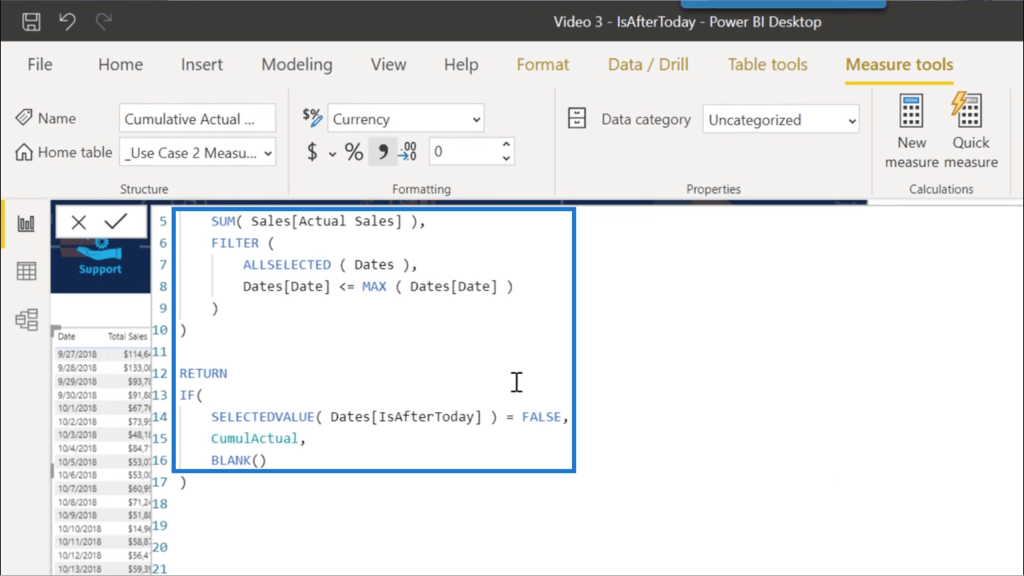
Basically, this states that if the date returns a FALSE for IsAfterToday, the Cumulative Actual value should be used. If not, a BLANK should be returned.
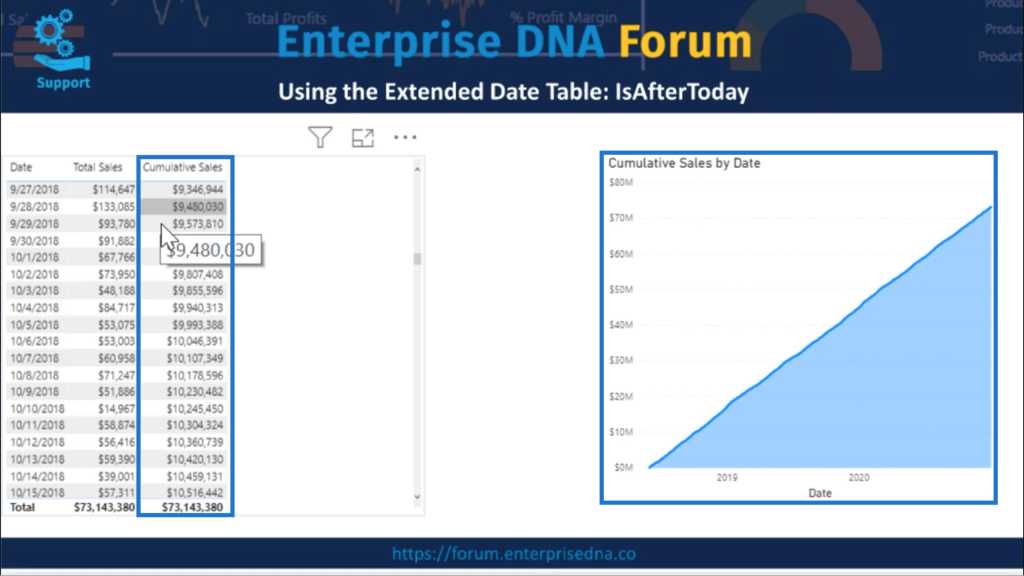
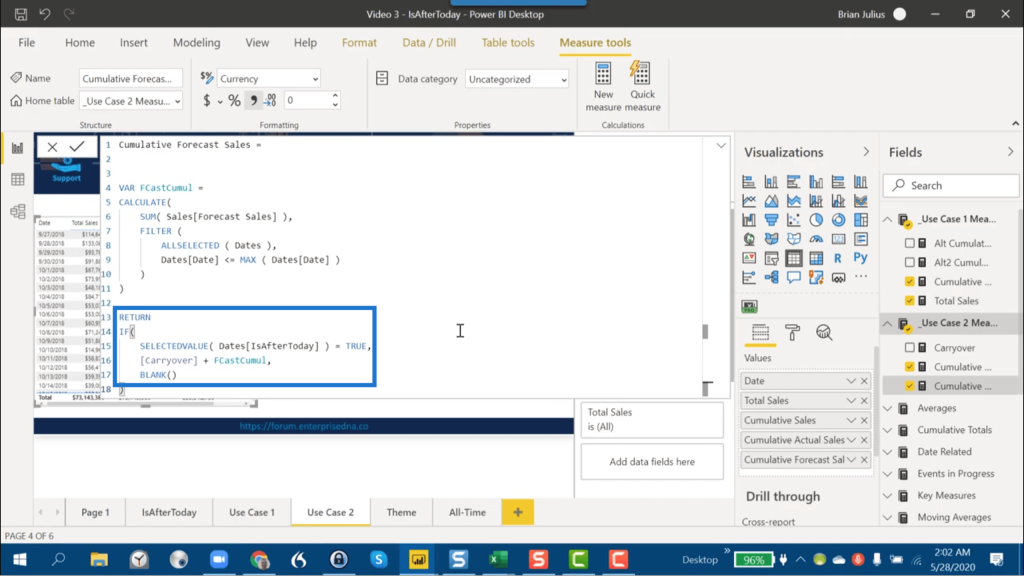
Now I’m going to take the measure for Cumulative Forecast Sales and add it under my Values as well.
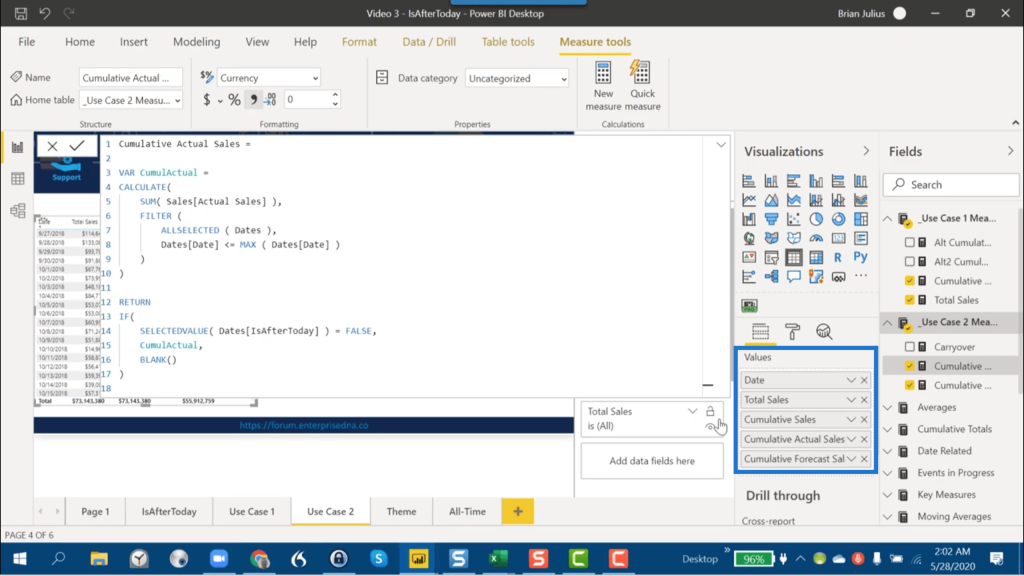
Lookin at the DAX however, it’s showing TRUE for IsAfterToday to return the forecast values.
Under visualizations, I’ll remove Cumulative Sales.
Then, I’ll drop the Cumulative Actual Sales and Cumulative Forecast Sales there instead.
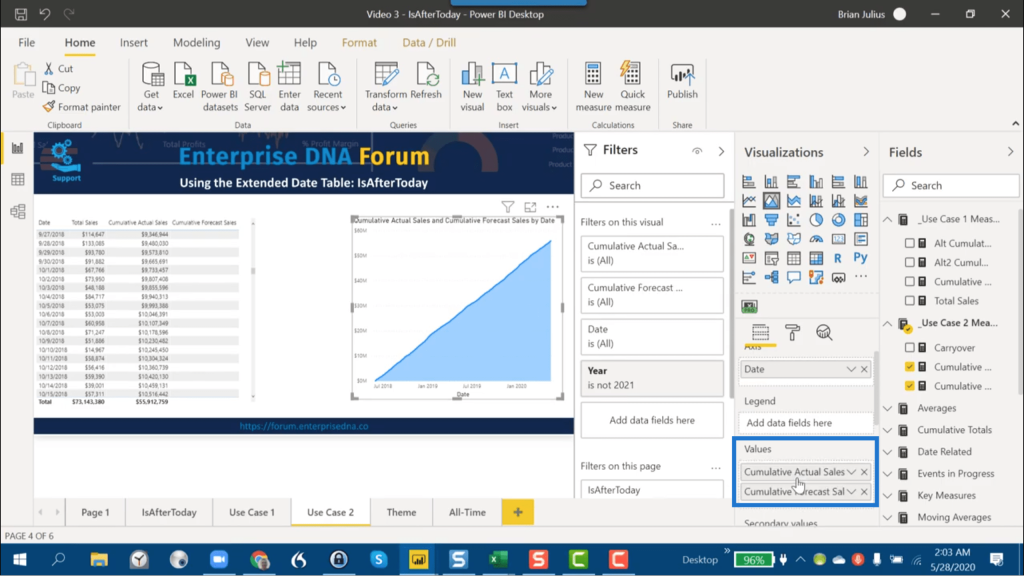
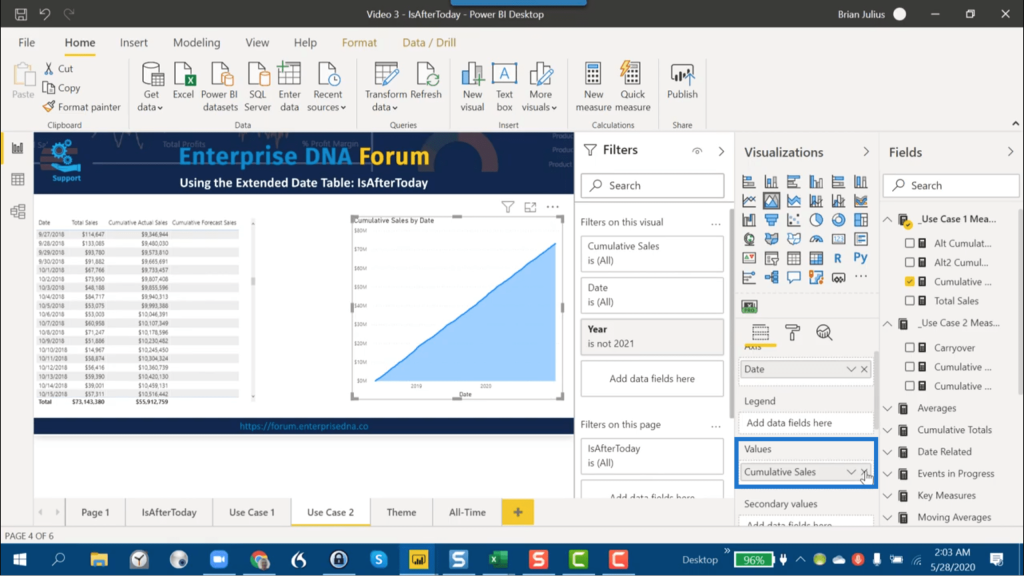
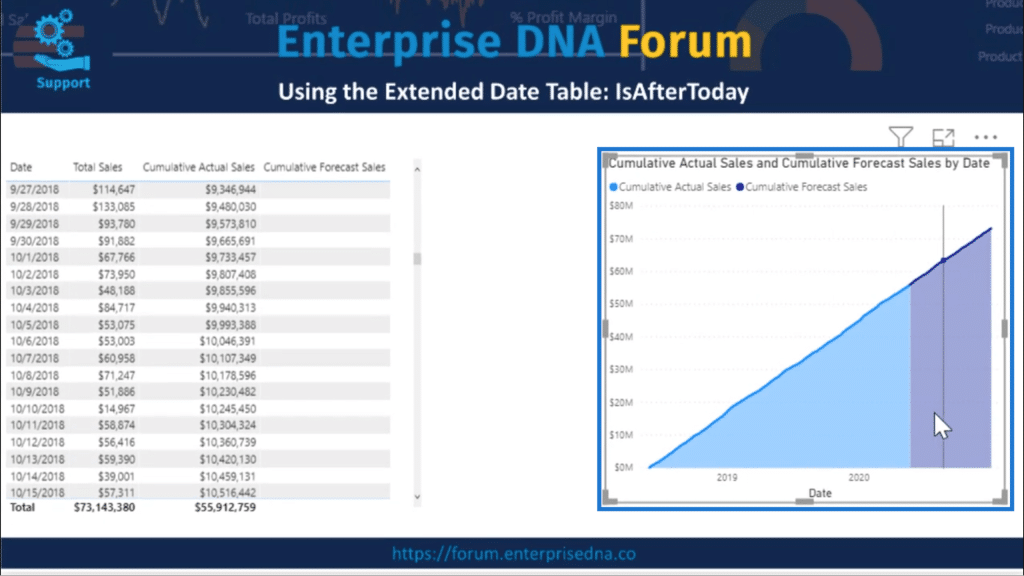
Now, the visualization shows the Cumulative Actual Sales and Cumulative Forecast Sales clearly decomposed in the visualization.
***** Related Links *****
Build A Comprehensive Date Table In Power BI Really Fast
Forecasting In Power BI: Compare Performance Vs Forecasts Cumulatively W/ DAX
Data Normalization In Power BI For Different Days Results
Conclusion
These are just two of the useful cases where IsAfterToday proves to be beneficial. I encourage you to just click and experiment with it to discover even more ways to use it for your Power BI time intelligence problems.
This was also a good way to showcase that although DAX is truly powerful, there are also cases where a quicker alternative is needed. It’s all about mastering the pros and cons of using DAX in any given situation so that you can always choose which approach you want to apply.
All the best,
Brian


