
This tutorial will discuss and solve Problem Of The Week #5 in the Enterprise DNA forum using the DAX TOPN function. The problem requires a solution with 4 requirements. One requirement of the problem is to calculate the dynamic Last N Weeks Trends of a COVID-19 data report. You can watch the full video of this tutorial at the bottom of this blog.

Abstract Of The Problem Of The Week #5
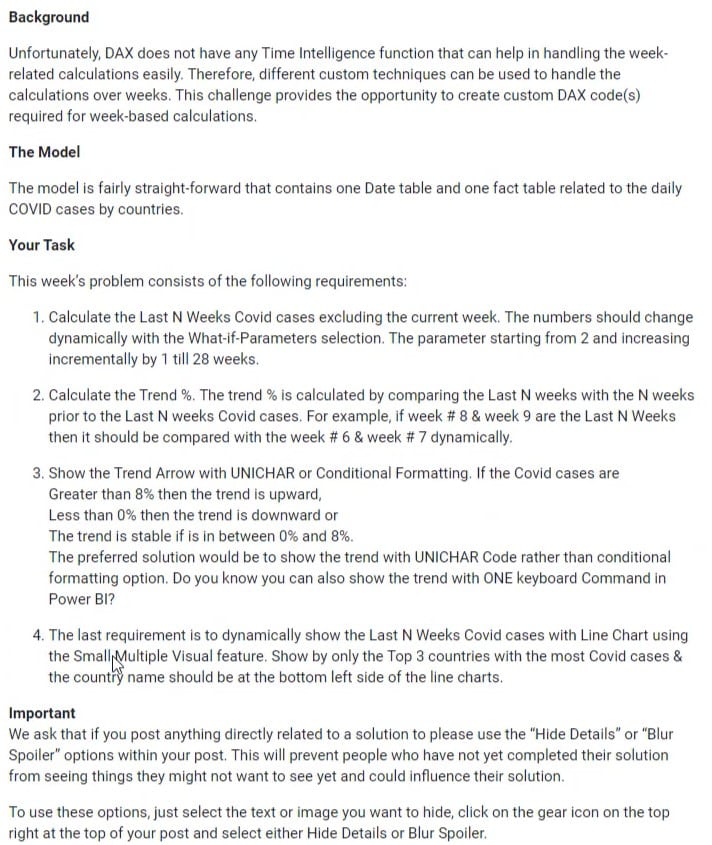
This is the laid-out instruction for Problem Of The Week #5:
There’s an available video in the Enterprise DNA Forum that you can watch about the in-depth requirement of the problem.
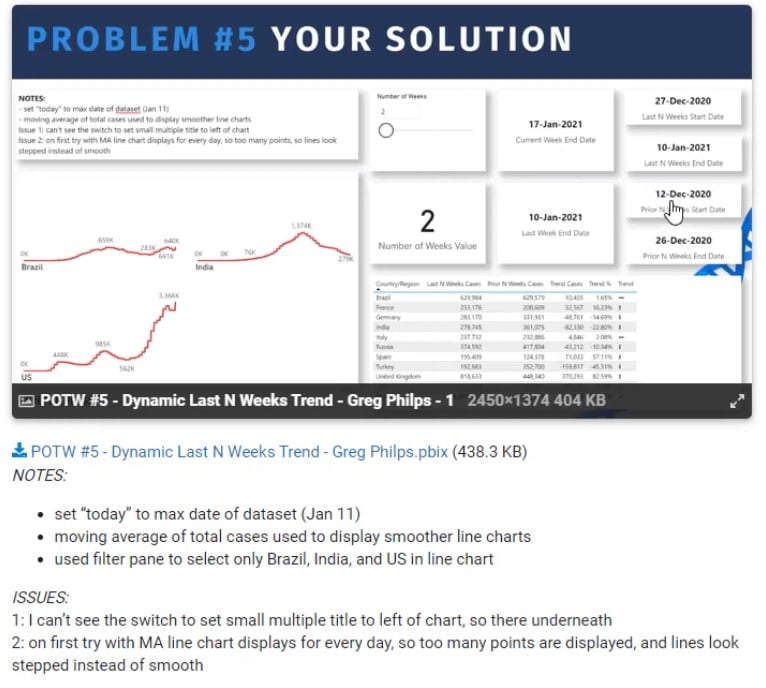
Enterprise DNA Expert Greg Philips also posted a solution that lets you see the range that you’re filtering in the report.
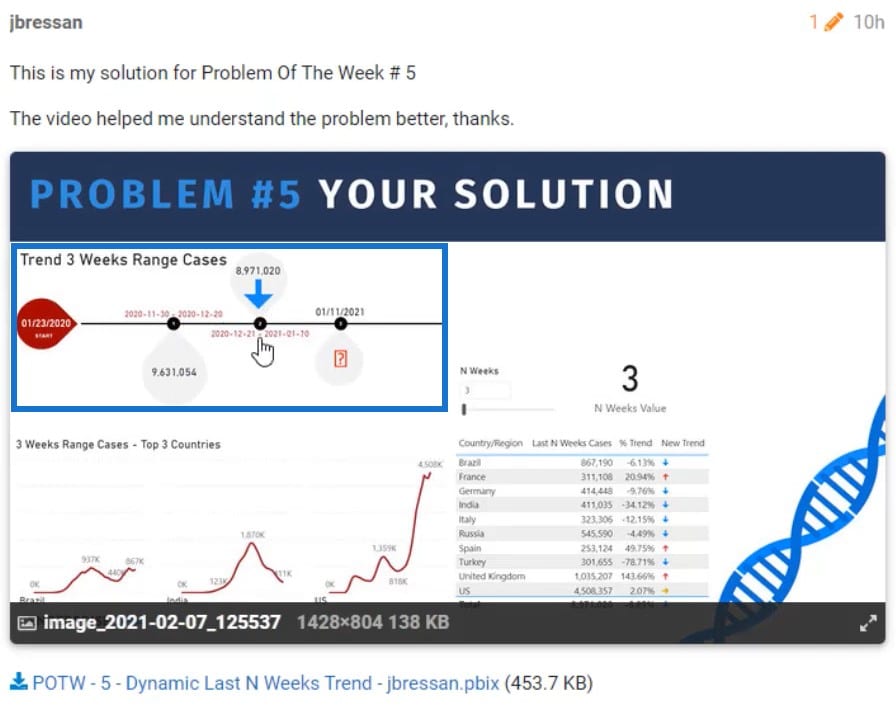
A member, jbressan, posted his solution with dates in a timeline format.
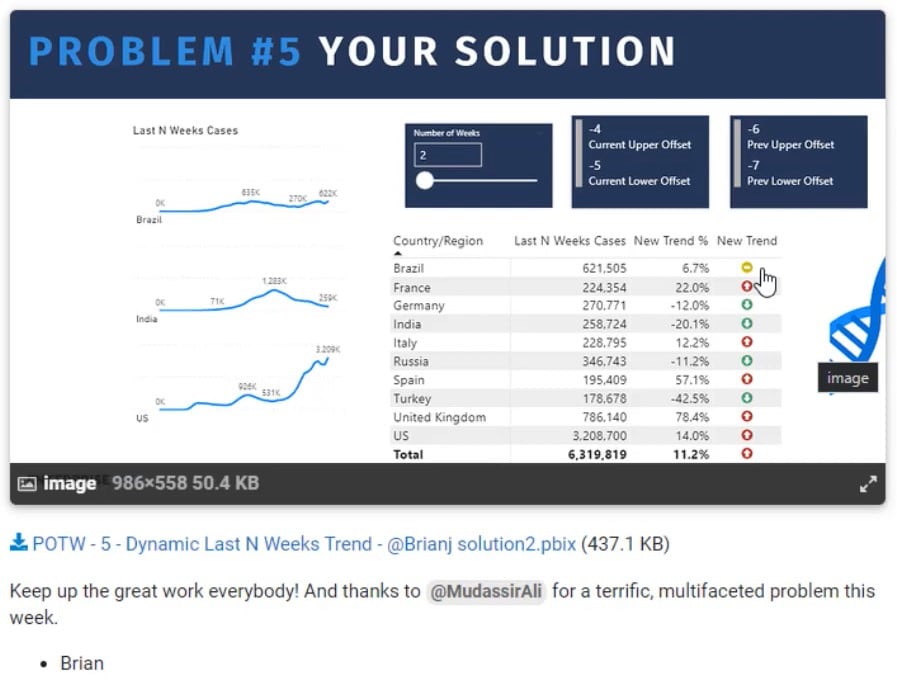
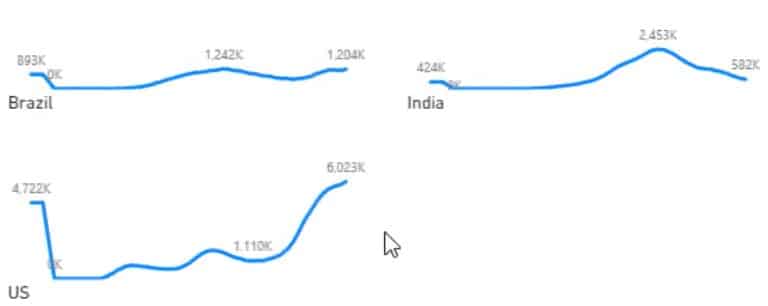
Enterprise DNA Expert Brian Julius also posted his solution where you can see the trend of the data.
COVID-19 Data Table
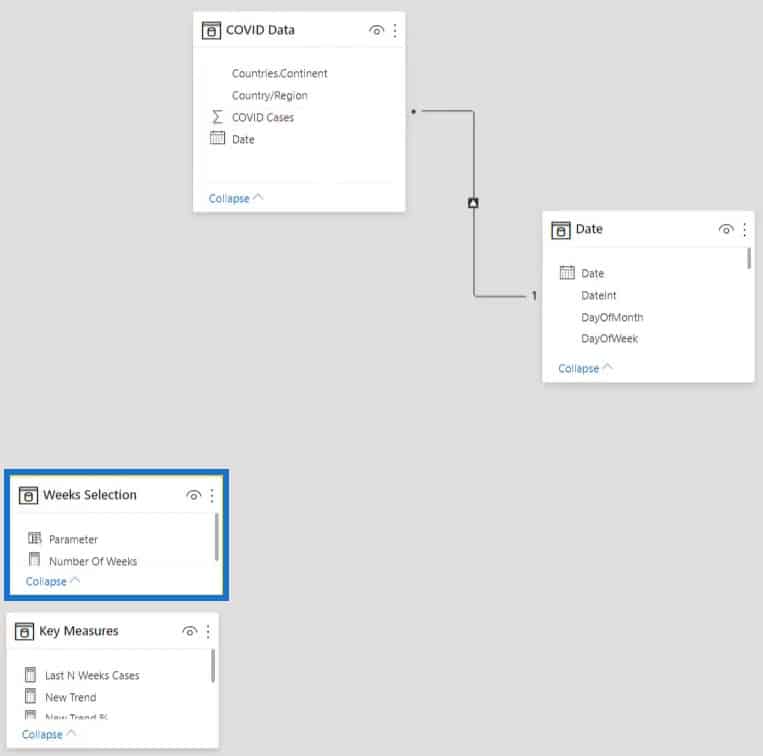
This is the dataset provided in the Enterprise DNA Forum containing the number of COVID-19 cases from the 1st until the 11th of January 2021.
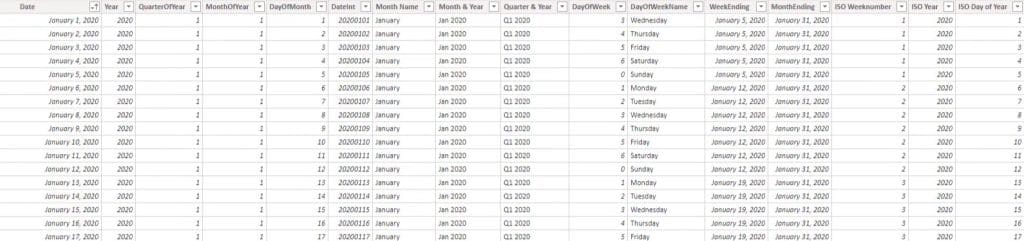
However, you can see that the Date table goes up until the 31st of December 2021. To fix that, make use of the WeekOffset which is present in the Date table.

You can see that January 1, 2020 has the least number of WeekOffset while December 31, 2021 has the highest. From the given data, you need to calculate the last N weeks trend excluding the current week.
The current week is January 11, 2021 and it has a WeekOffset of -3. So, you need to get the number of cases before that WeekOffset or before the week of January 11.
Week Offset Upper Limit Measure
The problem above indicates that you need to get the data from -4 until the mentioned criteria in the report. For the first requirement, set up the maximum date limit. Use the MAX function to get the maximum date of the COVID-19 cases in the dataset.
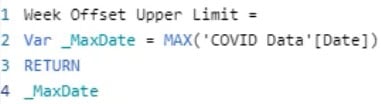
If you put the measure in a card visualization. You’ll see that the maximum date is January 11, 2021.

Since the current week is excluded you need to add more code to the measure. Input the CALCULATE function and set its arguments.
For the first argument, subtract 1 from the maximum date. For the second argument, write a condition that the Date from the Date table should be less than or equal to the maximum date. If the condition is met, the MAX function will subtract 1 from the WeekOffset number of January 11.
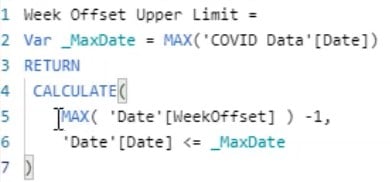
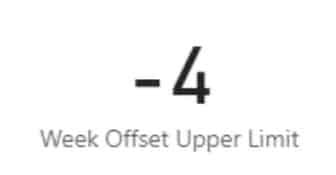
If you put the measure in a card visualization, you’ll see that the Week Offset Upper Limit is -4.
Last N Weeks Cases Measure With DAX TOPN
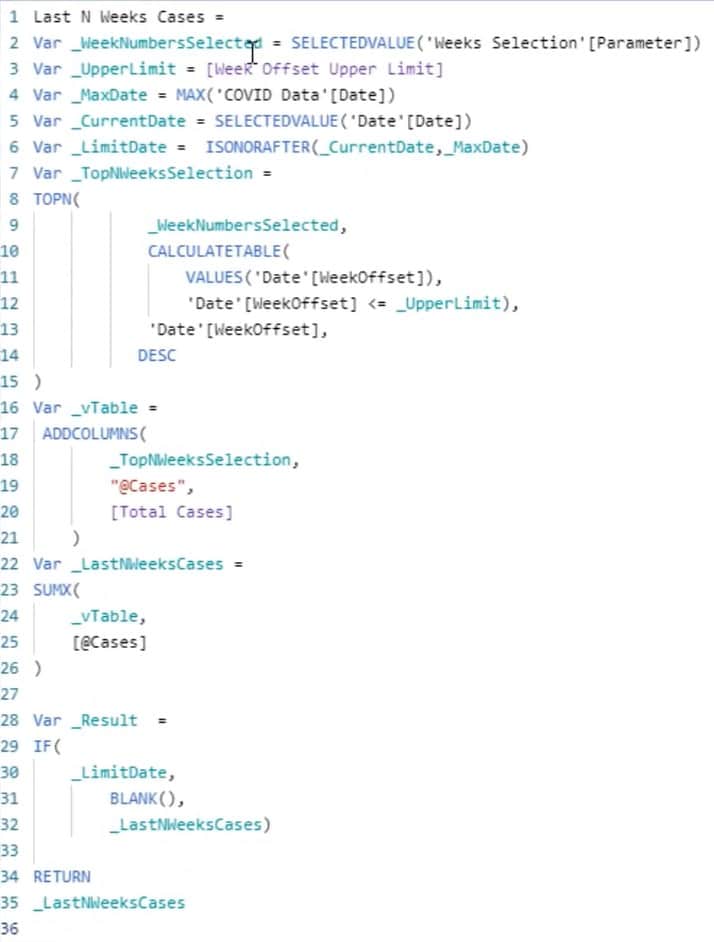
The next thing to do is calculate the Last N Weeks Cases. The cases should be dynamic according to the week selection in the parameter box. This is the Last N Weeks Cases measure.
Variables Inside The Measure
First, create the variables. The first variable in the measure is _WeekNumbersSelected. It uses the SELECTEDVALUE function to select the Weeks Selection Parameter that’s created using a What-If Parameter. The main reason for using the function is that there are no relationships connected with the Weeks Selection table in the data model.
The next variable, _UpperLimit, is simply the Week Offset Upper Limit. The _MaxDate variable is the maximum date in the COVID Date table. Next, the _CurrentDate variable is the selected value from the Date column of the Date table.
DAX TOPN And CALCULATETABLE Functions
Then, limit the week offsets by using the CALCULATETABLE function. To best explain the rest of the codes in the measure, DAX Studio is used because it’s best in creating virtual tables.
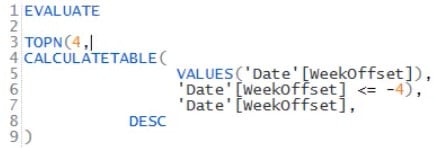
If you copy the CALCULATETABLE syntax, paste it in DAX Studio and change the last condition to -4.
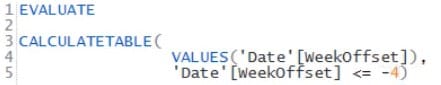
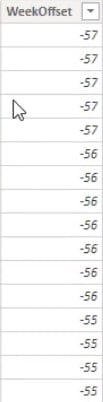
You’ll see that the results will give you the week offsets from -57 to -4.
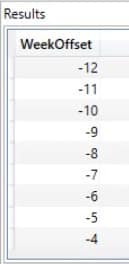
From there, calculate the N weeks offset by using the TOPN function. Next, set the Date WeekOffset order to descending. If you want to go back four weeks prior, input 4 after the TOPN function and run the code.
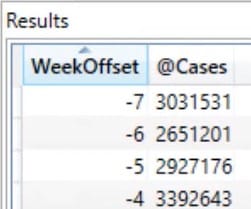
You’ll then see the week offset going from -4 to -7.

ADDCOLUMNS Function Over DAX TOPN
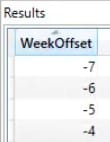
To show the number of cases for those weeks, use the ADDCOLUMNS function. Next, create a virtual table named @Cases for the number of cases and bring the Total Cases as a virtual column.
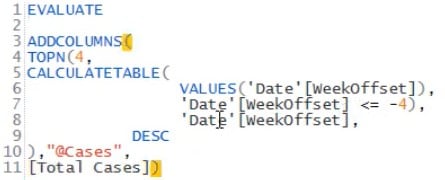
After you run the code, you’ll see the number of cases beside each week in the results.
After that, get the sum of the cases’ results using the SUMX function. The function iterates all week offset found in the virtual table and sums all the number of cases.
The next variable is the _LastNWeeksCases. It dynamically shows the last number of cases. If you go to the data report and select a week in the slicer, you’ll see that the data inside the table changes based on the week-selection slicer.
Weeks Before Last N Weeks Cases Measure With DAX TOPN
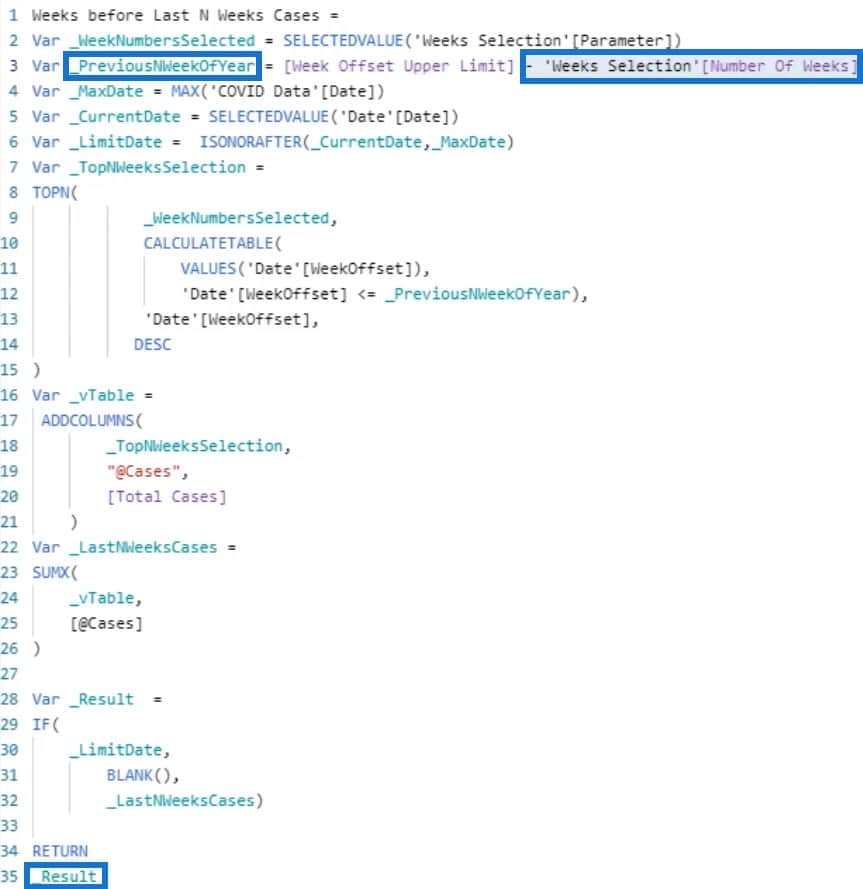
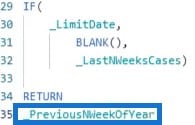
The next step is to calculate Weeks Before Last N Weeks Cases. Create a measure and copy the Last N Weeks Cases measure. Then, change the _UpperLimit variable name with _PreviousNWeekOfYear and subtract the Week Offset Upper Limit with Weeks Selection Number Of Weeks. Lastly, input _Result in the RETURN function.
New Trend Percentage Measure
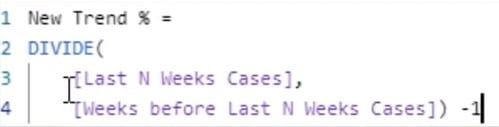
After that, you need to calculate the trend percentage and the new trend. This is the New Trend % measure. It uses the DIVIDE function to divide the Last N Weeks Cases to the Weeks Before Last N Weeks Cases. The measure then subtracts the quotient with 1.
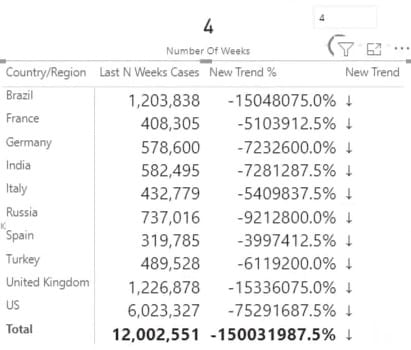
You’ll then see the trend percentage in the table.
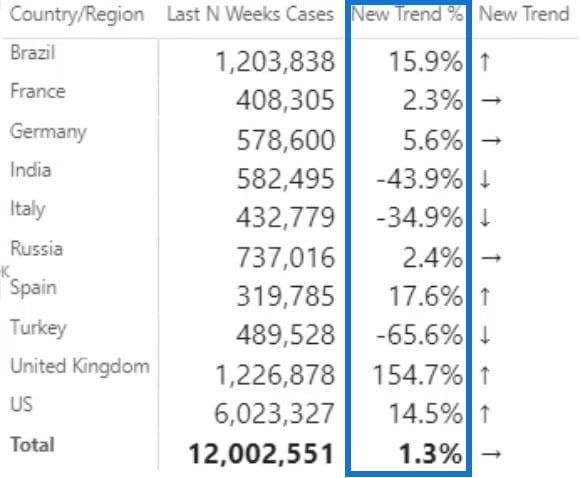
The next requirement is to show the trend using arrows. This is the New Trend measure, which uses the IF function.
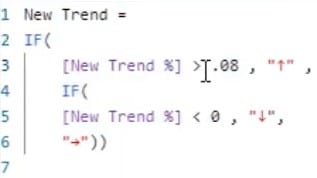
So if the new trend percentage is greater than 8%, an arrow up will show indicating that the number of COVID-19 cases is rising. If the percentage is less than 0, an arrow down will appear indicating a drop in the cases. But if the percentage is between 0% and 8%, an arrow right will appear indicating that the cases are stable.
If you want to see what’s happening with the Weeks Before Last N Weeks Cases measure, input _PreviousNWeekOfYear in the RETURN function.
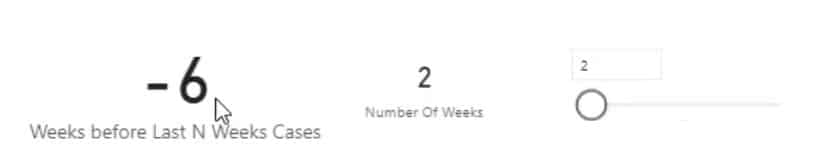
Then, create a card visualization and place the measure. You’ll then see -8 in the card visual. The value on the card changes depending on the week-selection slicer. Since the selection is 4, the value in the card is -8.
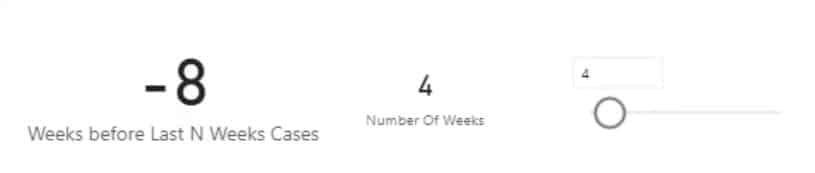
If you select 2 in the slicer, the card will show -6.
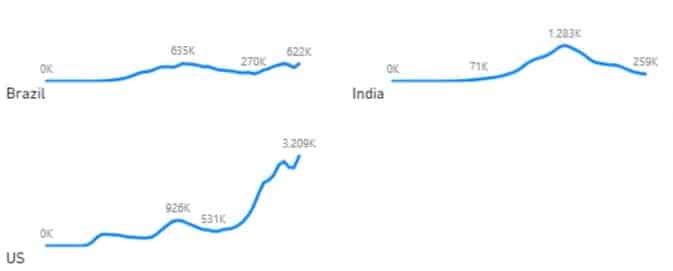
Small Multiple Visualizations Feature
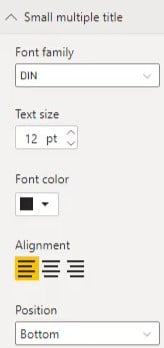
Another requirement of the problem is to show the results using small multiple visual features where you can add, position, and align multiple titles.
However, even after getting correct results in the table visuals, there’s a problem with the small multiple visual. If you bring Date from the Date table to the Tooltips section of the visualization, you’ll see that the visual will show dates beyond January 11, 2021.
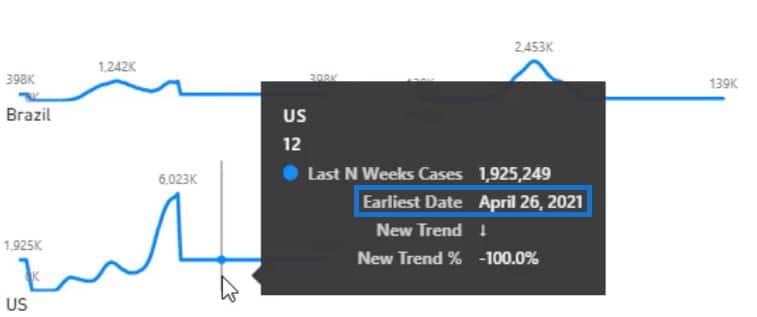
The _LimitDate variable in the Last N Weeks Cases measure was created for this problem. It uses the ISONORAFTER function to get the results on or after January 11, 2021.

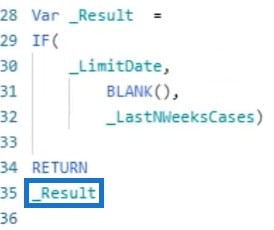
The variable was then used in the _Result variable inside an IF function condition.
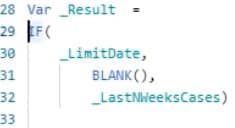
So if the date is on or after January 11, the results will yield blank. Otherwise, the Last N Weeks Cases will be provided. If you input the _Result variable after RETURN, you’ll see that the visualization is fixed.
Filters Pane Option
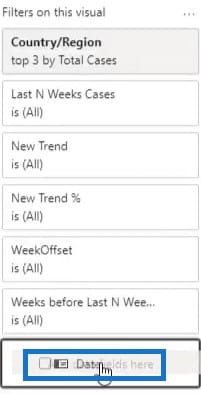
Another way of fixing the issue is to go to the Filters pane and bring Date from the Date table to the Filter On This Visual field.
Set the Filter type to Advanced Filtering and the Show items when the value section to is on or before. Lastly, set the date to January 11, 2021 and click Apply filter.
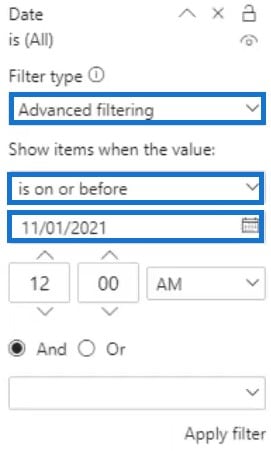
After that, the problem with the visualization will be solved.

***** Related Links *****
TOPN DAX To Showcase Top Customers This Period Vs Last Period
When To Use TOPN In Power BI – A DAX Formula Review
Showing The Last Three Customer Sales Using The TOPN Function
Conclusion
Accomplishing the tasks for this particular Problem Of The Week is possible with the use of DAX functions and visualizations. You can also use DAX Studio to create virtual tables and study their results before you use DAX functions like TOPN in your Power BI measures. Practice and study DAX to improve your data development skills.
All the best!
Mudassir


