The Performance Analyzer feature is now available in the Power BI desktop and that’s what I’m going to show you in this tutorial. Using the Performance Analyzer, you can find out how your report elements, such as visuals and DAX formulas, are performing. You may watch the full video of this tutorial at the bottom of this blog.

After running the analysis, you can interpret the results provided by the Performance Analyzer in Power BI. The results will help you find out the bottlenecks in your slow reports.
The Performance Analyzer feature is the perfect tool to use if you have slow models. The feature is particularly useful when you’re trying to optimize your model. This way, you find out where the hang-ups are occurring and find out why it’s taking so long for things to calculate. It could be because of too many visuals, too many colors, or too many formulas. It could also be because of some DAX formulas that are not calculating correctly.
Overall, it’s important to know the issues so that you can figure out the plausible flaws within your report page. After that, you can make the necessary optimizations to see the changes in your Power BI performance.
Showcasing The Performance Analyzer Feature in Power BI
To get to the Performance Analyzer, click the View tab, and then tick the Performance Analyzer box.

After that, the Performance Analyzer will be visible in the right side, next to the Fields and Visualizations pane. For this tutorial, I’ll use a sample report, which is the Product Cluster Insights.

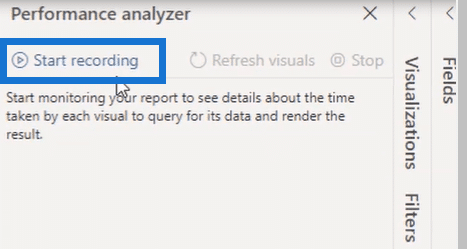
To start the performance analysis of the report page, click Start Recording.

After that, go to the report page and perform any action to figure out which part takes time to load. As you know, Power BI works very fast. I’m talking about milliseconds. Therefore, if something takes time, it only means that there’s an issue.
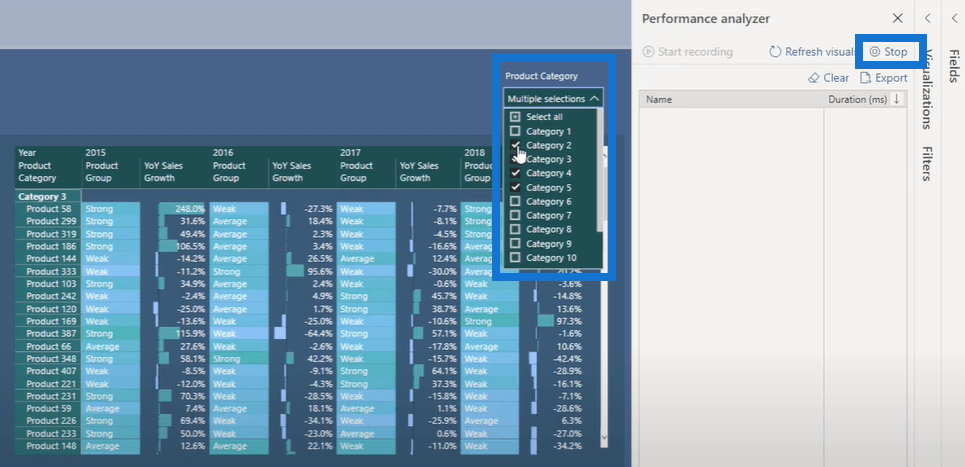
After starting the recording, go to the Product Category slicer and select an item then click Stop.

In the Performance Analyzer pane, every single element inside of the reports will be listed and analyzed. It includes every slicer, every formula, visuals, measures within the visuals, and more. For example, if you dive into the Matrix, you can see that it’s broken up into three different parts.

Based on the analysis, it took 128 milliseconds for the visuals to send the query and return data. That’s the result under DAX Query. Under Visual display, it shows the time taken by the visual to render the data based on the new selection. Based on the analysis, it took 299 milliseconds.
The data under Other is quite interesting because it can be a variety of things. It can be the time required to perform or prepare the underlying queries that go into the matrix. It could also be the time it takes to wait for other queries to update within the page. All in all, it’s just about the general background processing.
Analyzing Report Page Using Multiple Slicers
There’s another type of analysis that you can perform using the Performance Analyzer feature. It involves multiple slicer changes at the same time to further find out if there’s any issues in the report.
Before that, click Clear to run another analysis, and then click Start Recording again. This time, select multiple items from the Product Category slicer. To make additional variations, make changes to the data in the year slicer by selecting 2016.
As you can see in the Performance Analyzer pane, it records everything from the report. It’s easy to take a look at the speed and the overall register. Then, you can run another analysis and make new changes to see how the analysis also changes.

The performance analyzer feature is an incredible addition in Power BI. It’ll be great for you to start diving into this feature a little bit more.
Tips In Optimizing Your Report Page
If you just set up things in the best practice way, you can easily optimize your data tables. You can also build data models and one-to-many relationships easily. When it comes to simple DAX formulas, you can branch out into more advanced logic if needed. Honestly, you should always do these things so that you won’t have to worry about the performance of your Power BI.
But if there are issues within the reports, the Performance Analyzer in Power BI can be really helpful. Through the Performance Analyzer feature in Power BI, it’s easier to drill down into the elements of the DAX queries and visualizations. It can also help in analyzing which of the visualizations take time so you can eventually work out what’s causing the issues.
Based on my experience, the rendering of the visuals causes much of the slowness inside the Power BI reports. If there are a lot of visuals, the system is going to render a lot of information, thus the long waiting time.
Aside from that, make sure that the DAX formulas are correct. As much as you can, simplify the DAX logic especially if it involves large data sets. Most of the time, that’s what makes Power BI slow. Although it’s not really going to identify the complex formulas, it’s much better if you break out these formulas into separate measures. This way, the analysis will clearly show how each of these formulas are performing.
The performance analyzer in Power BI doesn’t actually give you the exact solution, instead it tells you where the problem is. It gives you an overview of the issues.
***** Related Links *****
Create Compelling Power BI Insights Fast For Financial Analysis
Power BI Data Visualization Tips For KPI Trends Analysis
Budgeting Performance Segmentation Using DAX In Power BI
Conclusion
Everything I discussed will help you optimize the Performance Analyzer in Power BI. I just wanted to give you an outline of this great feature and teach you how to use it. It’s pretty simple to use, but I also think that it’s just a matter of testing.
The first time you come across a really slow model, that’s the best time to jump into the Performance Analyzer so that you’ll start learning and optimize your models pretty quickly.
I suggest that you control your reports and not dwell on too many visualizations or too many colors or DAX formulas. Those are the things that you can easily optimize.
For this type of performance analysis, the lower the time is, the better. Thus, you’ll know if you have a slow model based on how high the time or numbers are in the results.
I hope you enjoy reviewing this tutorial.
Sam


