
I want to go over how you can easily do time comparisons in Power BI and specifically calculate this year versus last year. I’m going to show you a couple of techniques that you can utilize for time comparisons like this. You can watch the full video of this tutorial at the bottom of this blog.
These are some of the easiest things that you can do in Power BI. They are also some of the first examples that you should work through as you’re learning how to operate DAX effectively, especially on the Power BI desktop.
First, just let’s just do a quick recap of how you should set up your models.

This is the waterfall technique that I talk a lot about. Others call it a snowflake, but I like this concept of the waterfall and its filters flowing down.
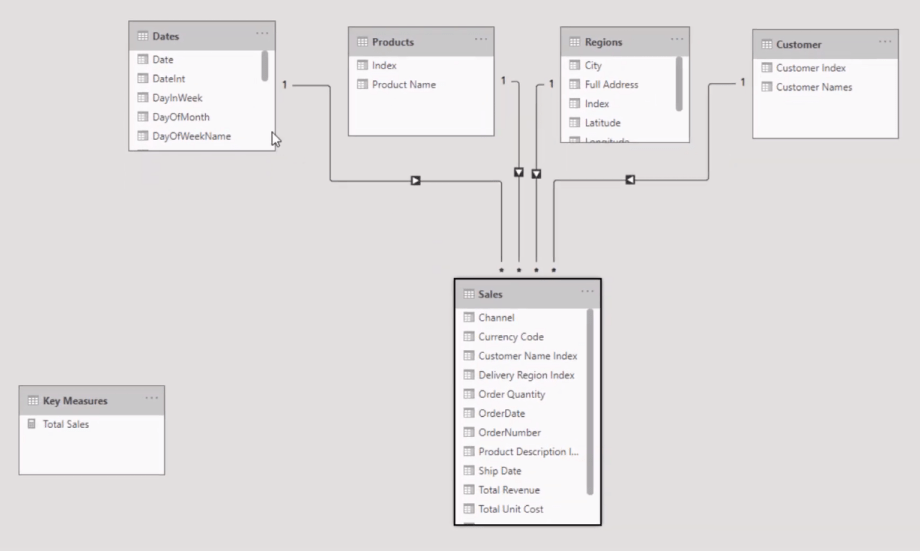
Your Date table is absolutely key here. You do not want to do time intelligence time comparisons or time comparisons without a Date table. You have to have a good Date table. If you want to learn how to set up one really effectively and quickly, definitely check out a lot of Enterprise DNA content around Date tables.
Time Comparisons Using SAMEPERIODLASTYEAR
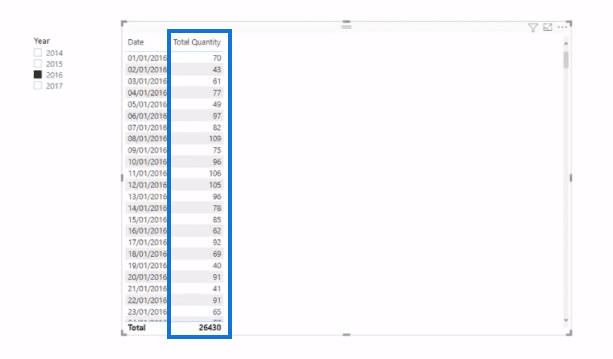
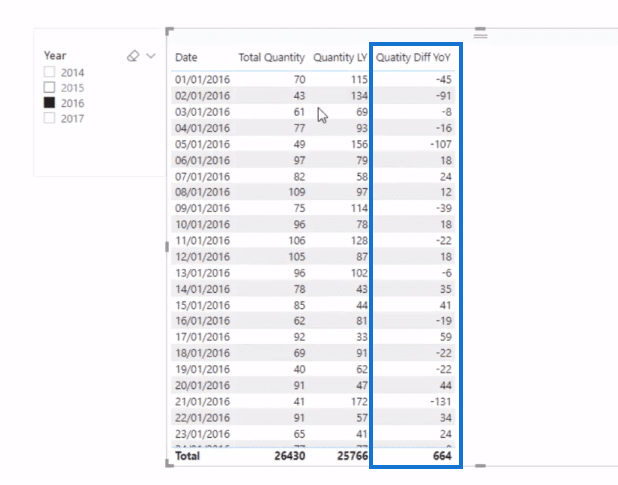
To begin with, I’m going to a table here so that we can review the numbers and I’ve got my slicer selected in 2016 here as well.
Instead of sales, I’m going to create another core measure, which is Total Quantity. I’m going to sum up the quantity column, which is in my Sales table.

I just think of this as a core measure, and then I can branch out into all of these other calculations, like time intelligence, moving averages, dynamic grouping, and other different patterns or formula combinations. It’s just reusing the patterns over and over again.
I’m going to drag my Total Quantity measure into the table so we can see the results. Now that I have this, I can quickly calculate my last year’s quantity.

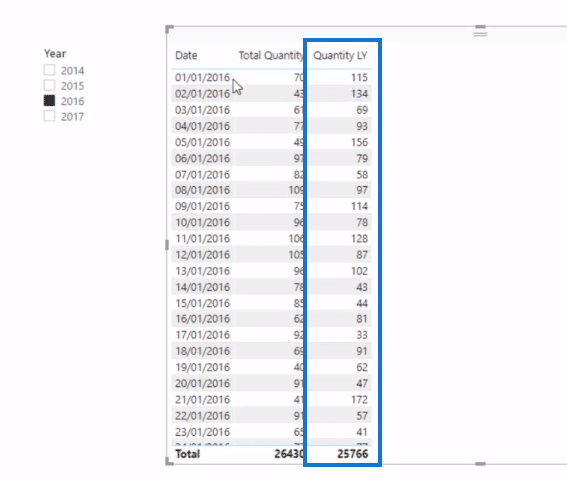
I’ll go new measure and I’m going to call this Quantity LY (last year). This is where I can use a function called CALCULATE. This is the most important function in the DAX formula language. It enables you to change the context of a calculation. In this measure, I still want to calculate that total quantity, but I want to do it in a previous timeframe.

In this first example, I’m going to show you this simple function called SAMEPERIODLASTYEAR. It does exactly what it says. It returns a set of dates and the current selection from the previous year.
So basically by putting this inside CALCULATE, I’m able to bring my quantity from one timeframe into another timeframe. And the SAMEPERIODLASTYEAR function allows me to do it exactly with one year difference. I’m going to show you a better combination to use, but I just showed you this one because I don’t want you to get too confused.
Now, I’ll drag Quantity LY and you see that we’re basically comparing the quantity sold this year on the 1st of January 2016 to what I sold last year, 1st of January 2015.
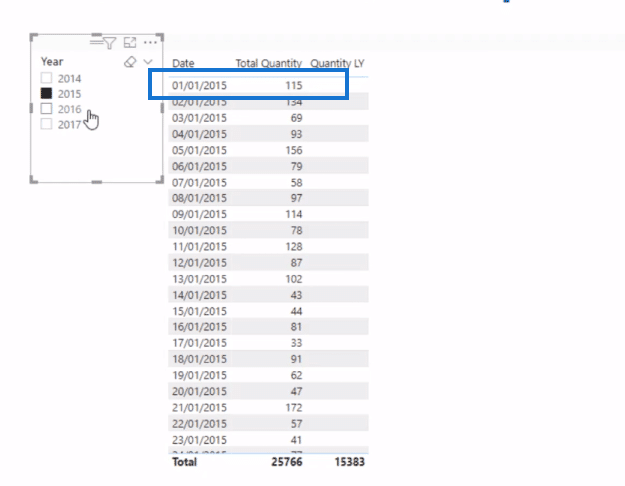
So, if I click on 2015 on the slicer, you’ll see that this first number should be 115. And from there, we can now run time comparisons.
Using Measure Branching Technique
We can actually work out the difference of this year versus last year. And so from that, I can say Quantity Diff YoY (difference year on year). And then all I need to do is subtract Quantity LY from Total Quantity. I can just reference my measures within a measure. This is called measure branching.

And now when I drag this measure in, you can see that this calculation has been dynamically generated from these two measures, Total Quantity and Quantity LY. There’s nothing hardcoded because when I click on 2017, I’m going to see the difference. There was nothing done in 2014.
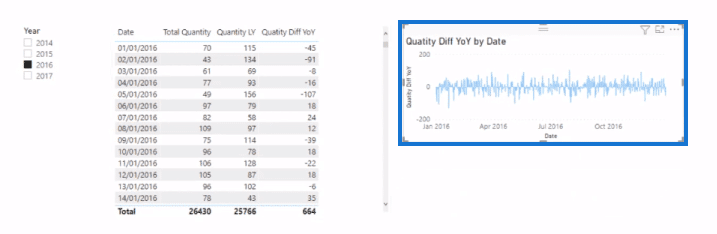
So in this data set, which is a generic old data set, I can see the difference. And we can turn that into a visualization quite easily – now I can get the quantity difference on a daily basis.
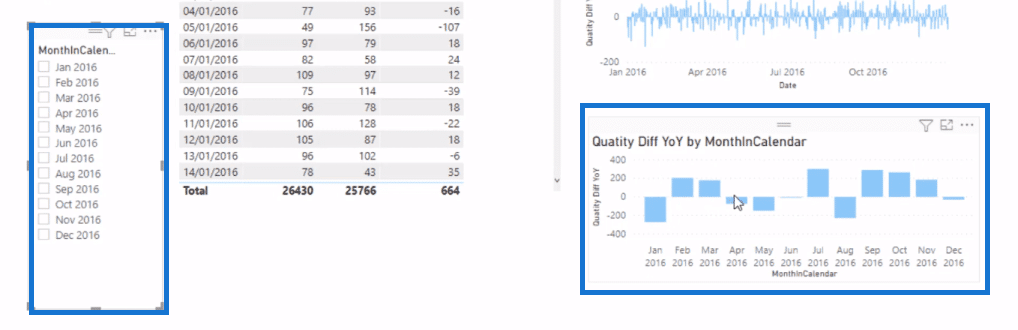
We might want to filter this down a bit more. Maybe we’ll create another slicer here that enables us to select a specific month, so we can see on a monthly basis.
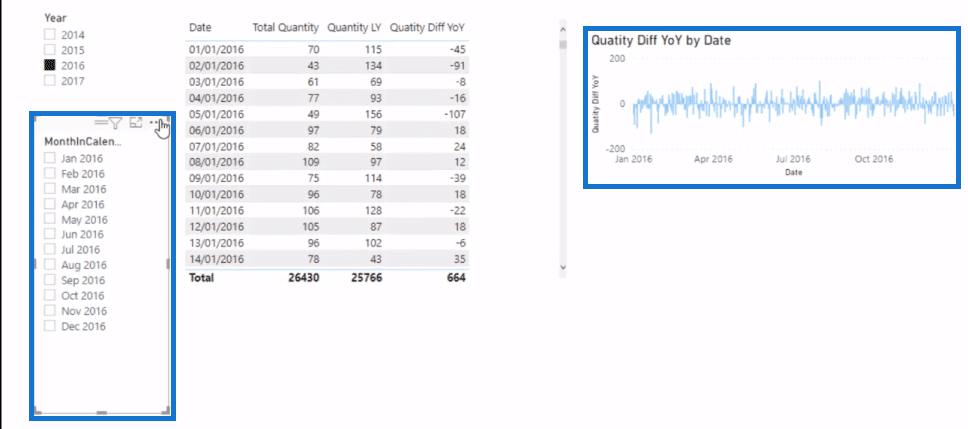
And remember, you can also change the context within here. If I wanted to not select anything there, I can actually see the monthly difference very easily without having to change any of my calculations.
Time Comparisons Using DATEADD
So now I’ve showed you how to use the SAMEPERIODLASTYEAR function. There is also a function called DATEADD, which enables you to do this as well. I prefer DATEADD because it is more versatile.
And for this, I want to jump quickly to the analyst topic case. So the Analyst Hub is Enterprise DNA’s web-based application that supports your Power BI development. Inside there is a range of different apps and I’ve already embedded my DATEADD formula pattern in here.
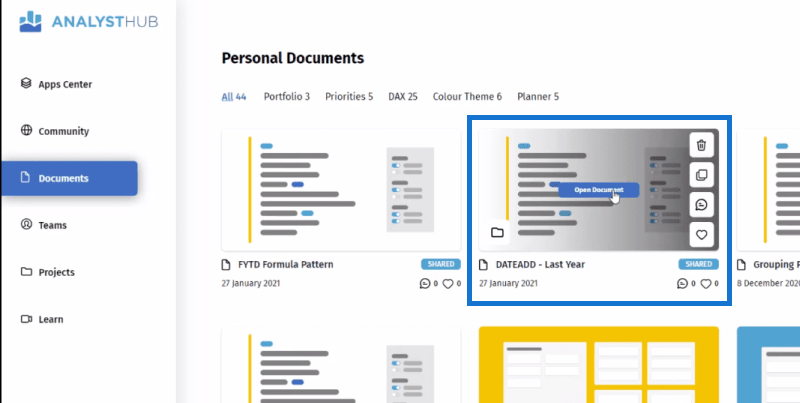
Instead of me writing it out, I’m just going to come in here, search for my formula (sales last year), and then copy it.
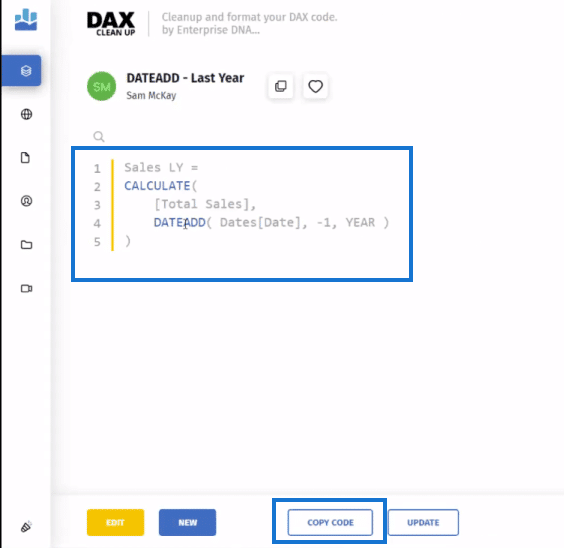
Then, I’ll bring it into my model, go new measure and create another name, as we can’t use the same. I’m going to call this Quantity Last Year. All I need to do is change the parameters here. Instead of Total Sales, I’m going to place Total Quantity.
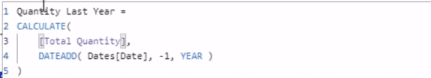
And then just like that, I have this new Quantity Last Year calculation, which is basically going to return exactly the same number.

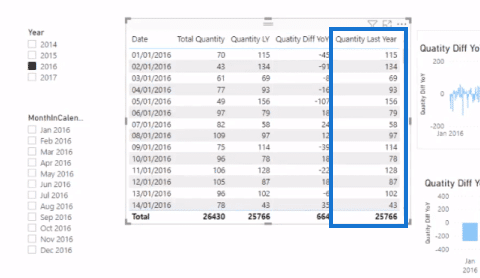
It’s going to return exactly the same number here, there is literally no difference between this calculation here and the SAMEPERIODLASTYEAR function. But the benefit of using DATEADD is the versatility.
***** Related Links *****
Time Comparison For Non Standard Date Tables In Power BI
Common Time Intelligence Patterns Used In Power BI
Comparing Any Sale Versus The Last Sale (No Time Intelligence) – Advanced DAX In Power BI
Conclusion
In this blog tutorial, I showed you a couple of ways to calculate this year versus last year. You can use the SAMEPERIODLASTYEAR, but I highly recommend the DATEADD function for time comparisons. We have a lot of content about this function on Enterprise DNA, so definitely check them out.
I also recommend that you use the Analyst Hub. You can save all your patterns there and bring them into your model.
Start using these techniques, including the waterfall model set up. These are the first things that you should be exploring within Power BI from a calculation point of view.
Once you learn how to do this, you can quickly do interesting analyses, especially with all the additional filters that you can place on your data when you build an optimized data model in the background.
Good luck with this one. All the best!
Sam


