
In this tutorial, I run through an advanced analytics technique in Power BI called Threshold Triggers. You may watch the full video of this tutorial at the bottom of this blog.
With this analytical concept in Power BI, you can set certain thresholds or certain trigger points via a supporting table in your data model.
Once you’ve added this supporting table and it’s inputs, you can then run logic through the table and over these thresholds. Then, assess whether your results are above or below any particular threshold.

For advanced analytics in Power BI, setting threshold triggers is a really powerful technique.
Threshold Triggers In Power BI
I wanted to find out if my customers reach a certain amount of sales or transactions, and if they reach a certain profit margin all together.
These insights are really unique and are quite helpful for your business decisions. You might want to reward your best customers if they have reached these thresholds, for example.
Furthermore, you want to be able to do this live on the fly, and so you can actually do that with the calculation that I’ve created.
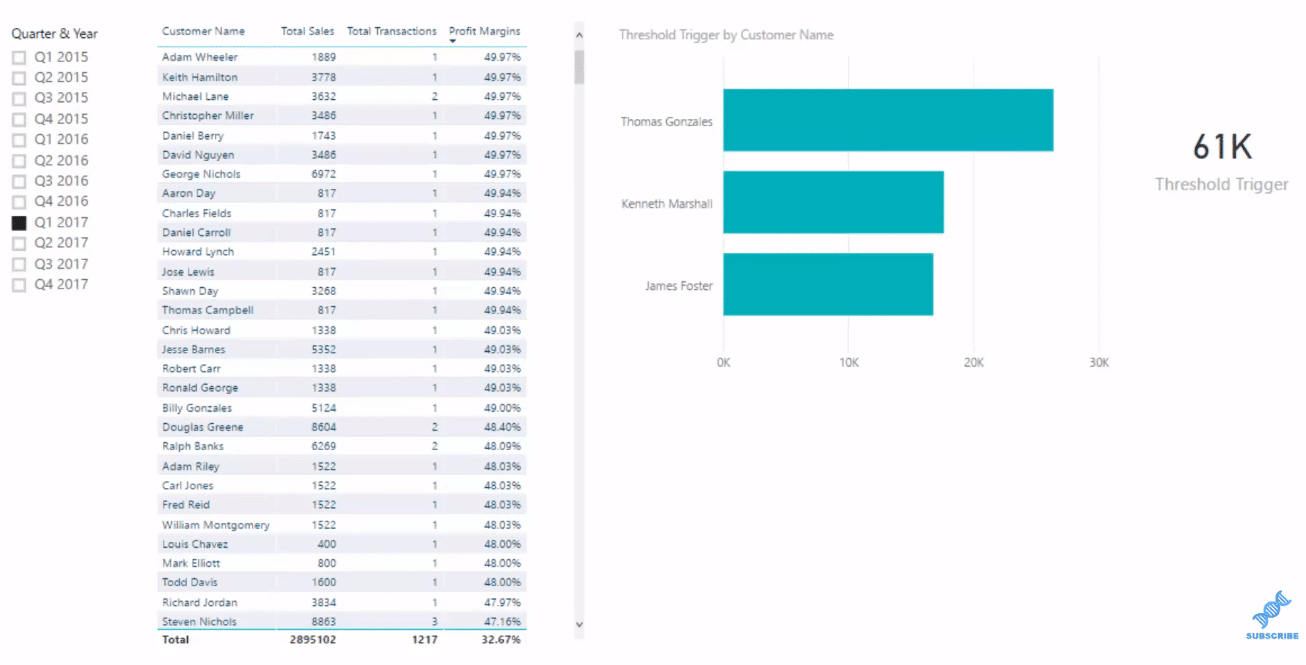
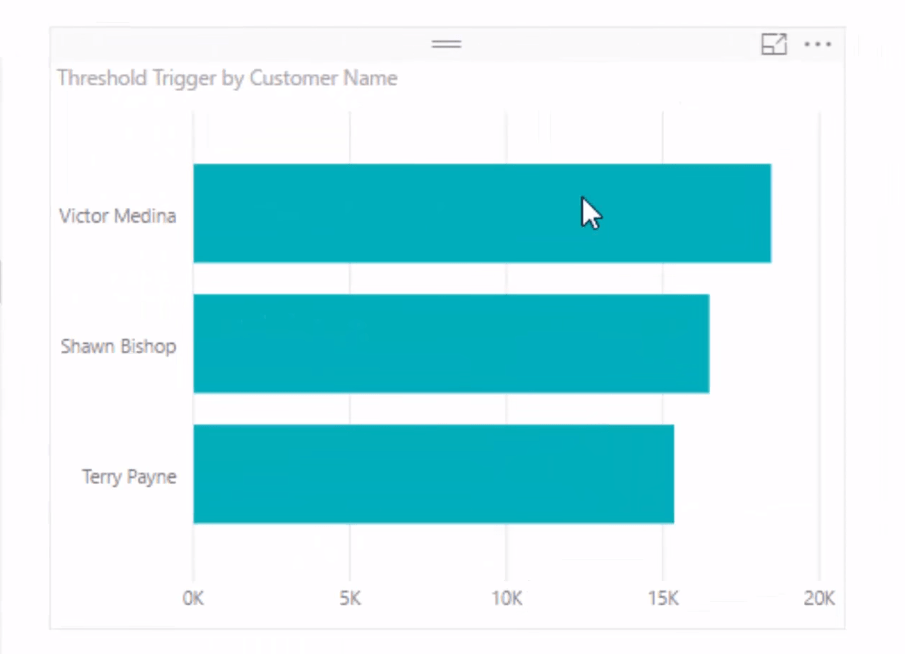
As you see in this demonstration, I can click into any quarter,
and all of these results here, these threshold triggers are being met through the logic that I implement and I’m getting an updated list of customers.

and then we could have some sort of automation off the back end and it doesn’t some marketing to these customers or we give them reward points or something like that.
This is a pretty advanced technique and I’ll show you how I did it. Then, you could apply something similar in your own models in your own environments.
Utilizing A Supporting Table
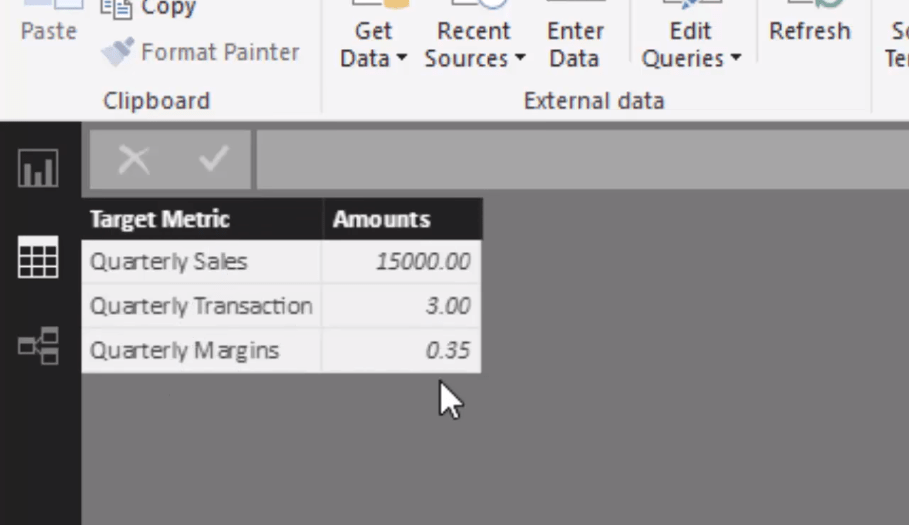
I wanted to create this in a dynamic way and so I built a supporting table, which is not related or connected to anything here.
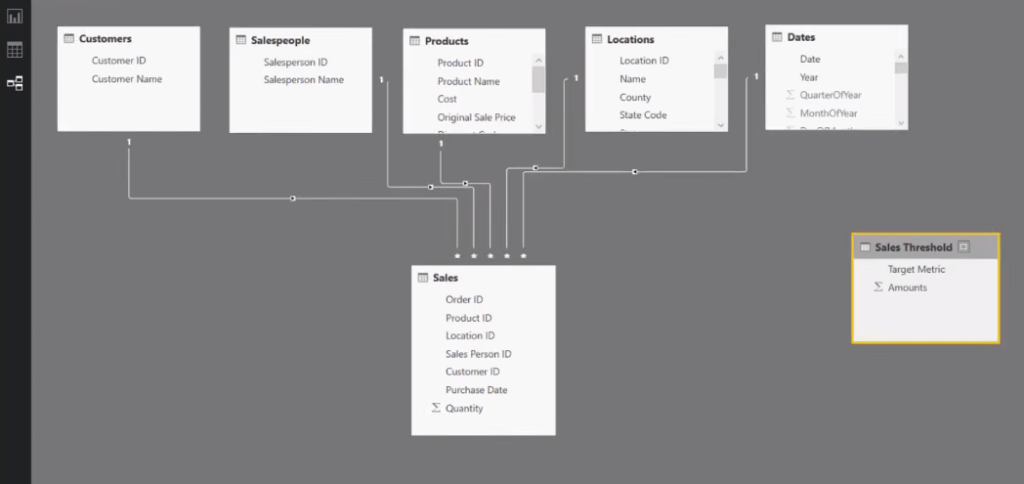
So I created this table with my target metrics with their corresponding thresholds that need to be met by the customers.
Now that I have this supporting table, I then needed to create a formula that would run through this table and evaluate each customer and the quarter. Then, it shall determine whether these customers reach these thresholds.
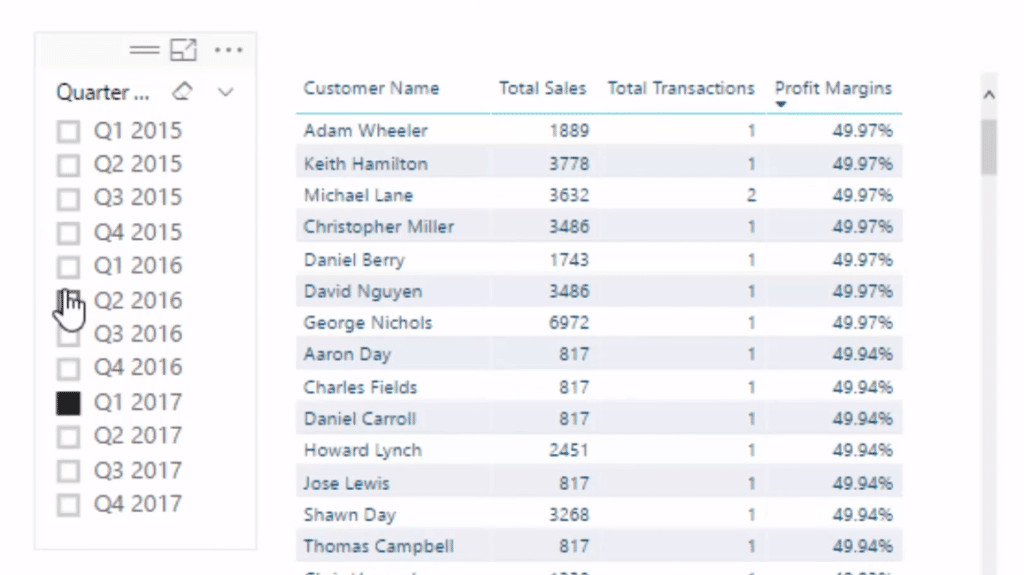
Looking at this table, we see that there are lots of customers. It’s quite difficult to just see the insights that we’re trying to get. And that’s why I came up with a formula that does it for us dynamically.
Threshold Trigger Formula
There’s a little bit to it, and so I’ll walk you through it so you’ll have a good understand on how you could apply this.

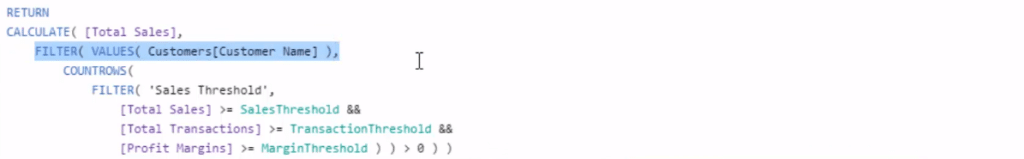
In this formula, I used these variables (VAR) for our threshold numbers. This goes in and extract that particular threshold number.
I wanted to see the Total Sales of these particular people, and so it’s the CALCULATE function doing that.
And then this logic with the FILTER function is running through all the customers, evaluating whether their total sales are greater than or equal to the sales threshold, and if their total transactions are greater than or equal to the transaction threshold, and profit margins as well.
If it passes all of those thresholds, then it evaluates to true and that customer will return Total Sales.
That’s how the logic works in there. You could just play around with it and see how you could implement this in your own environment.
***** Related Links *****
Use DAX To Segment & Group Data In Power BI
Power BI Advanced Analytics: Secondary Table Logic Techniques
Ranking Insights Using TOPN In Power BI
Conclusion
In this blog post, I walked you through all the advanced techniques you need to implement in Power BI to make this work. I covered aspects of DAX formulas, the data model, and then showed you how you can visualize the results in a really effective way.
Think deeply about some of the applications for this analysis. A really great one is for insurance and banking with credit risk scenarios, or any other risk type scenarios.

There are so many applications where you may want to check off a number of different thresholds for certain variables or certain results in your data and then try to visualize the ones that meet set overall thresholds.
They might be outliers, they might be elements in your data that you really need to showcase or you need to focus on.
All the best.
Sam
***** Learning Power BI? *****
FREE COURSE – Ultimate Beginners Guide To Power BI
FREE COURSE – Ultimate Beginners Guide To DAX
FREE – 60 Page DAX Reference Guide Download
FREE – Power BI Resources
Enterprise DNA Membership
Enterprise DNA Online
Enterprise DNA Events


