In this tutorial, you’ll learn how to use Power Query for currency conversions in Power BI. You can watch the full video of this tutorial at the bottom of this blog.
The method discussed in this blog will help you solve problems in your currency rates table using the last available rate.
You’ll understand how to work things out when the currency rates table doesn’t have a currency rate on every single day.
Identifying Missing Data
This problem can occur if the Date table doesn’t have data for holidays or weekends.
If you don’t have a rate on any day and don’t account for it, metrics like Total Sales will not be converted.
If you take a look at this currency rates table, it has rates in Euros for January 2016.

But notice that the 27th and 28th days are missing and don’t have a rate. So, if you go to the matrix, you can see that there are no rates for 27 and 28.

The Currency Rate with Missing measure is simply a sum of the Fact Currency Rates table.

The 26.6983 total in the table is meaningless. It’s just the sum of all the currency rates above it which you don’t need to add up because they are what they are under the current day.
Now, this can be fixed in Power Query because this is more of a data modelling issue which involves queries and aggregating. This can also be done with DAX, but it’s easier and faster with Power Query in Power BI.
So, click Transform Data, and then open the Power Query window.
This is the table with missing data. You can also see in this currency rates table that it contains Euros, Pounds, and Dollars.

And then this is the final table that has values on the 27th and 28th of January. This is the table or output that you should have.

Import your data from whatever source you’re getting it from and just change the data type.
Separating Different Currencies
Next, if you have more than one currency, it’s important to separate and group them by their ticker.
When you group them, make sure to group them in All Rows so that if you click Euros for example, it will only show currency rates in Euros.
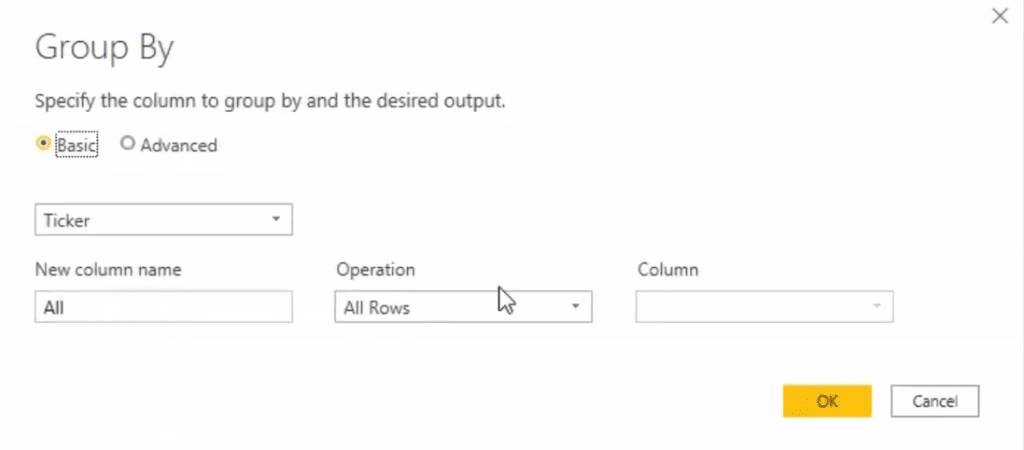
You can also see that there are missing days here as well as the pound currency.
There’s this thing called the Invoke Custom Function in Power BI. This is a function with FillMissingRates.
If you click Euro, you will see a complete table that contains the missing data which you saw in the expanded table. It’s sorted from the oldest to the newest rates.

Figure out what the custom functions are doing. If you click on the gear icon near the Invoke Custom Function, you can see the column name and the source which is pulling in the All column.

To do that, start off with a basic table. Do the transformations, get the outcome you want, and then use that to build the function. It makes more sense than trying to do it in the table where you have all the other sub tables.
For example, if you want to focus on the Euro, filter it down to the ticker.

To figure out what days are missing, merge it with your date table.
Here’s a basic filtered down currency table and DimDate table:
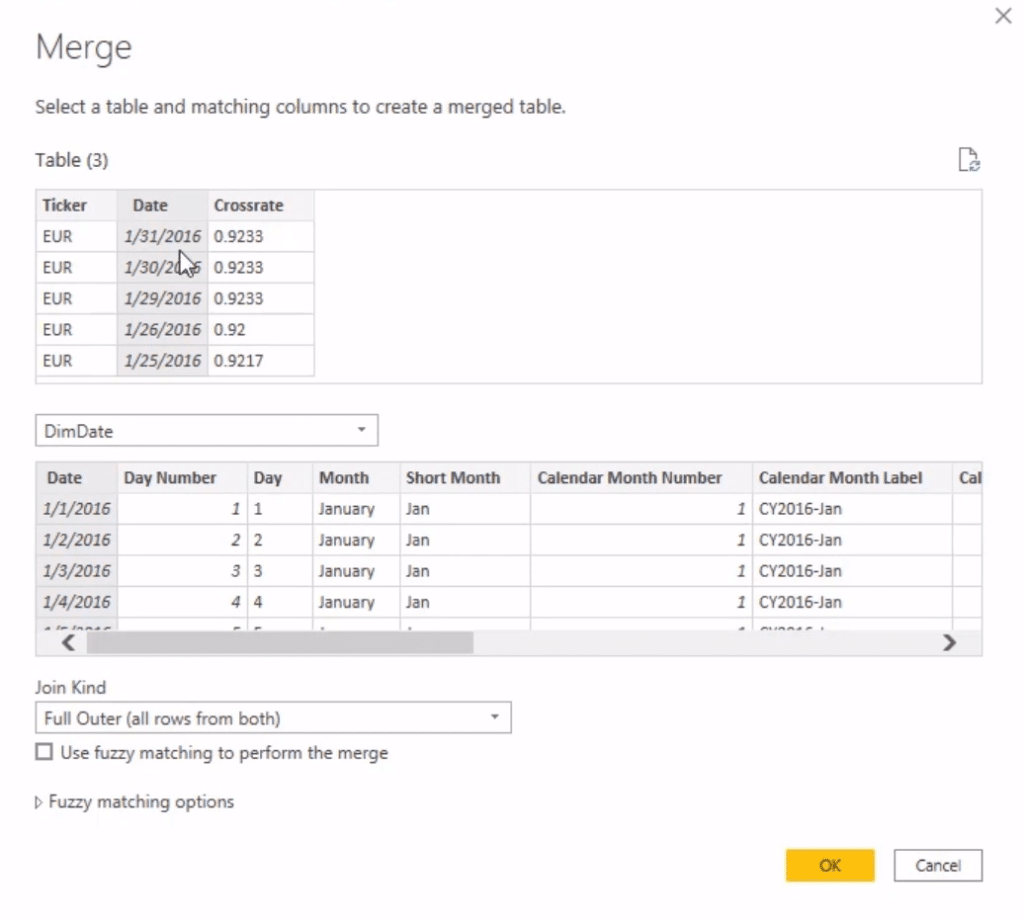
For the Join Kind, you may use Full Outer to bring in all the rows from both tables. This shows you what is missing and the rates that match.
When you merge it, it will give you a full table as a sub table.

After that, sort the rows and then expand the DimDate to only include the Date column.

Now, you can see that everything is matched up. And when you sort the rows by oldest to newest, you can also see the two missing days with null values.

Filling Missing Rates
It’s important that they’re in this order because you’re going to fill all the nulls in all columns except Date.1.
After you fill it in, you can see the null values have changed to Euro and the last available rate.

Next, remove the unnecessary columns like the Date column from the table.
Date.1 column already has the dates, so the Date column is not needed. Then, set the Crossrate to Decimal Number.
Lastly, reorder and rename the columns and make sure your data types are set.

You now have a complete currency rates table.
However, this only works for this table. You have to find a way to apply the same logic to a table where currencies are grouped.
Merging All Currencies
If you have different currencies, it’s difficult to maintain different rate tables. So, you need to merge them to make one currency table.
To start off, take your existing table and create a function by clicking Table and selecting Create Function. Next, input a function name.

After that, go to Advanced Editor. Remove the calculations that you won’t need. In this case, get rid of the source, filter, and change syntax.
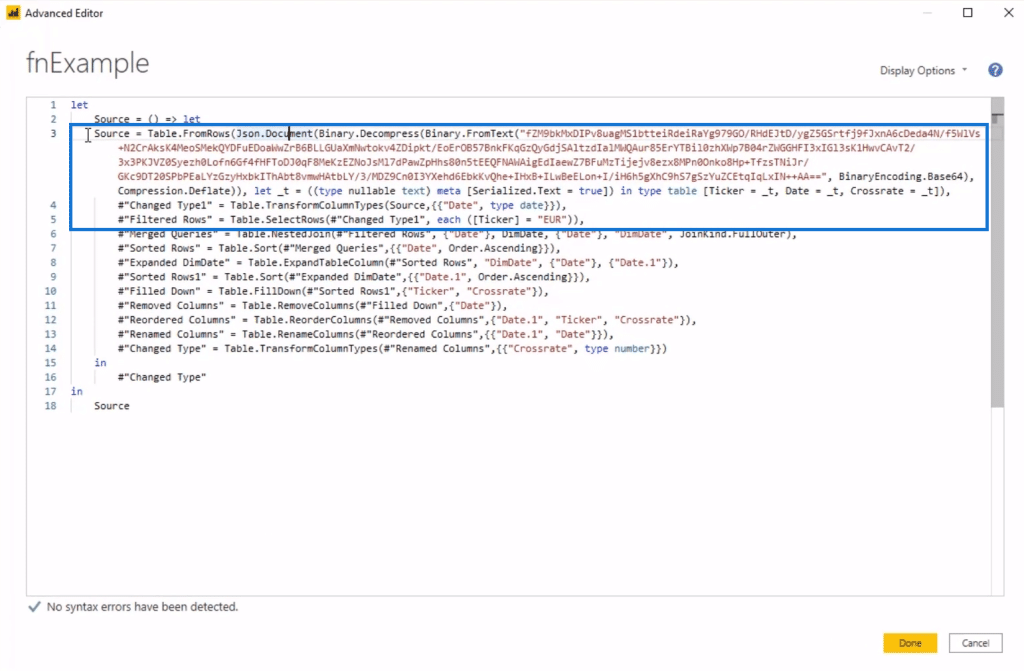
Next, name your parameter Source and then input Let. Since the Filtered Rows was removed, change the value inside the Merged Queries syntax to Source. After that, delete the Source at the end of the syntax, and then click Done.
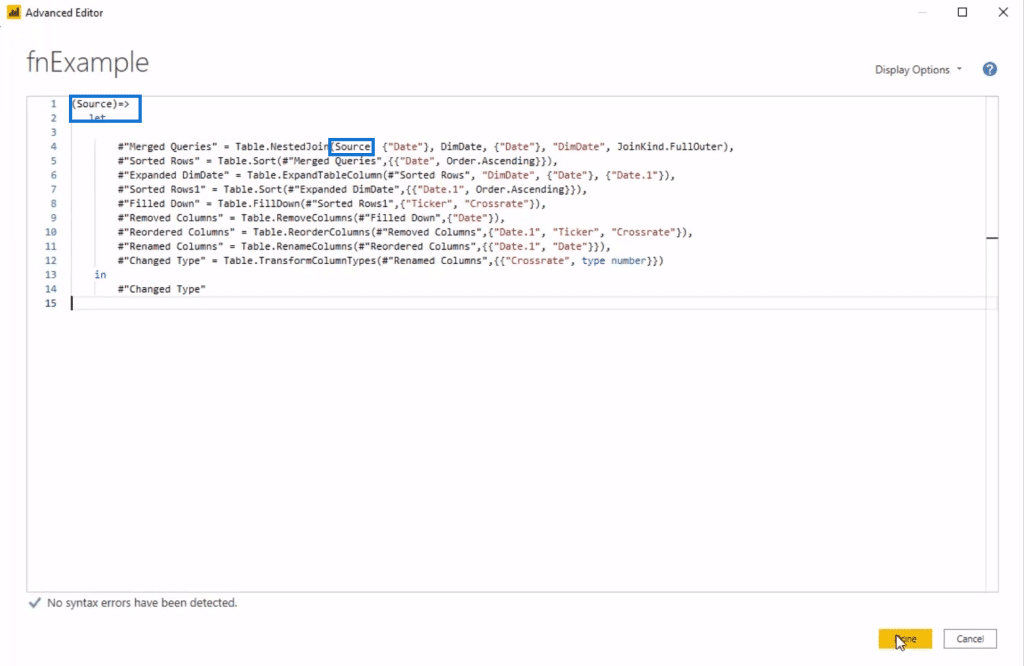
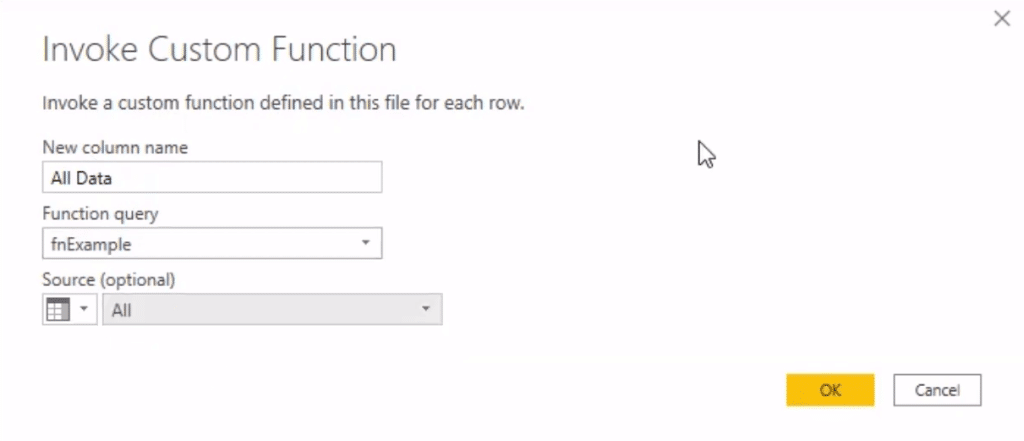
Now, go to Add Column, click Invoke Custom Function. Input a column name like All Data. For the function query, select the function that was created earlier. Choose All as the Source, and then click OK.
The next thing to do is remove all the columns except All Data. Then, expand that column and uncheck the “Use original column name as prefix” setting. After that, click OK and change the column types.
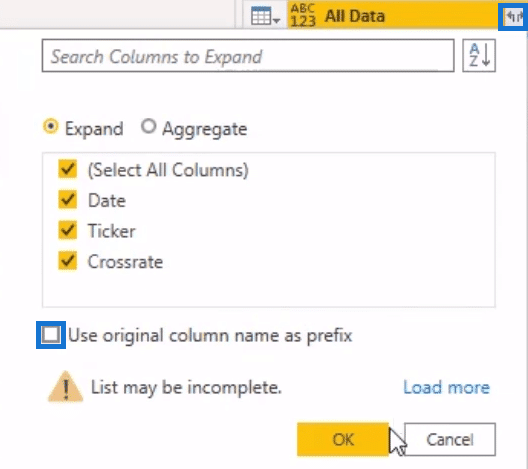
Set the Date, Ticker, and Crossrate columns’ type to Date, Text, and Decimal respectively. Once done, click Close & Apply.
You’ll now get a combined currency rate table with no missing dates and rates.
Creating Relationships In The Data Model
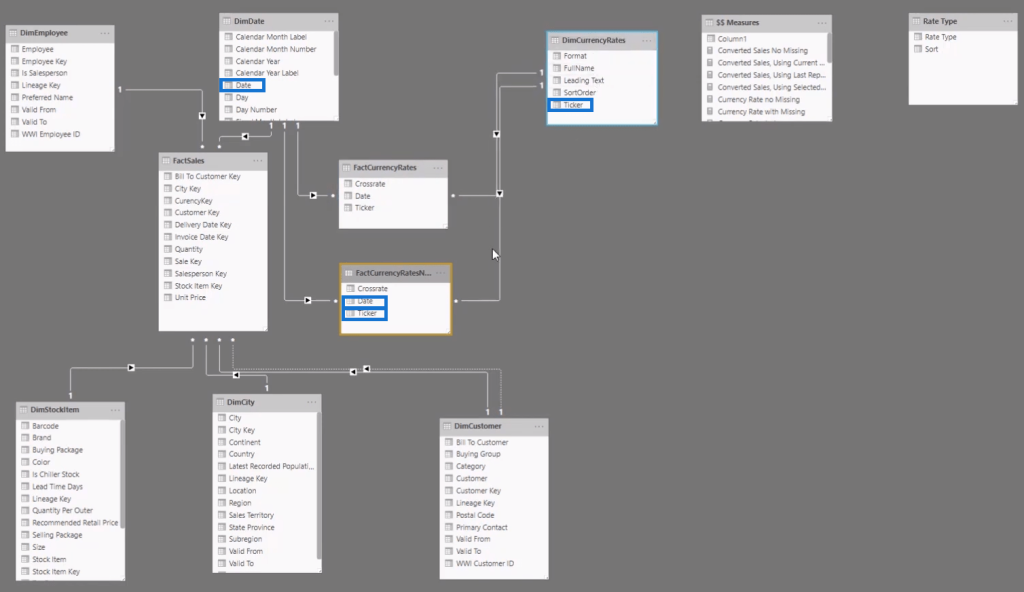
In your data model, you can see the FactCurrencyRates table. Now, create a relationship, Ticker to Ticker and Date to Date, with that table and the DimCurrencyRates and DimDate table.
In your matrix, pull in the Currency Rate No Missing to see that it now has the rates for the 27th and 28th all done in Power Query.
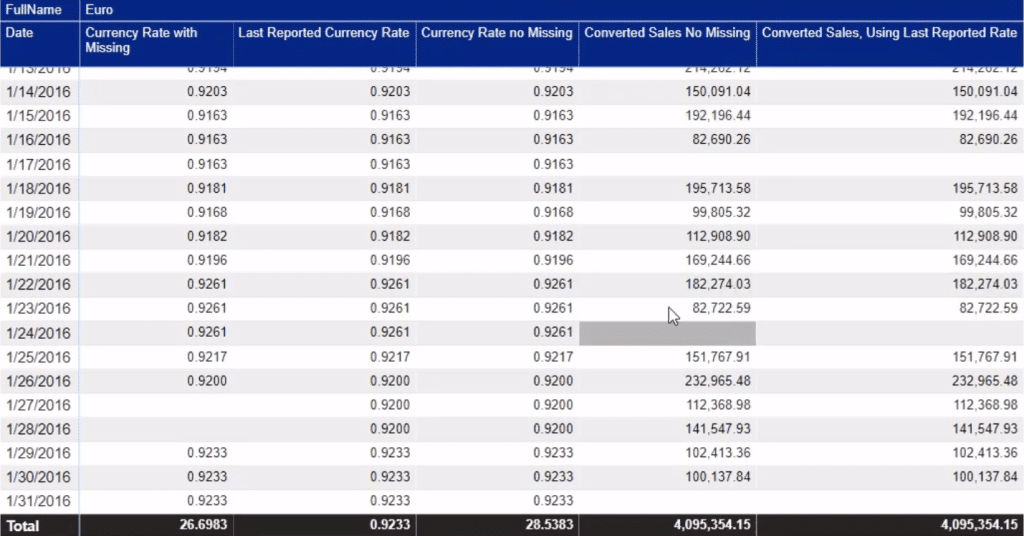
The Last Reported Currency Rate column also shows the rates of the missing days. It shows the same rates and values. But the difference between them is that this column is created in DAX.
This is the measure and syntax of that column. It’s not as simple as using just the SUM function in Power Query.

Looking at the table, you’ll see the Converted Sales No Missing column. It shows the sales that are converted using the Currency Rate No Missing column. The other column with converted sales uses the column that was made in DAX.
The function used in getting the converted sales is SUMX. If you look at the measure for that column, you can see SUMX going over the DimDate table.

Comparing DAX And Power Query Methods
You can actually compare both the converted sales columns that used DAX and Power Query in Power BI.
To do that, get rid of all columns except the converted sales columns. Then, fire up the performance analyser, and click Start Recording.

Next, open up DAX Studio. It’s an application that shows you how and why things are working in your model. After that, copy the query of your matrix and paste it inside the studio.
For the comparison, turn one of them into a comment first so that it won’t interfere with the other column that’s being tested.
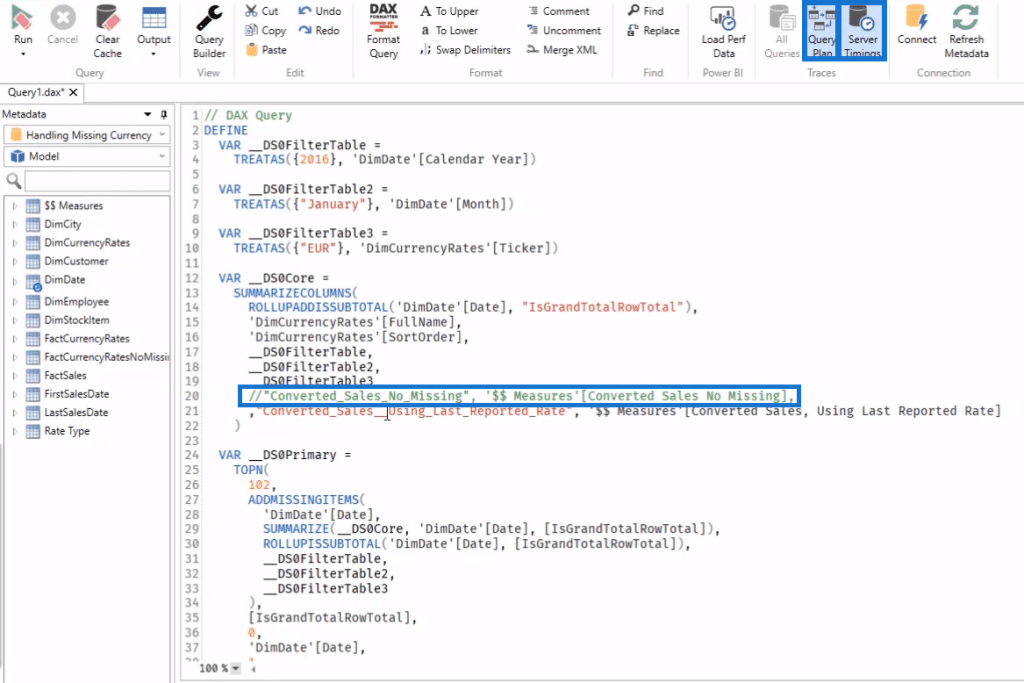
And then, load the Server Timings and Query Plan. Since you’re comparing performances, clear the cache first before running the comparison.
After running the test, you can see that the column that used DAX got plenty of scans and has a total time of 71 milliseconds.

Now, run the other column that used Power query. But first, turn the other column in the syntax into a comment.
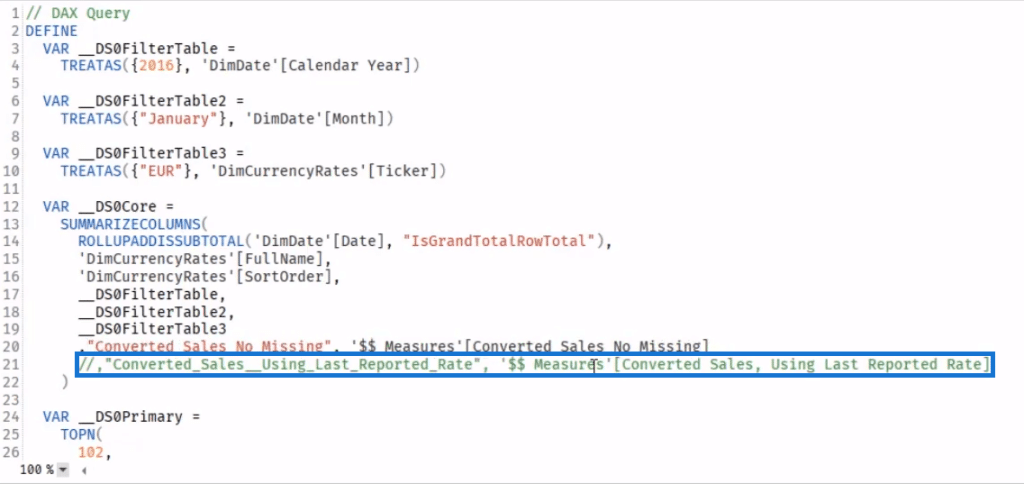
You can see that the column only ran for 25 milliseconds and has only 7 scans.

You can clearly see which performs faster and better between the DAX and Power Query methods.
***** Related Links *****
Iterating Functions In DAX Language – A Detailed Example
Using Variables In Power BI – A Detailed Example
How To Work With Multiple Dates In Power BI
Conclusion
An advantage of using the Power Query method in Power BI is that the data is already stored. So, the measure can find the rate and then bring it out using simple functions.
Another thing about this method is that it doesn’t slow down if the calculation gets complex.
However, this only works if the data you’re asking for doesn’t have to be converted on the fly. If it does, you have to use DAX.
All the best,
Nick


