
This tutorial will go over some of the best practices with regard to visualization techniques that can be used to create compelling reports in Power BI. You may watch the full video of this tutorial at the bottom of this blog.


Users who use Power BI to run analyses and insights aren’t always creatively inclined. It can be a challenge for some to decide how to customize and present their information.
It’s important to make reports appealing because they help improve customer retention. Consumers appreciate and easily understand information that’s presented clearly.

Creating Drafts Through Whiteboard
The first tip is to make a rough sketch before starting with the actual design in Power BI.
Microsoft Whiteboard is a great tool to use when you want to create rough drafts because of its many features compared to using pen and paper.
Here’s an example:

With this rough sketch, I have a clear visual on what information should be placed for every grid. I can show moving average on the first grid, and then a cumulative total beside it.
I can make the lines straighter, move the drawing, and add notes. These are a few of Microsoft Whiteboard’s many useful features.
Furthermore, I can continue editing until I’ve decided that the report looks good.

Whiteboard is an effective tool to have a good overview on the layout of reports before they’re placed in Power BI.
Using Shapes To Create Grids
The key takeaway for this tutorial are grids. Grids make it easier to decide where relevant values should be located in reports.
Grids can be created using shapes in Power BI. Here’s how to do it:
Go to the Insert tab and make a selection under the Shapes option.

For this example, I used a rectangle shape to make the grids.
There are two methods to use when using grids in Power BI. The first method is to draw the desired shape first and place the visualization on that shape.
The second method is to create all the visualizations and place them in their designated locations in the dashboard. Then, put the rectangle shape or grid on top of each visualization and use the Send to back option under the Format tab.

Make sure to turn the background off so that the charts will have the same color as the grid.
The color theme of the report can be decided through experimentation to identify what matches and what is pleasing to look at.
Other Visualization Techniques
Here are additional techniques to use when creating compelling reports in Power BI:
1. Using The Built-In Color Themes
There are built-in color themes in Power BI containing a range of different color combinations.
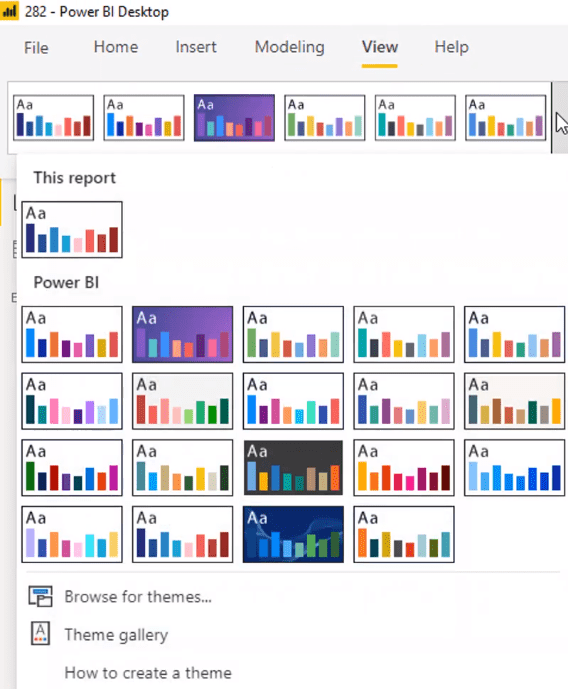
Previous versions of Power BI didn’t have this feature so users had to manually customize each element in their reports.
With the latest Power BI versions, it’s now unnecessary to individually color each element. Using the built-in color themes makes it easier to create designs for reports.
2. Adding Icons
Power BI has also improved their available icons:
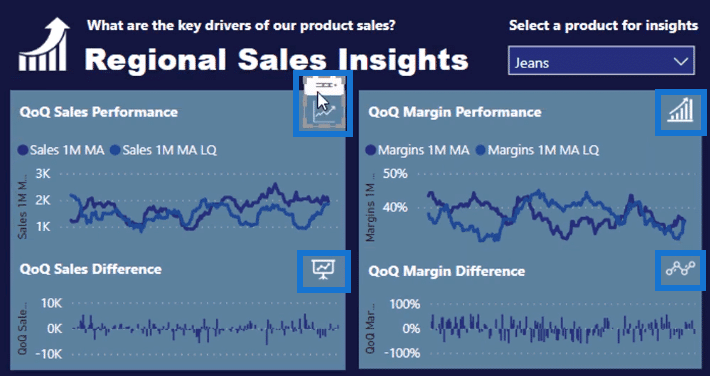
Icons give value to the look and feel of charts and other visualizations. They add a professional touch to report pages.

A website called Flaticon can also be a source for icons to use in Power BI reports.
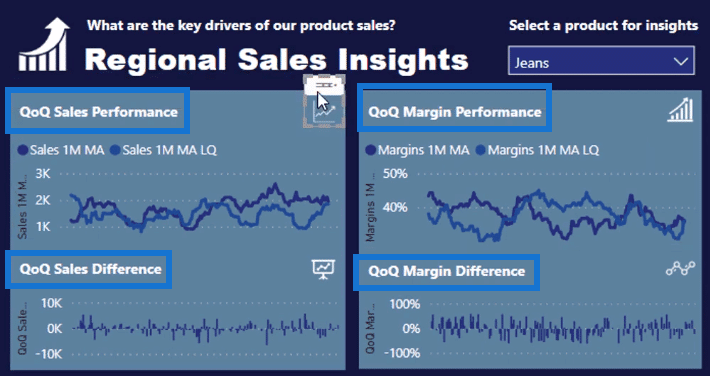
3. Placing Titles For Each Visualization
Placing titles on charts and other visualizations gives distinction. They make reports easier to understand.
4. Showing Trends
Another visualization technique is showing data trends up to the granular level of detail.
Moving averages are great measures to use when showing trends in Power BI.
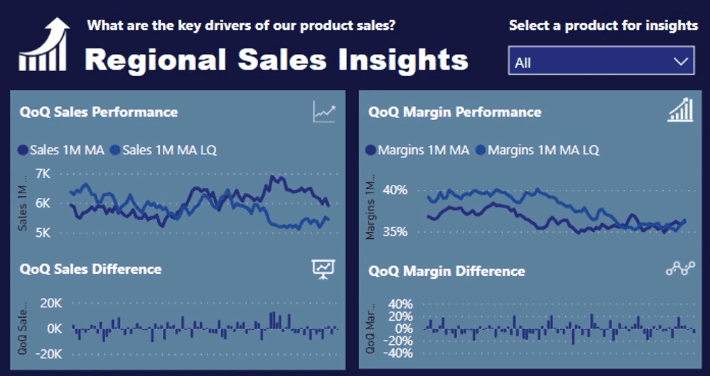
For this example, I overlaid the moving average to show comparisons between quarters.
Consumers appreciate charts that show trends because they are easier to comprehend.
***** Related Links *****
Power BI Reporting Templates Expanded – Power BI Visualization Concepts
Power BI Data Visualization Tips For KPI Trends Analysis
Power BI Visualization Technique: Learn How To Create Background Design Plates
Conclusion
This tutorial outlined some of the different options you can use when customizing and designing reports in Power BI. Using the correct visualization techniques in your reports can have a big impact on consumer experience.
There are many visualization techniques in the Power BI Showcase page in Enterprise DNA Online. These are great resources to get ideas from a visualization perspective.
There are a number of Showcases from Enterprise DNA that discuss how grids can be used in reports to create compelling visualizations and add distinction to headings. These resources can be downloaded from the Enterprise DNA website.
All the best,
Sam


