
Recently, I built and showed a Budgeting Analysis Dashboard in one of Enterprise DNA’s workshop. One feature of that Dashboard is the Cumulative Budget view. The webinar is linked here. You may watch the full video of this tutorial at the bottom of this blog.
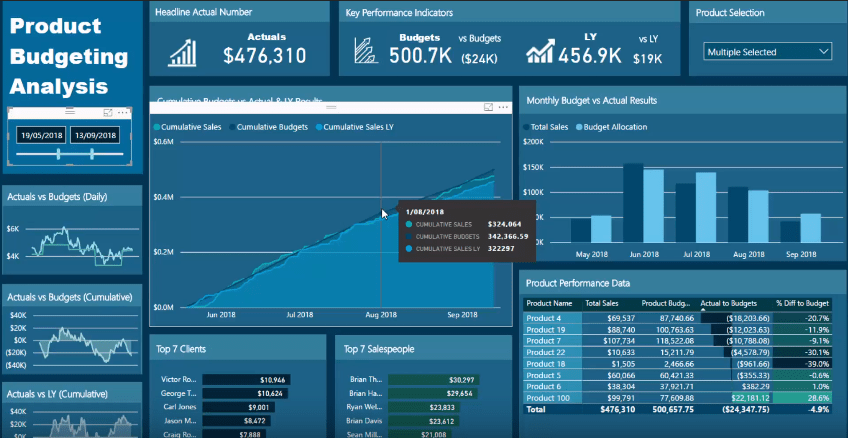
The dashboard itself is dynamic so I can change the time frame and select the products I want to track. This makes exploring the data extremely efficient if you’re comparing it against a benchmark.

In this tutorial, I’m going to show you how to set up cumulative budgets using DAX. This is one of the more advanced topics of Power BI. It also yields an amazing output for your analysis.

There was a seasonality aspect on my budget data and I needed to display it cumulatively. The visualization I created compares the BUDGET against SALES and SALES LAST YEAR. The dark blue line represents BUDGET and gives a good direction how the performance is against SALES.
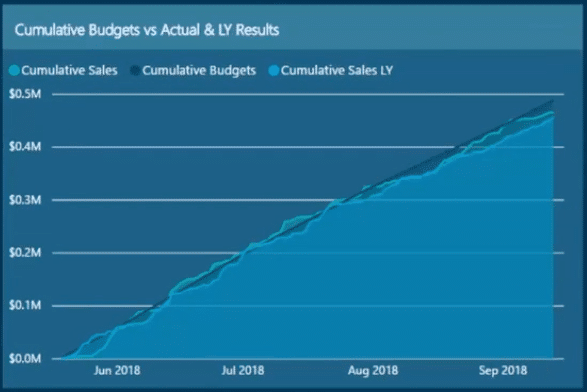
In my view, using cumulative totals is the best way to evaluate trends. How your actual results compare versus your budget is ultimately what we want to look at.
Setting up the Cumulative Totals
We will discuss setting up cumulative totals in detail for this tutorial. We will discuss the formula and technique I used to do it for this dashboard.
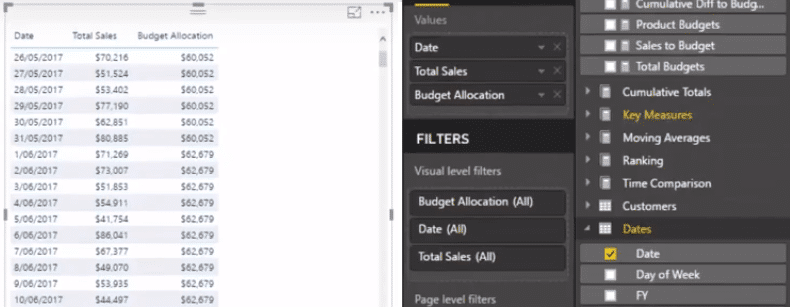
First, we need to go to another page to set up the scenario and data table. This makes it easier to see what’s going on with the data itself. We then create a data table with DATE, the TOTAL SALES from the Key Measures and the BUDGET ALLOCATION from the Budget Measures.
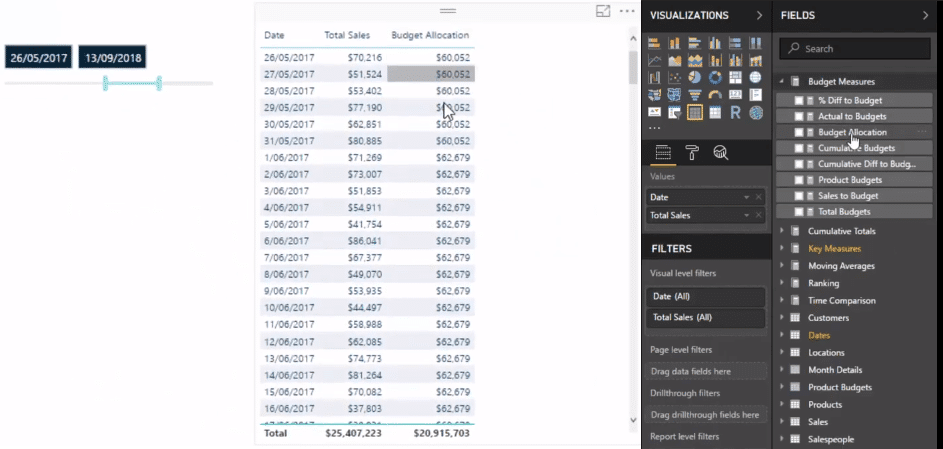
The budget is set to allocate for every single day because the data context is by DATE. At the moment, the budget is not cumulative. We are going to use DAX formulas to make it so.
Dynamic Budget Allocation Formula
The formula looks complicated but if you work out how it’s set up, it will make sense. Variables are used in the formula – I will link the tutorial for the formula in detail.
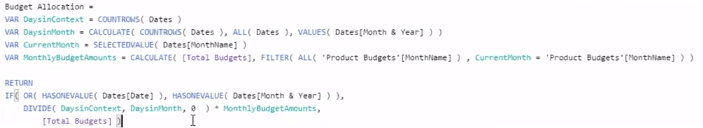
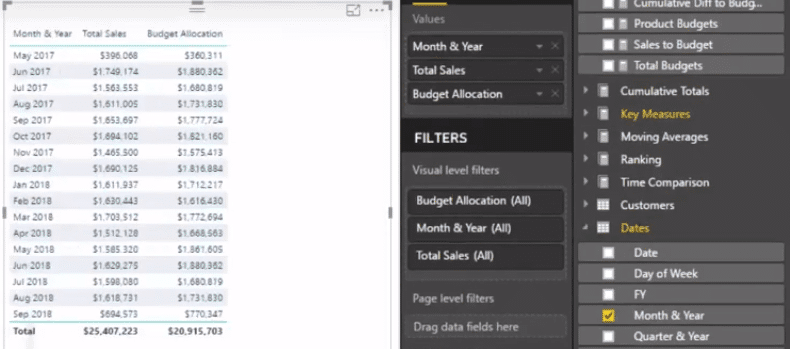
In your data, the budget can come in different granularities. It can be monthly like in the example above, it can also be yearly or weekly – this depends on how you define your data in the beginning.

Power BI allocates the budget based on how you set up your formulas.

We can switch the DATE field into MONTH & YEAR instead and still get the correct breakdown because our formula is dynamically set up.
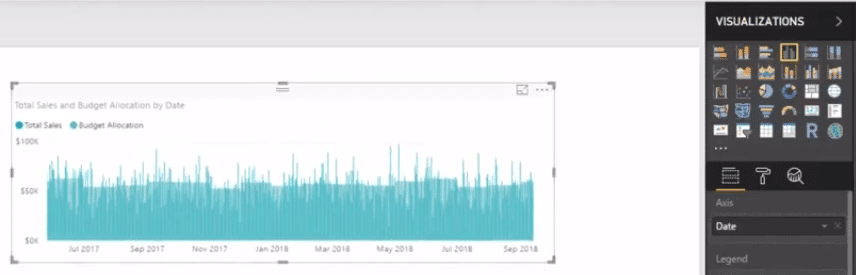
Visualizing the Data
We’ll use bar charts to visualize this data and compare the daily performance to our budget allocation. This already gives us a good insight in itself – however, this is still not cumulative.
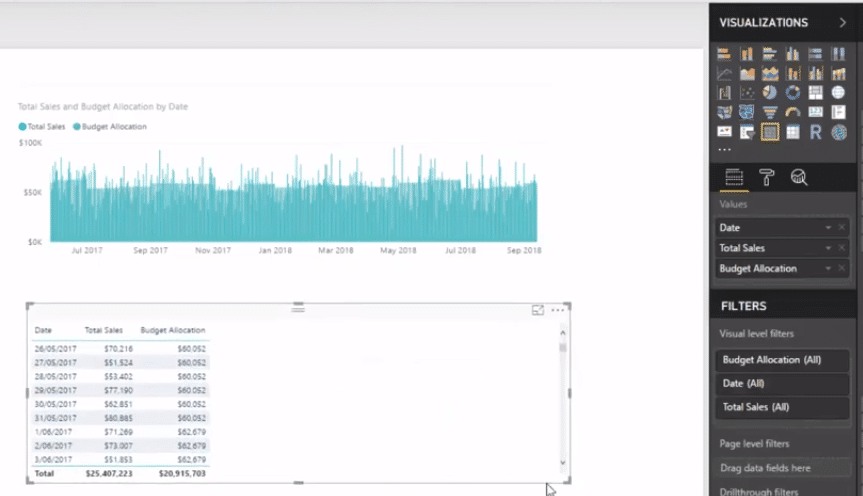
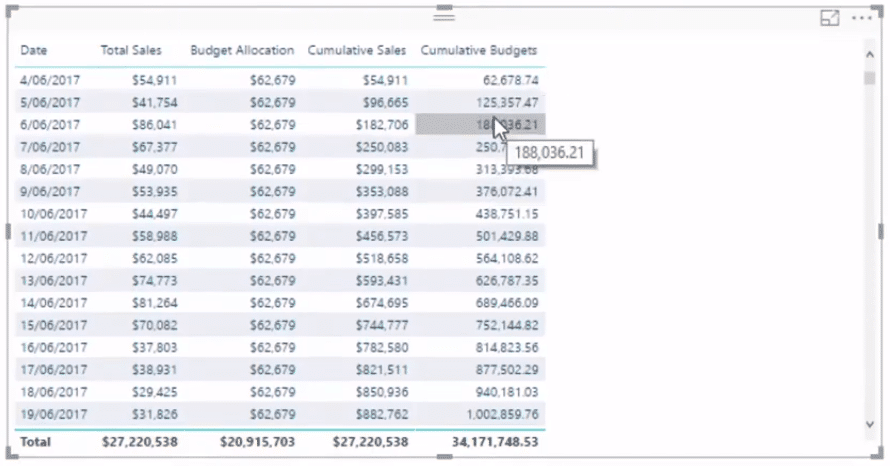
Next, we duplicate this chart and turn the duplicate into a table to see the actual values.
Cumulative Sales and Cumulative Budgets
We’ve talked about Cumulative Sales many times before which follows this formula:

The Cumulative Budgets has a slightly different approach because we need to use complex DAX formulas.
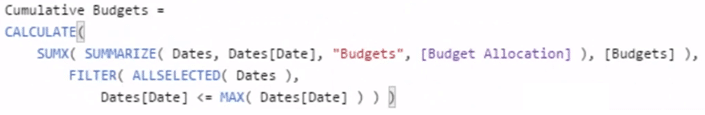
The big difference when calculating Cumulative Budgets is that we can’t use the Budget Allocation by itself. It needs to pass through several DAX formulas to refine it.
If you notice on the right hand side of the SUMX formula we have the Budgets variable. What’s interesting here is we declared the Budgets variable inside the SUMMARIZE formula, DAX formulas can use a column that you virtually created as a reference right away. You will see it is similar with our other Cumulative formulas, except the SUMX portion.
To review, we SUMMARIZE the Budget Allocation at the same time, creating the Budgets variable. We then use SUMX on this Budgets variable to create the virtual table where we get the cumulative totals.
***** Related Links*****
Cumulative Totals Based on Monthly Average Results in Power BI
Calculating Reverse Cumulative or Reverse Running Total in Power BI
Budget vs Actual vs Last Year – Financial Reporting Tips
Visualizing Cumulative Budgets
Now we add the Cumulative Budgets column to the table and we see that it adds the budgets cumulatively on all dates. This is a great way to represent seasonality in your data.
We then remove the columns we don’t need and change the table into a graph. This represents the data effectively in a cumulative way and shows the deviation better.
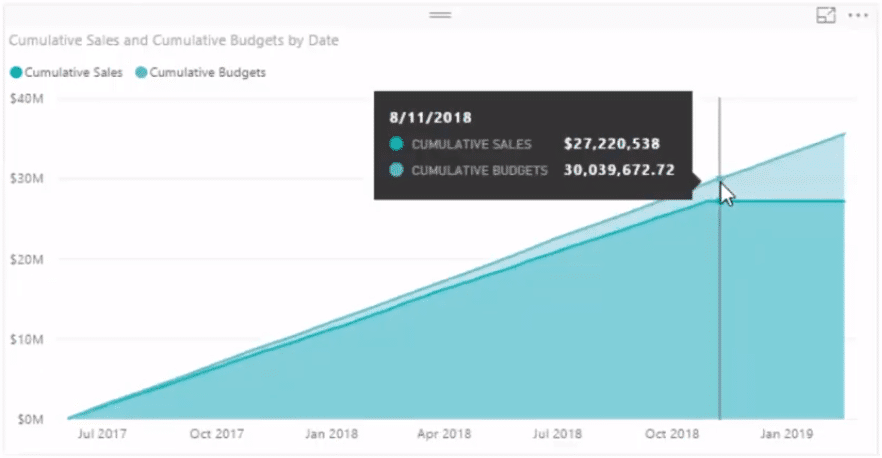
From the visualization perspective, you will identify trends better by using different elements together. I went through many other samples in the Advanced Budgeting Session. I’ll put a link below to the replay which is up on Youtube as well.
If you want to play around with this sample file, it is up on the Showcase page.
All the best
Sam
***** Learning Power BI? *****
FREE COURSE – Ultimate Beginners Guide To Power BI
FREE COURSE – Ultimate Beginners Guide To DAX
FREE – 60 Page DAX Reference Guide Download
FREE – Power BI Resources
Enterprise DNA Membership
Enterprise DNA Online
Enterprise DNA Events


