In this tutorial, I’m going to show you an extended version of the ultimate Budget Allocation methodology that allows you to compare your Sales vs Budgets. You may watch the full video of this tutorial at the bottom of this blog.
The Budget Allocation formula allows you to solve data with mismatched granularities. For example, your Budgets could be at a monthly granularity while your Sales data could be at a daily level.
This is the ultimate Budget Allocation formula:

The formula might look complex, but it’ll be easier to use once you understand how to work through it.
Now, I want to show you how to extend this formula by branching it out into other calculations.
Showing Difference In Budgets
The table and chart both contain the same data.
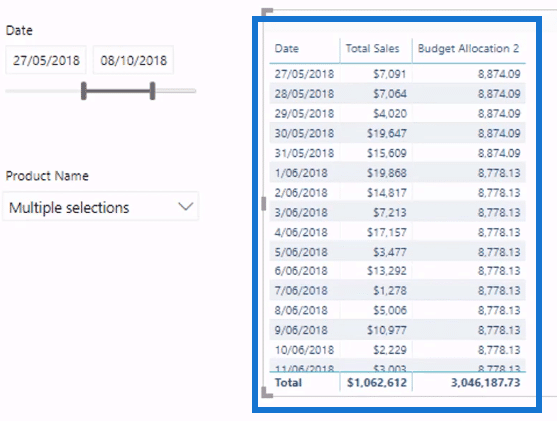

In the chart, I’ve overlaid the Total Sales to the Budget.
The Budgets are at a different granularity. For this example, they’re at a monthly granularity while the Sales information is at a daily granularity.


After correctly allocating the Budget, you can start branching out.
For instance, I want to work out the difference in my Budgets. I want to know the Sales versus Budgets.
I’m going to create a new measure and then type in:

All I need to do is get the difference between the Total Sales and the Budget Allocation.

I’ve now branched out into this calculation.
By dragging this new measure into the table, I’ll be able to see the difference in my Budgets.
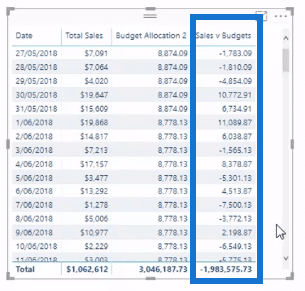
I can also change this new information into a visualization which I can put under the current chart.
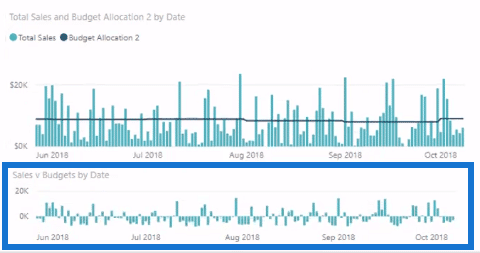
This allows me to make easy comparisons.
Getting The Cumulative Difference
Another thing you can do is get the Cumulative Total.
This calculation is especially useful in highlighting trends. In this case, I want to show if I’m below the Budget from a cumulative perspective.
Instead of knowing the day-to-day trend, I want to see how this plays out over time. There are a couple of ways of doing this. But I’m going to show this method by throwing in Sales versus Budgets into a Cumulative Total pattern.
However, there are a few nuances to the Cumulative Total pattern. You need to create the two Cumulative Totals separately.
I’ve calculated my Cumulative Totals using this formula:

In the table, you can see that the Cumulative Budget starts at 8,874 and then increases. This is also the trend for the Cumulative Totals.
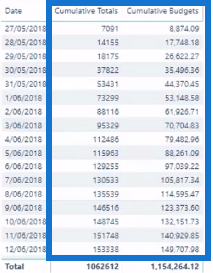
The Cumulative Totals pattern using Total Sales in its formula is the simpler version.
However, for the Cumulative Budgets formula, I needed to create a virtual table inside SUMX because of the granularity difference.

I needed to iterate through it and then create my Cumulative Budgets.
Now, if I wanted to know my Cumulative Total Difference, all I need to do is calculate the difference between the Cumulative Totals and Cumulative Budgets.

Reading The Charts
I can then bring the Sales vs Budgets measure into my report. This is then going to show my data cumulatively.

Now, looking at the previous charts, they’re not clear in showing the overall performance.
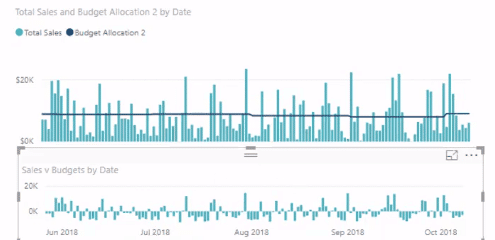
There are a few spikes above the line for the Budgets. There are also more spikes below it.
These spikes could be because of what happens throughout a week. You may not have high sales throughout this time frame. It could also be because of the Budget that’s allocated evenly across every single day.
But in this particular case, the Cumulative Difference is going to represent the results.
The Cumulative Difference, which was calculated using the Sales versus Budgets formula, shows I’m a bit behind in my Sales.

However, this is not significant.
The charts show that I’m behind by 100,000 for the duration of 11-12 days. But on average, I’m selling about 8,000 to 9,000 every day.
Moving forward, this dynamic calculation will also automatically adjust for any change that you make across your data set.

You can filter with any of the dimensions in your model using slicers.
Conclusion
This technique is a simple and effective way of branching out from the initial calculations of the Budget Allocation formula.
Hopefully, I was able to simplify this for you. It’s quick and easy to implement. And usually, it’s the simple things that can create very valuable insights in Power BI.
All the best,
Sam
[youtube https://www.youtube.com/watch?v=m6-3r3tD4nY?rel=0&w=784&h=441]


