In this blog post, we are going to take a look at a question that was asked on the Enterprise DNA forum and use a DAX language Power BI technique to solve it. In case you want to follow along and download the files, just visit the Enterprise DNA forum and go to this link. You can watch the full video of this tutorial at the bottom of this blog.


To explain the scenario that we are going to cover, we have a simple table as an example. In the first column, we have Financial level 1. In the second column, we have a date that is named Completed. In the last column, we have the combination of financial level and completed date, which we will name Revenue.
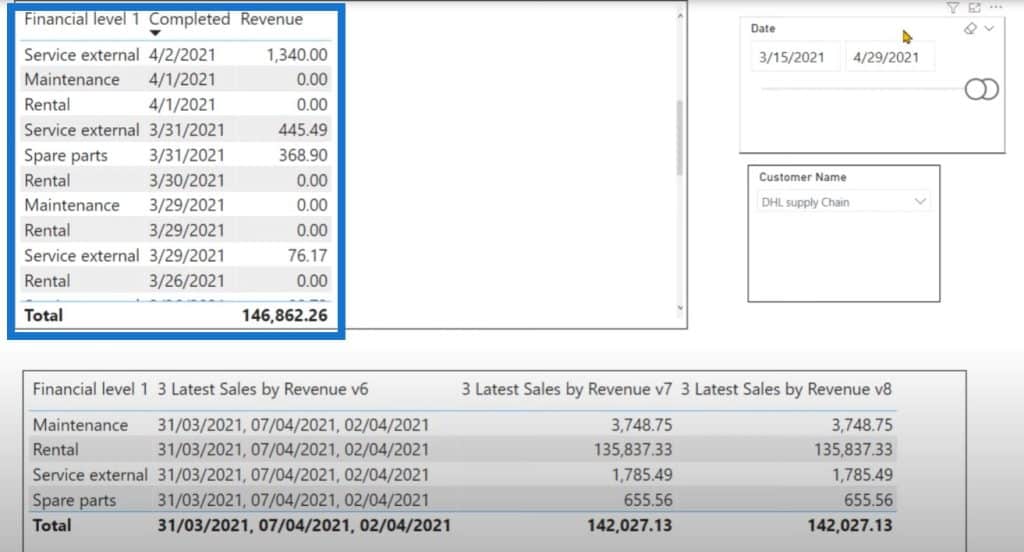
Then we have a slicer for the Date and Customer Name.
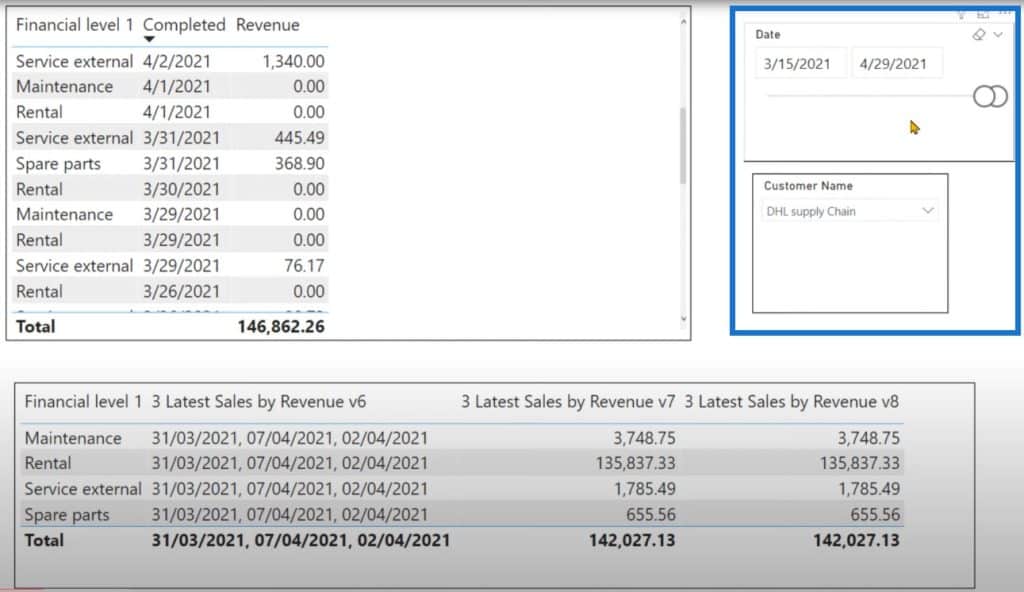
What we want to do for a specific time period is to identify the top three dates that are not zero. And then in those top three dates, we want to identify the financial level.
In the first version of the measure, I listed the dates that are less than the 4/29/2021 in which we have some revenue.
And on these dates, we want to identify the financial levels that have made some revenue. I will explain to you how we can achieve that calculation.

Data Modelling
Before writing the actual DAX, let’s take a quick look at the data model which contains multiple tables. We are only interested in the Date table, Data table, Job category table, and Customer table.
Note that the Customer table is not really important because it is only used inside a slicer.

The revenue measure is getting calculated in the Data table. The Job category contains the financial level that we have on the matrix. Then we are using the Date column from the Date table in our slicer.
Version 1
Let’s get rid of everything from the matrix and start from scratch. I’m going to create a new measure and call it V1 because this is going to be version one. We are going to take a look at two other variations as well.
Preparing The Filter Context
The first thing that we are going to do is to retrieve all the values of the financial level from the filter context. We’ll create a variable and name it as FinancialLevelInFilterContext.

To retrieve the values from the filter context, we are going to use the VALUES function on the Job category table that contains the financial level column. Then we need to create another variable and name it Result. Then write CALCULATE, and close it as well.
In the first argument, we have a selection over the date slicer. In those dates, we want to identify the dates that do not have a 0 and have at least some revenue.
If you want to access all the dates that are selected in that slicer, we need to use the ALLSELECTED function over the Date table.

And since we have the financial level on the matrix, we also need to make sure that we are removing that particular value from the filter context. We can use the REMOVEFILTERS function over the Job category and then write Financial Level 1.

Now that our filter context is prepared, we can write the innermost calculation for CALCULATE. First, we’ll declare a variable, which will be a combination of the financial level and date column as we have seen in the first table.
Then we’ll use the SUMMARIZE function and use the Data table to summarize these two tables: Job category and Date table.
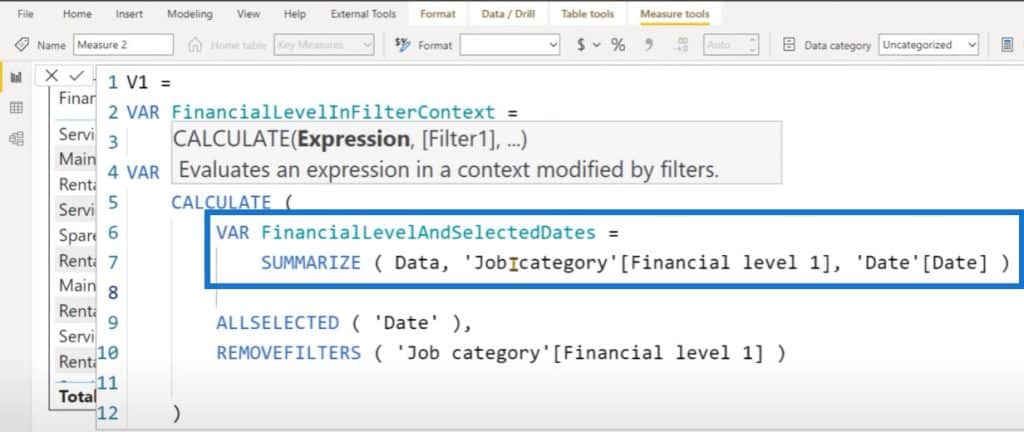
This will provide the combination of the financial level and the date column that exists inside the Data table. Then we are going to create another variable where we will store the value of the revenue row for the first variable that we have created.
The name of this variable will be FinancialLevelAndDatesWithRevenue. The code of this variable will be the ADDCOLUMNS over the previous variable. Then we will create a virtual column that will be Revenue to initiate the context transition. So for each row of this variable, we have assigned the revenue.
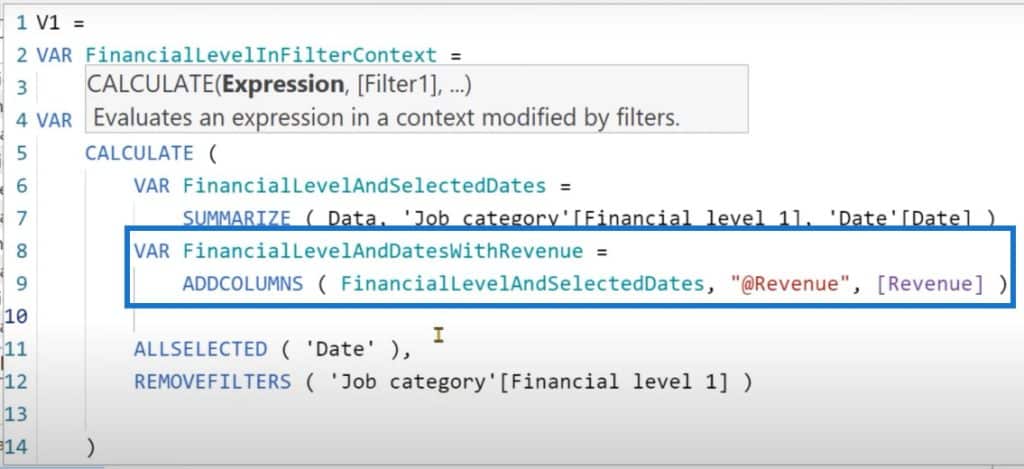
This table contains the revenue, which also has zero. We need to filter out those rows with zero. To do this, we can create another variable and name it as RemoveZeroes.
We’ll use the FILTER function on the previous variable, then make sure that the revenue will not be equal to zero. It can be greater than zero or less than zero, but should not be strictly equal to zero.
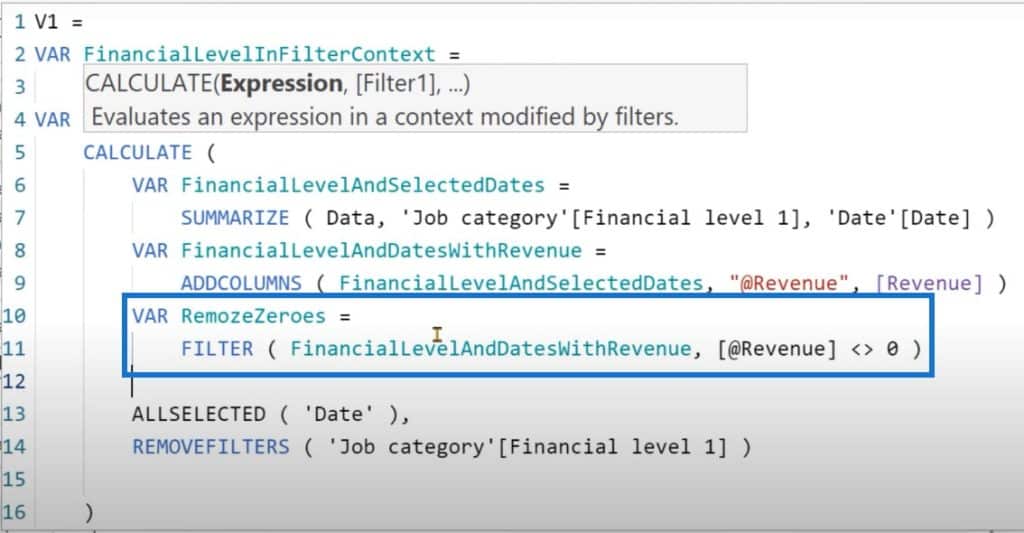
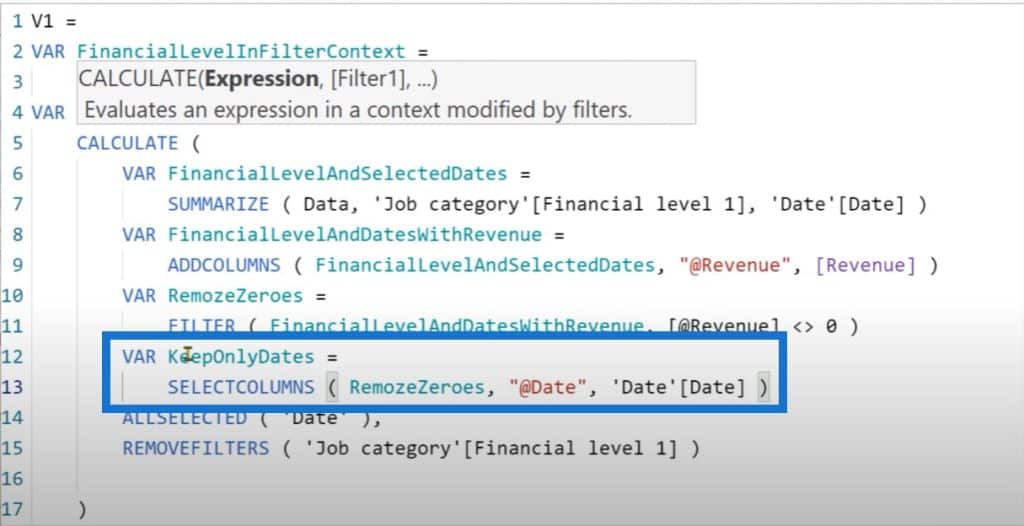
And then we are going to retrieve the date from the RemoveZeroes variable. To do this, we can create another variable and name it KeepOnlyDates.
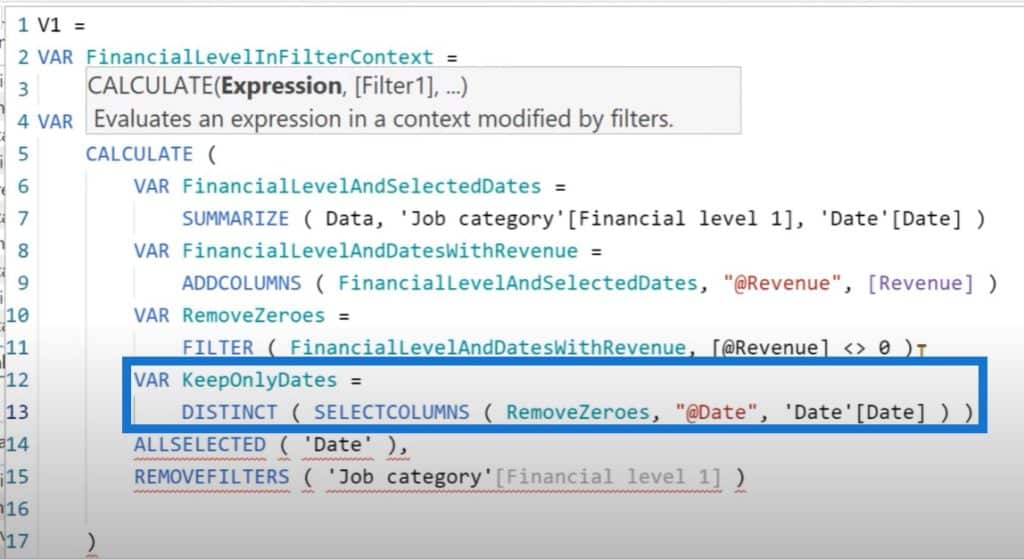
I can use the DISTINCT function to get rid of the duplicate dates that are getting returned by the SELECTCOLUMNS function.
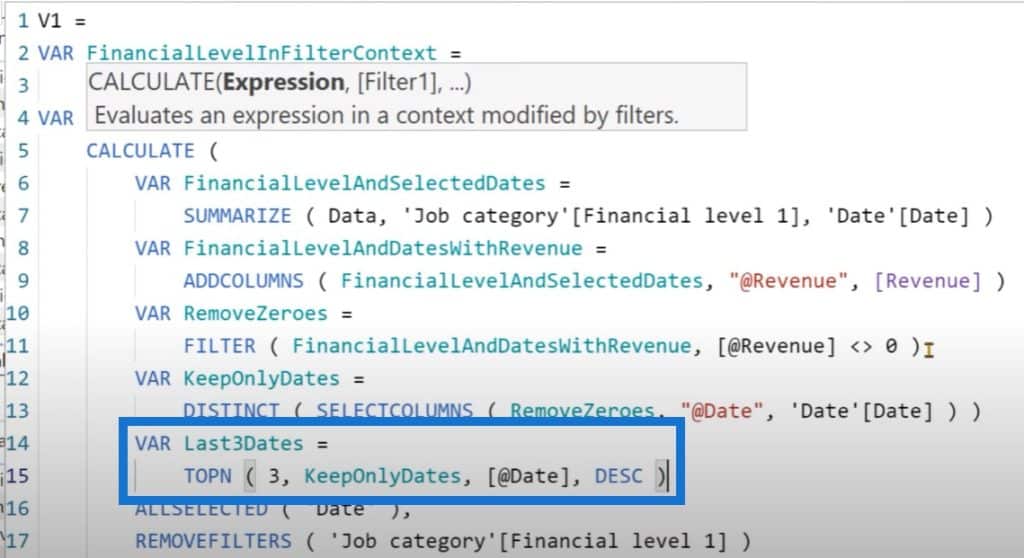
Next, we are going to identify the top three dates in descending order. We’ll use another variable and name it Last3Dates, then use the TOPN function.
Then we will use the CONCATENATEX over the last three dates in the date column, then use a delimeter.

Let’s drag and drop our newly-created measure inside that matrix. The result we are getting is 31/03/2021, 07/04/2021, and 02/04/2021. This means our measure is working.

Let’s go back to the editor and get rid of the RETURN CONCATENATEX portion. To retrieve those last three dates, what we can do is check which rows from the RemoveZeroes variable are actually part of those last three dates.
And for that, we’ll create another variable DatesInLast3Dates, and use the FILTER function on RemoveZeroes. This is going to return a table that comprises of a Job category and Date.

We will sum up the revenue column that we have created inside that table. Let’s return SUMX over DatesInLast3Dates, then summarize the revenue column.

With this calculation, we only get one single value for each row, because we have removed the Job category from the filter context.
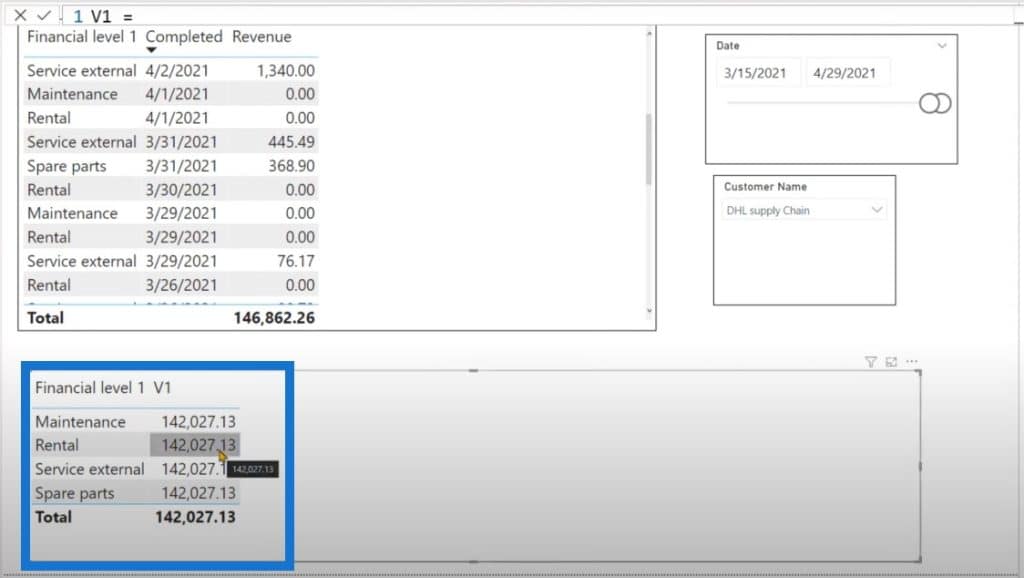
We’ll use the variable that we have created at the start to check if each row of the DatesInLast3Dates variable is available in the filter context. We can write another variable and name it IsInFilterContext.
This will filter the dates in the DatesInLast3Dates variable. Then I will return SUMX over the IsInFilter context and summarize the revenue column.

Once we press Enter, you can see that we get the same result that we had in the beginning.

Verifying The Result Of The DAX Language Power BI Calculation
To verify that we are actually getting the correct result, we can create a new CALCULATE table that will help us in debugging, identifying, and verifying that the code that we have written so far is actually returning the correct result.
Let’s create a copy of the code that we have written so far. I’m simply going to copy the portion that’s highlighted below, go back to create a new table, and paste the highlighted code. We are not going to bother naming this table because it is not of interest to us.

And we can simply write RETURN DatesInLast3Dates. If I click Confirm, we get a table but we know that it is not actually returning the correct result just yet because we actually need to mimic the behavior of the slicer.

We can wrap that code inside a CALCULATETABLE and indent everything. In the last part, I’m going to write that the date should be greater than or equal to 2021-03-15 and that the customer name should be equal to DHL Supply Chain.

The table that we have created inside that measure is virtually returning the correct result. We can use a CALCULATETABLE to verify the virtual table that you’re creating inside your calculation.
Other DAX Language Power BI Calculations
Now that we know that our calculation is working and understand what is actually happening behind the scenes, we can look at other methods to compute the same problem. First of all, let’s create a duplicate of the measure that we have already created.
Version 2
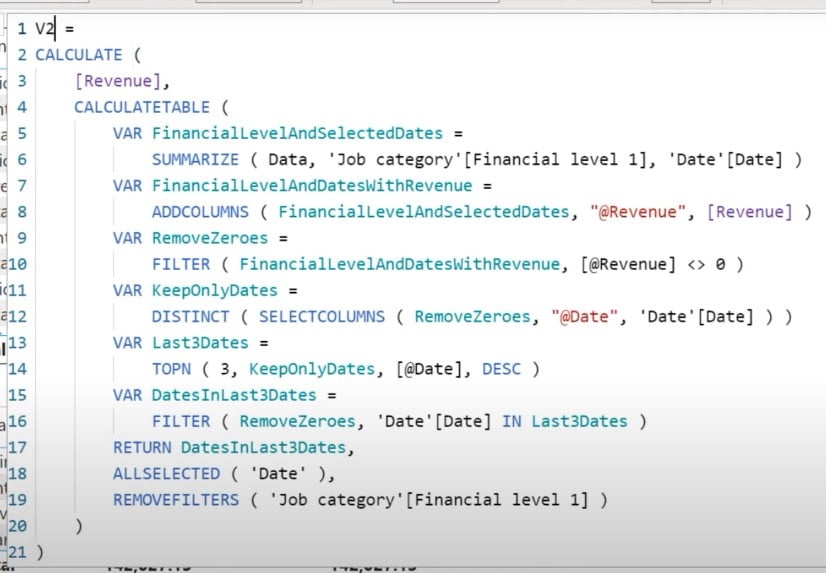
This time, we are not going to rely on the VALUES and FILTER functions, so we’ll get rid of them. We’ll remove the return result, as well as the last variable that we have created inside CALCULATE. Then, we’ll convert CALCULATE to CALCULATETABLE.
And instead of returning a scalar value, this time we are going to return the DatesInLast3Dates. This will return the same CALCULATETABLE that we made earlier. We are going to use the CALCULATE function, and in the first argument, we are going to calculate the revenue measure and inject the CALCULATETABLE as the filter context.
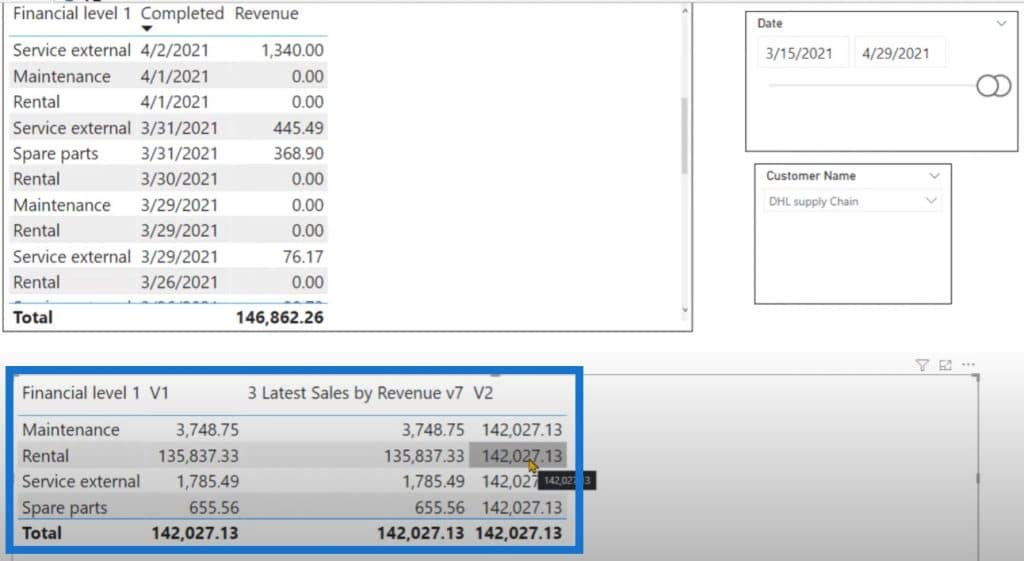
Once I bring it to the matrix, you can see that we are returning the same grand total value for each cell.
Using The KEEPFILTERS Function
At the moment, we know that the calculation behind the scene is working correctly, but how can we know for sure that for each cell, we are only reporting the value for that financial level?
With the help of CALCULATETABLE, we have created a table that contains the financial level, the date column, and the revenue column. We can use the key filter function to create an intersection between the filter context that exists outside of CALCULATETABLE and the one that is being created by the CALCULATETABLE.

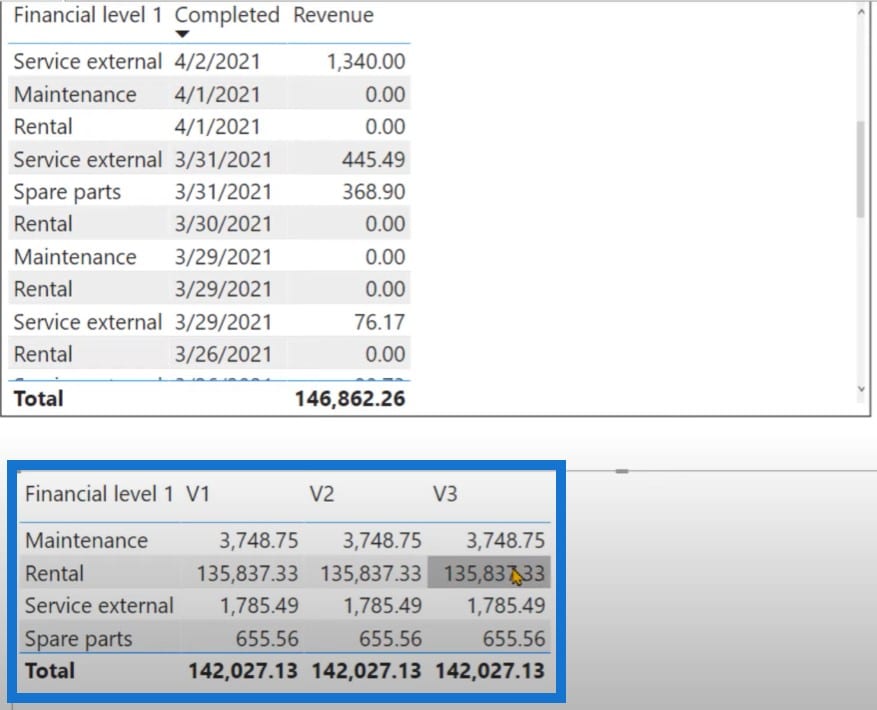
Once we click on Confirm, we can see that we are reporting the correct value for each cell and that both version 1 and version 2 are returning the correct value.
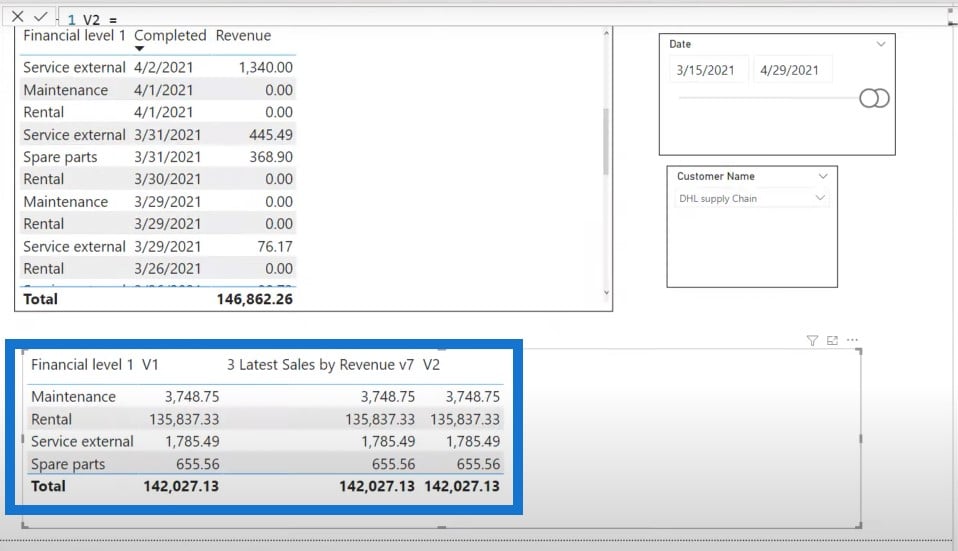
So how does this work? The CALCULATE table is going to return the Maintenance level, then Rental, Service External, and Spare parts. The KEEPFILTERS function is going to create an intersection between the maintenance and that table.
Rental is going to create the initial filter context, then the CALCULATETABLE is going to return all the values of the Job category. Then there is going to be an intersection between the Rental and the table returned by the CALCULATETABLE. We are only going to return the tables or the rows for that Rental part only.
And then finally, when we inject SUMMARIZE into the filter context, the CALCULATE function is going to compute the revenue only for Rental. The same process happens for each row.
Version 3
Let’s look at another way of computing the same calculation using DAX language Power BI. Let’s create a copy of the Version 2 measure and create another measure. We’re going to name this Version 3.
The idea behind this calculation is that since we are computing the revenue using the CALCULATE function, we do not need to use the ADDCOLUMNS part because we are duplicating the same thing inside and outside of CALCULATE. Instead, we can simply write that the Revenue should not be equal to 0.
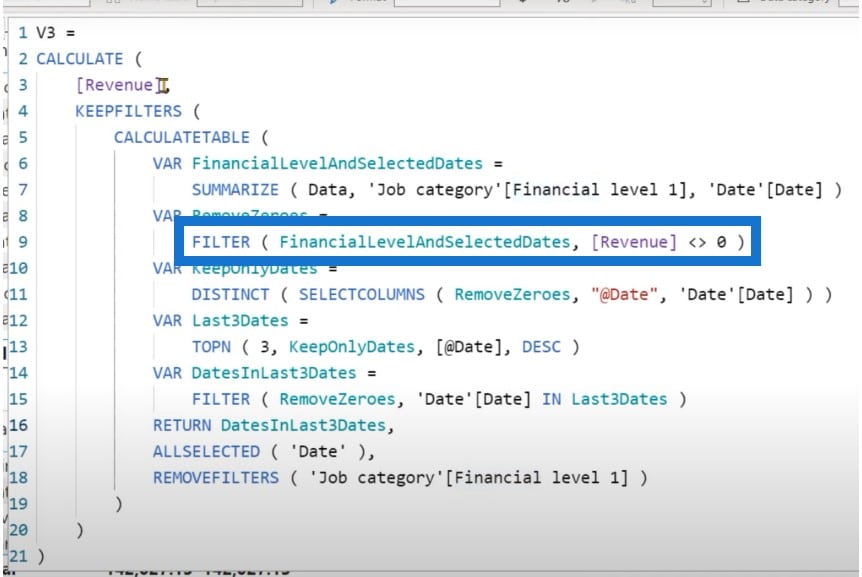
Once I click on Confirm, we need to make sure that the code is working so let’s drag the measure inside the matrix.
You can see that the code is actually returning the same value for each cell.
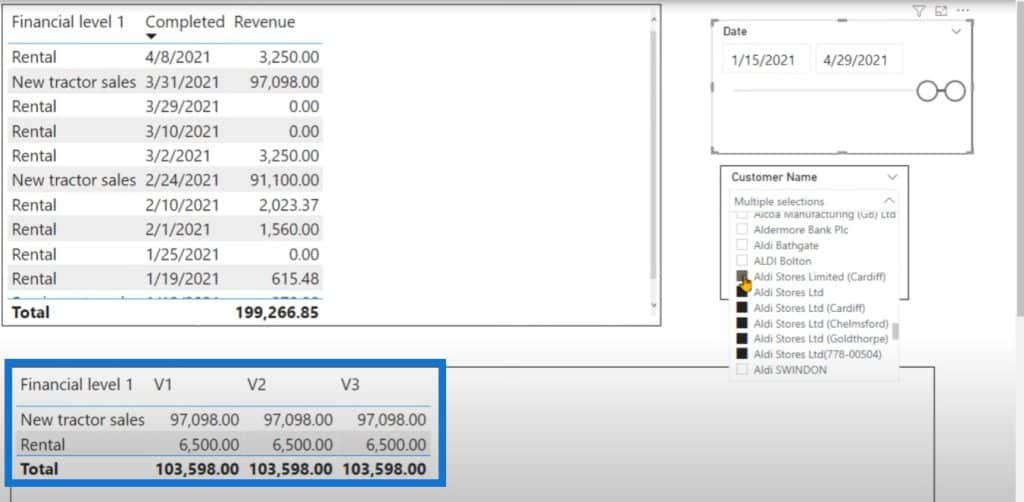
If I try to change the filter context by changing the date in the Date slicer and selecting a couple of values from the Customer Name, you can see that all three measures are actually returning the same value for each row.
***** Related Links *****
When To Use TOPN In Power BI
Ranking Insights Using TOPN In Power BI
Using DAX TOPN To Calculate Last N Weeks Trend
Conclusion
In this tutorial, we learned how to use a complex logic of traversing back in time from the end date to identify the top three dates. Based on this DAX language Power BI technique, we were able to compute the revenue and show only those values that exist in the filter context. That’s all for now in this tutorial.
Enterprise DNA Experts


