In this tutorial, I’m going to demonstrate how you can transform messy stacked data into a more organized format. There’s quite an easy way to do this, and it’s one that is going to be incredibly useful and has a lot of different applications. We’re going to use the Power Query modulo. You can watch the full video of this tutorial at the bottom of this blog.
My wife came down into the office and said she had copied a bunch of addresses out of a calendar invite and it ended up pasting in this format. She had 28 email addresses and names that ended up in this kind of weird, stacked format. It was a list of names with a bunch of quotes, commas, junk, and email addresses. She wanted to know how to use Power Query to get that into a better format.
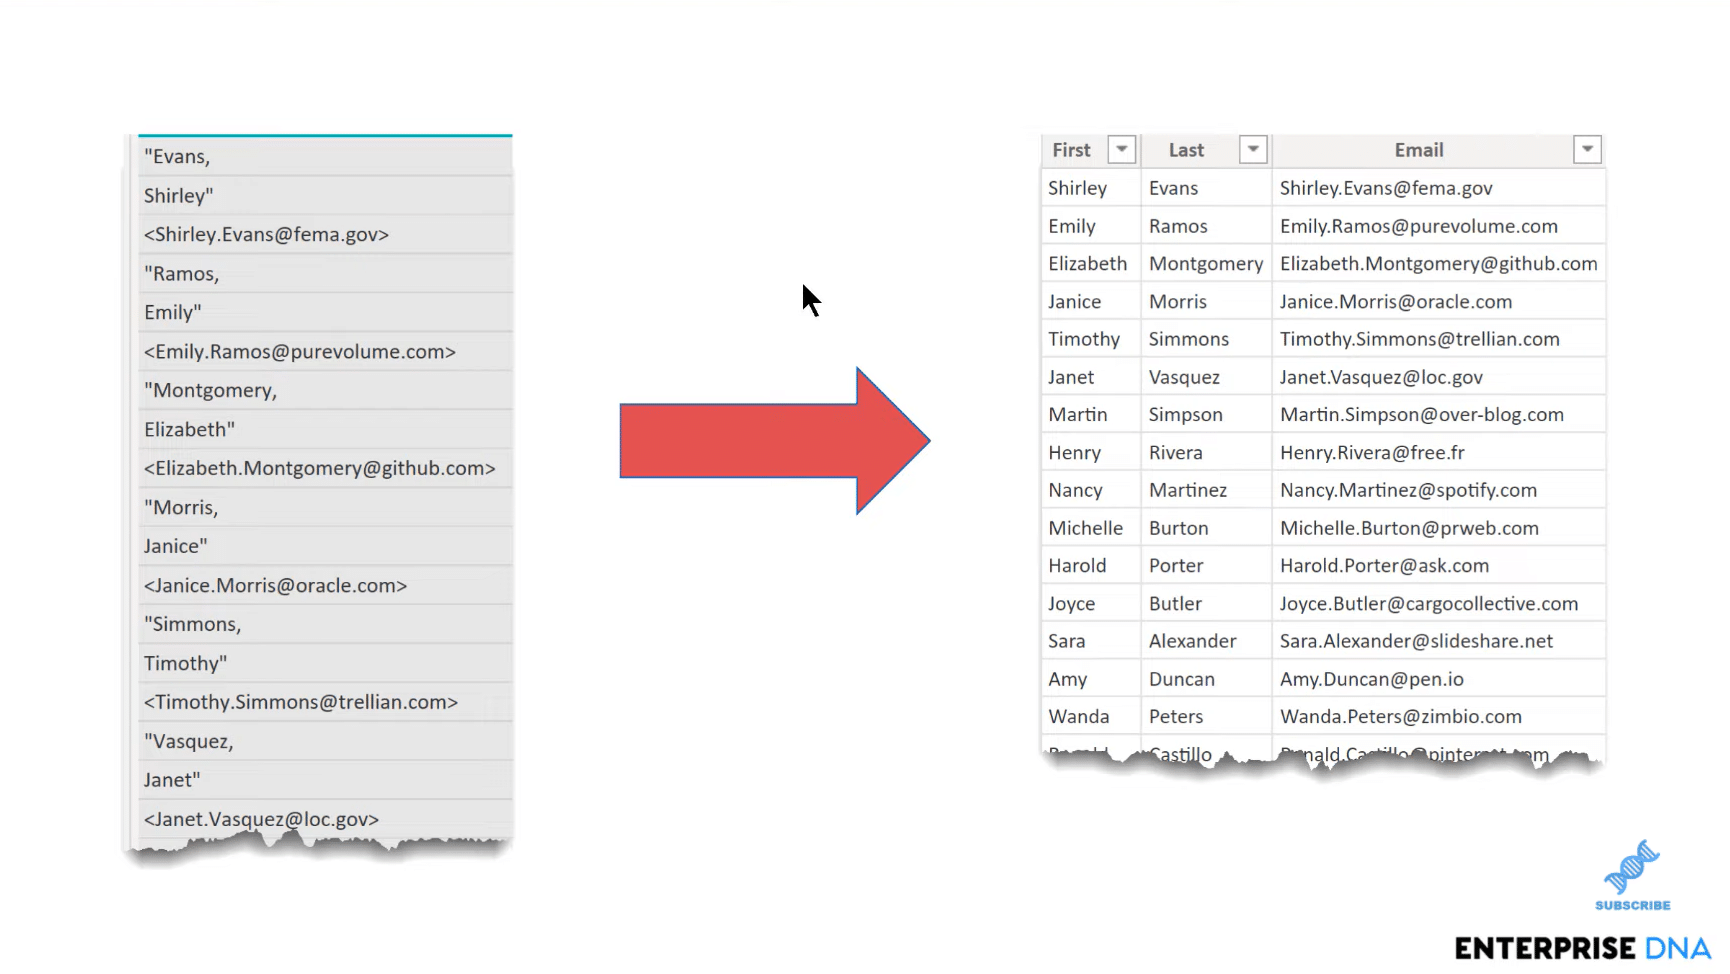
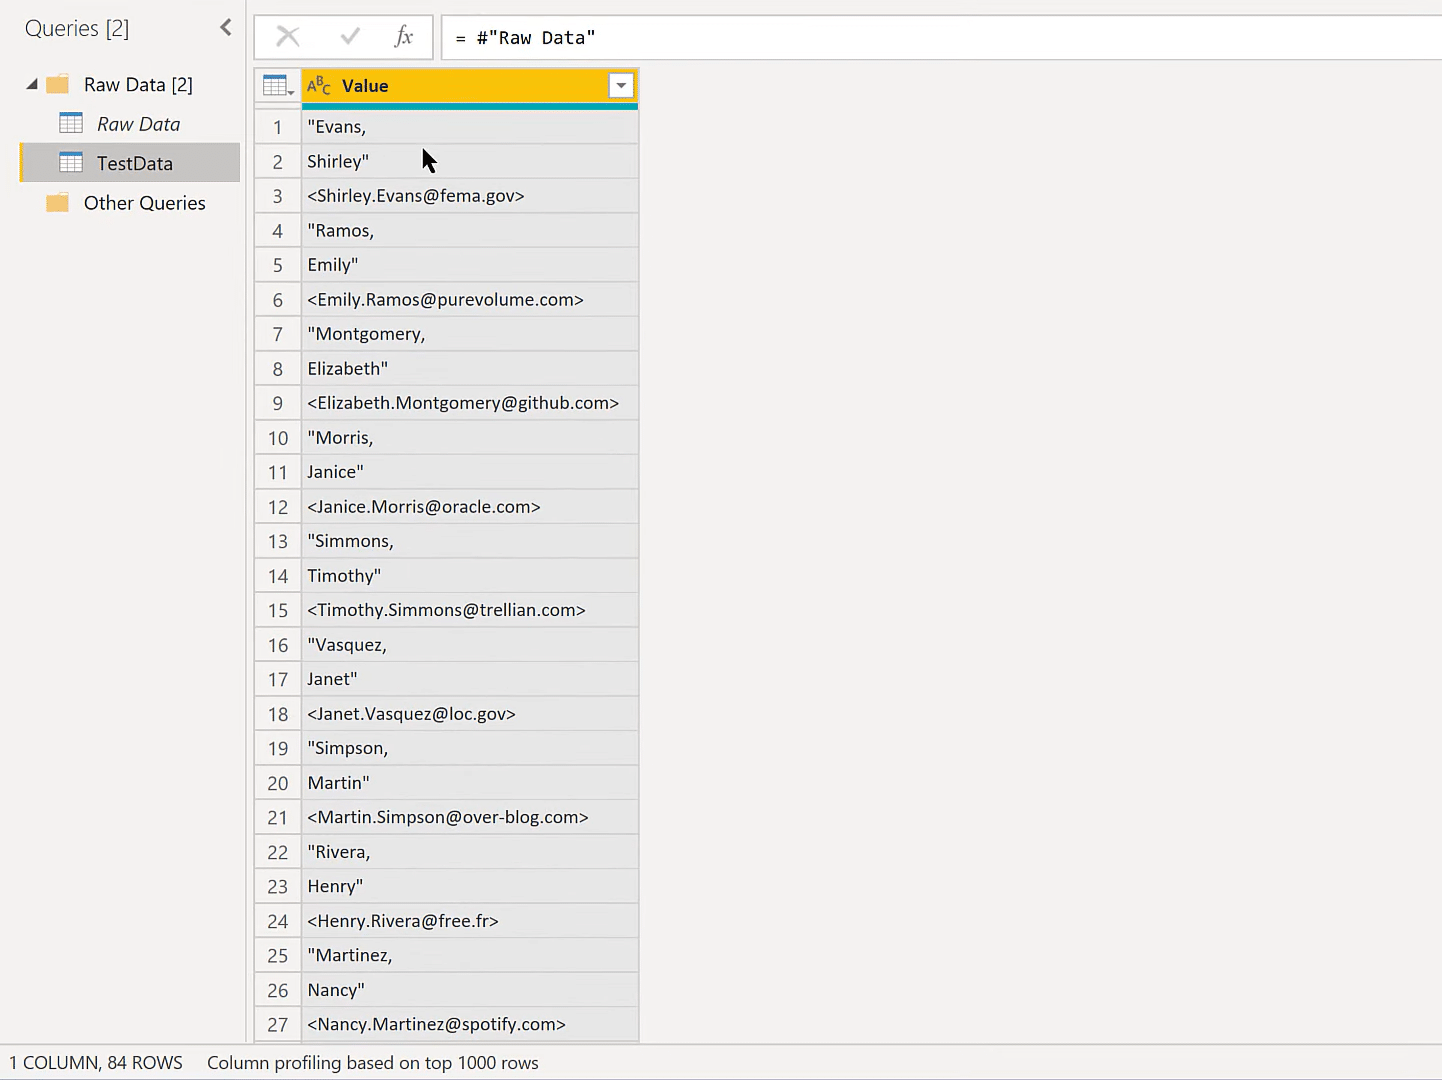
So, let’s jump into Power Query, and we’ll see the raw data. Let’s keep the raw data intact and just reference it. We’ll call this reference file, TestData.
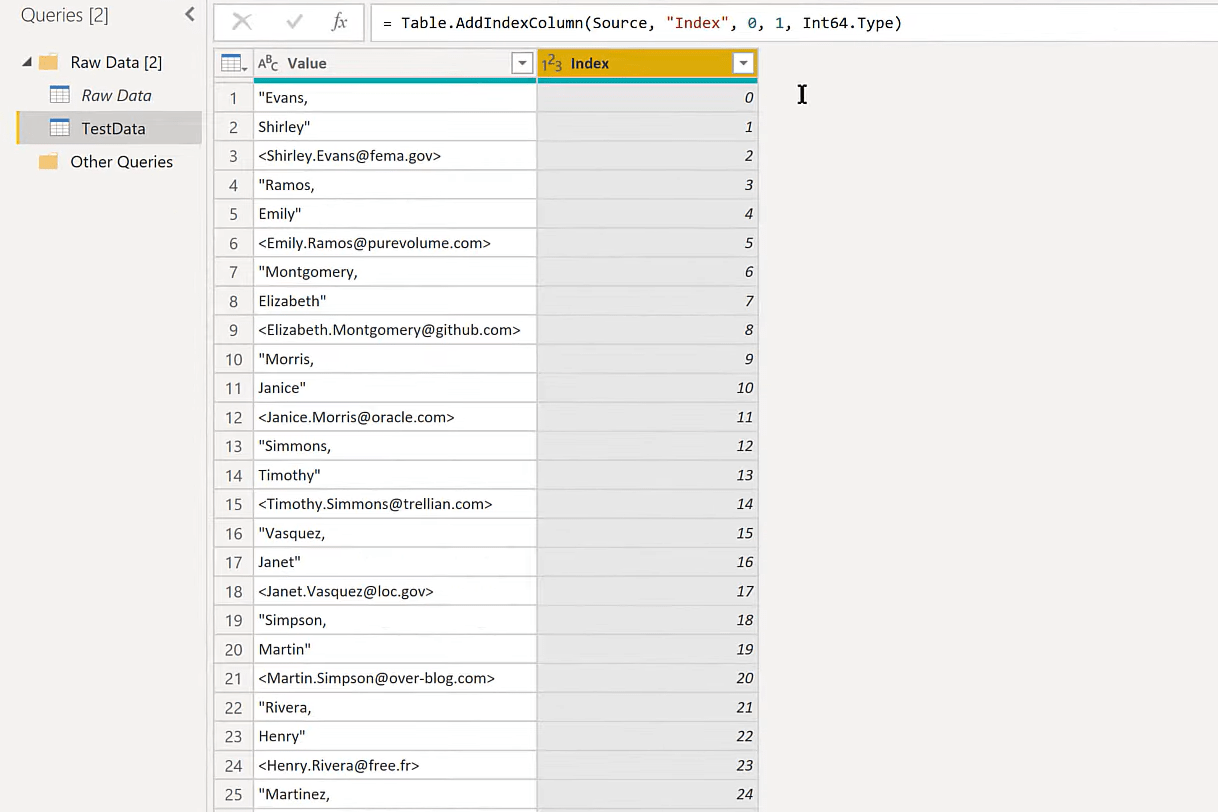
The first thing we’re going to do is to add an index and it doesn’t really matter for these purposes whether it’s a zero-based index or a one-based index. We’ll just use a zero-based index for this demonstration. It’s easy to click without having to go through any other options.
This is going to involve a pivot because a pivot takes rows and turns them into columns. In this case, we want to take this set of rows and turn them into three columns – one for the first name, one for the last name, and one for the email address.
We’re going to pivot those in the columns, but we need to have a way for the pivot to know which element goes into which column. This is where Power Query Modulo comes in.
Handling Stacked Data Using Power Query Modulo
Modulo gives us the remainder when we divide a particular number. To access Modulo, we go to the Add Column tab, then we’ll find Standard, click on the drop-down arrow, and scroll down.
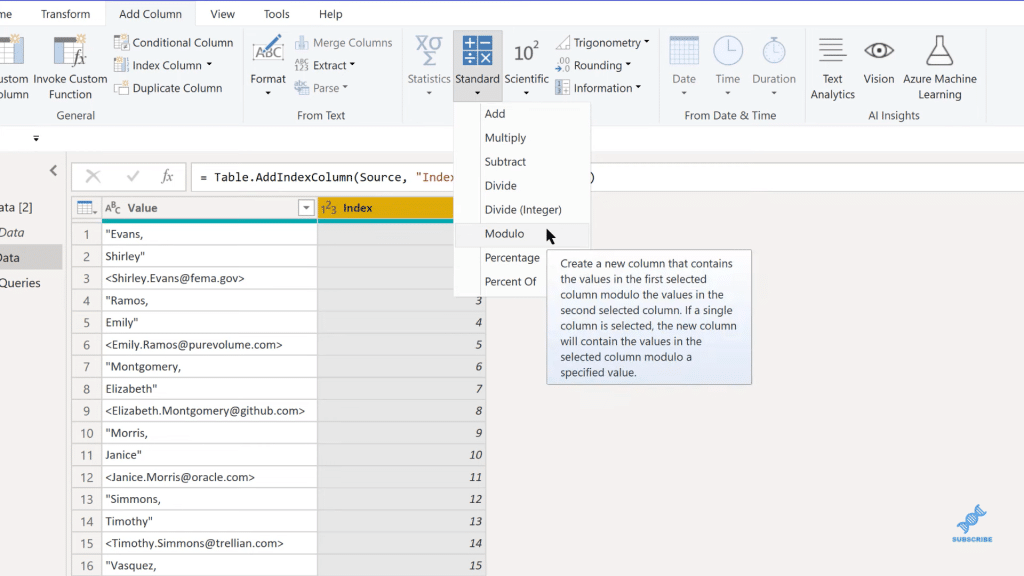
When we click on Modulo, it gives us a pop-up box that asks for the number of columns we want. In this case, we want three columns.
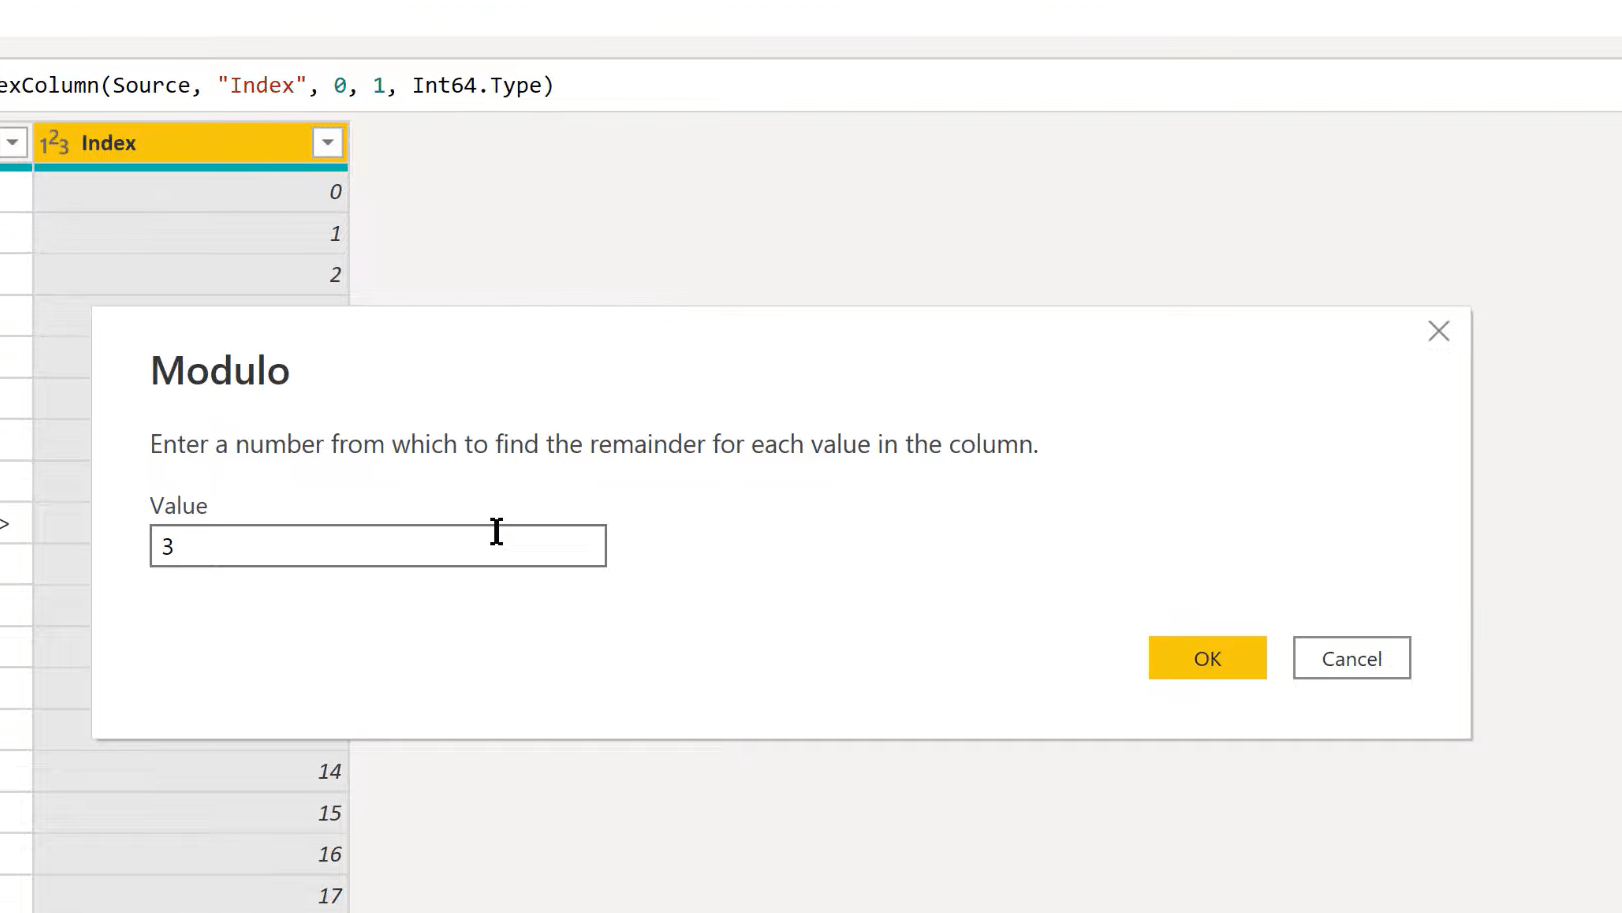
If we divide three by three, we get one with a remainder of zero. Three into four gives a remainder of one, three into five gives a remainder of two, and then three into six gives us a remainder of zero. So, it produces this nice repeating pattern that we can use for our pivot.
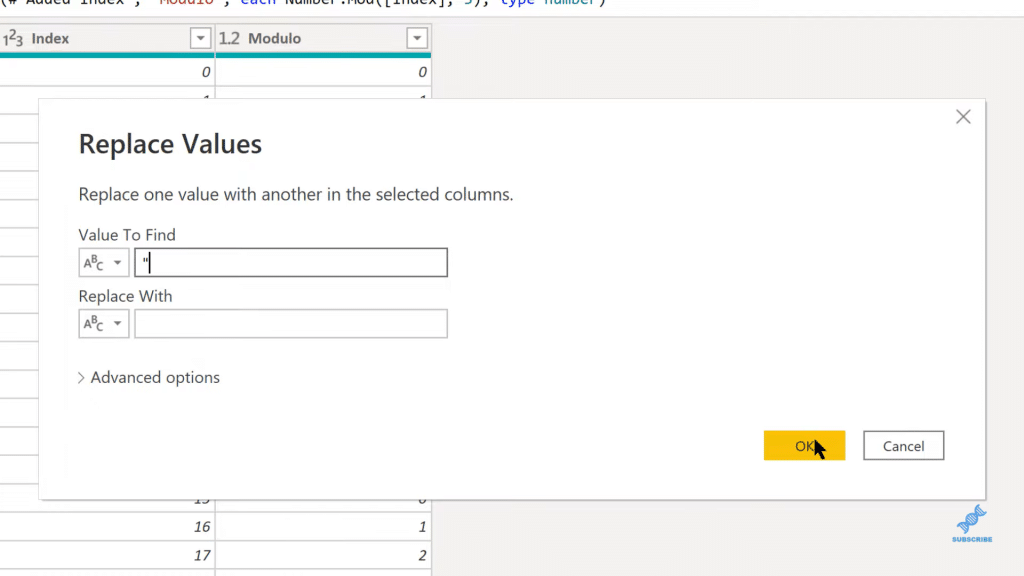
But before we do that, let’s clean up the data. There are two ways we can do this. One is that we can simply replace values. For example, for the quotes, we can just put the quote in there and then replace it with nothing. It’ll take and clean those quotes out.
The other way to do this where we can all at once clean it up and save some steps is by using a function called, Text.Remove. First, we add a Custom Column, and then we list down all the values that we want to get rid of.
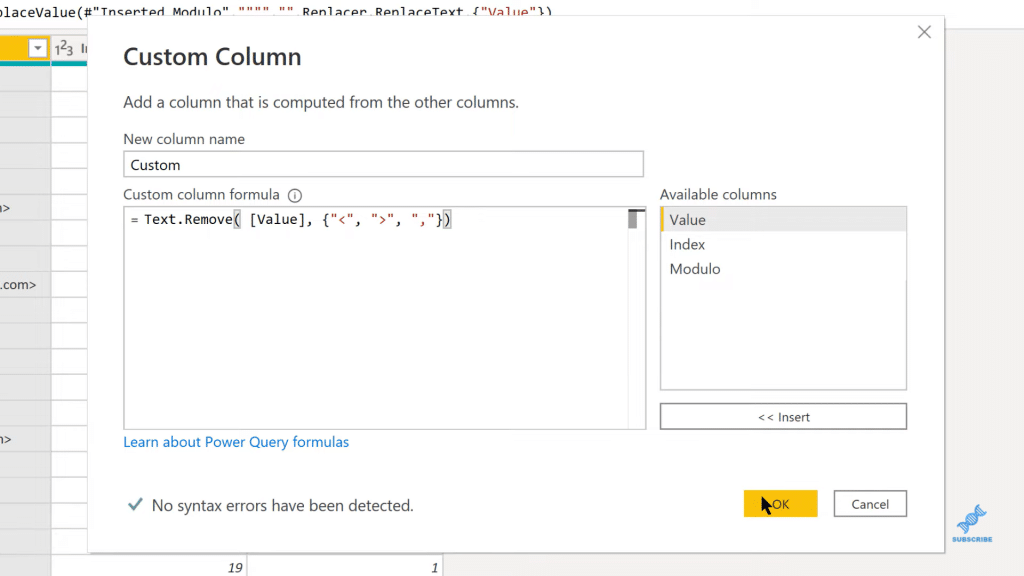
As you can see, that clears everything out nicely and easily. And so, now we can get rid of that initial column, and then move that Custom column over.
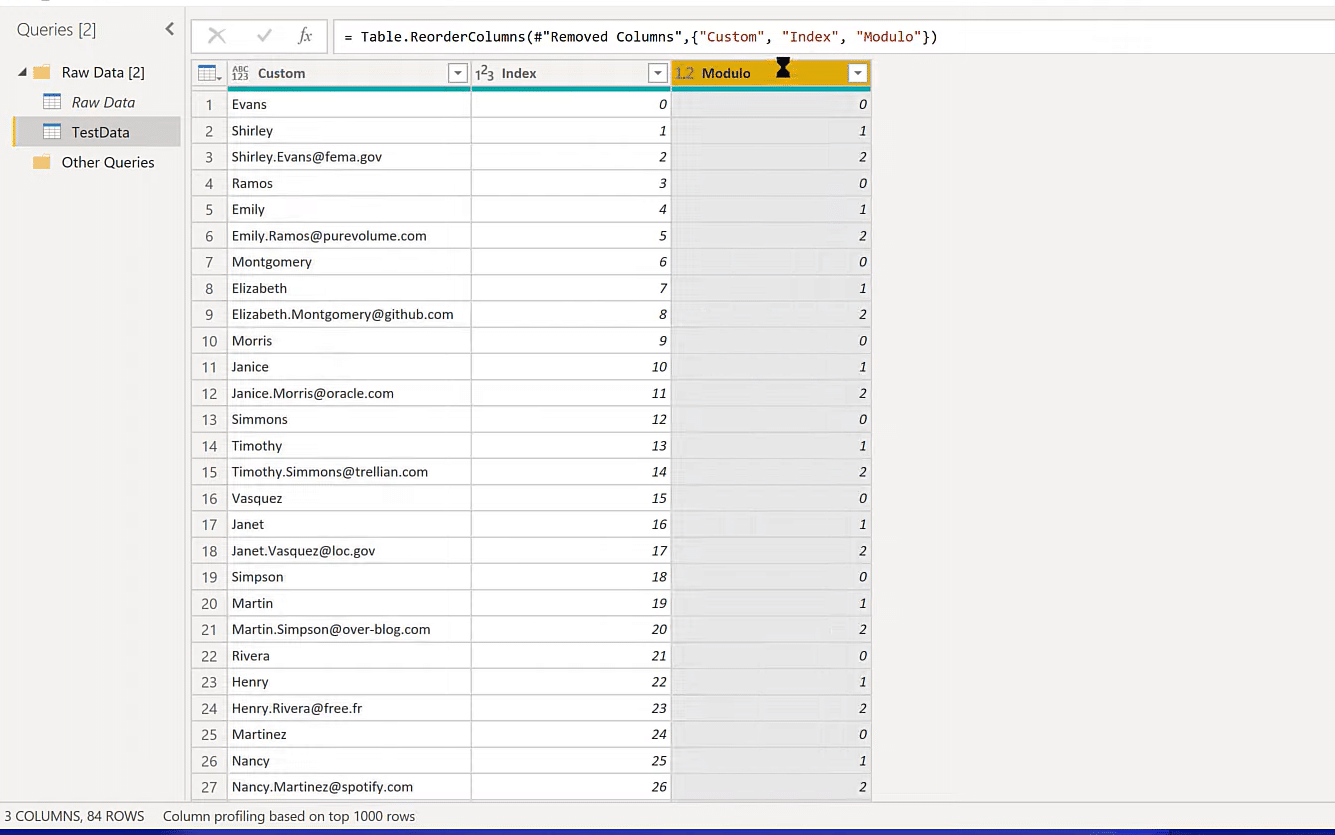
We can now do our pivot cleanly. We take on the Modulo, go to Transform, and then Pivot Column, and we’re going to pivot on the Custom, but we don’t want it to aggregate. So, we’ll choose Don’t Aggregate and click OK.

We’re just replacing it with these values in the column. It then creates those three columns for us. We can see the last name, first name, and email address in there, but it’s not exactly the format we want.
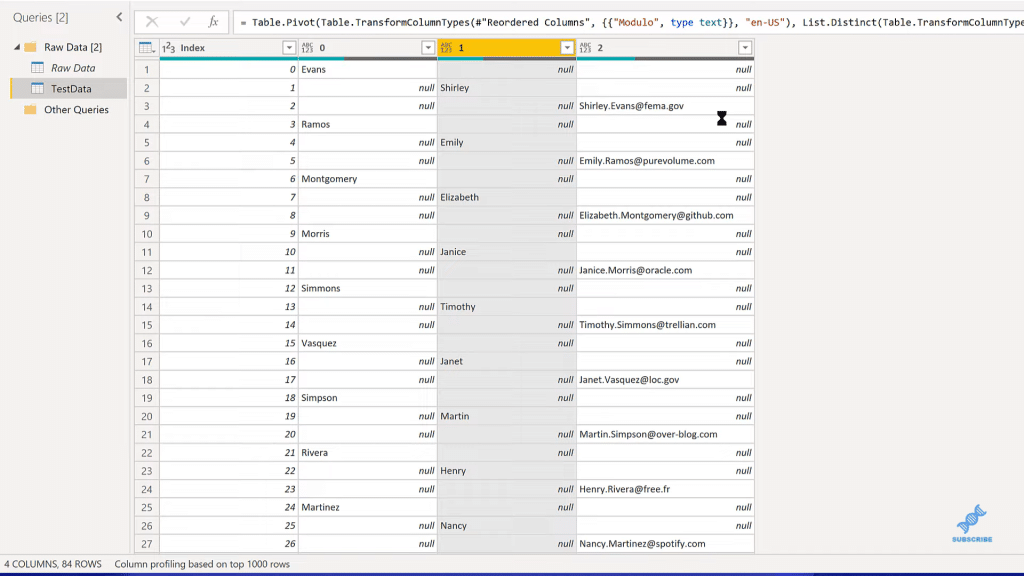
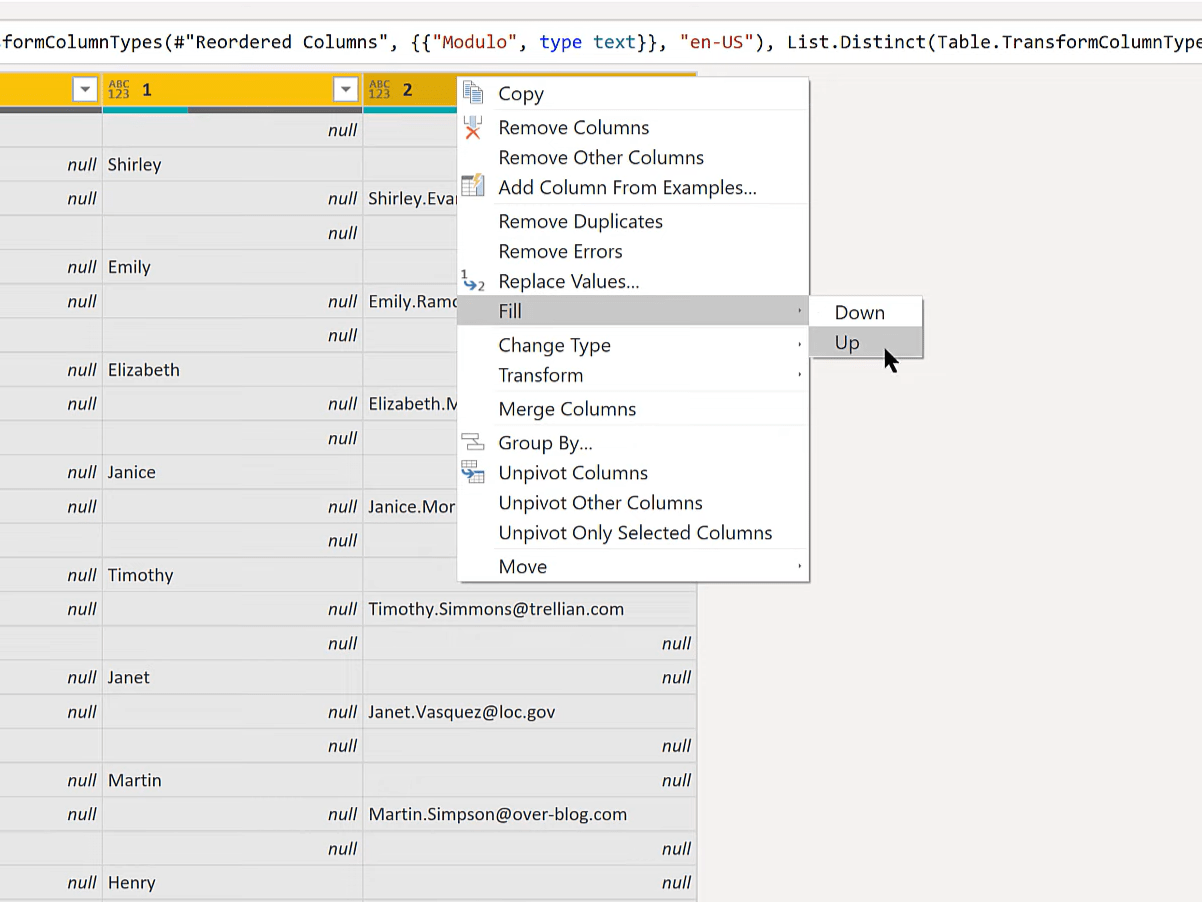
To fix that, we can take these columns, and then do a Fill Up.
And now we have these extra rows because of the repeating pattern of the Modulo.
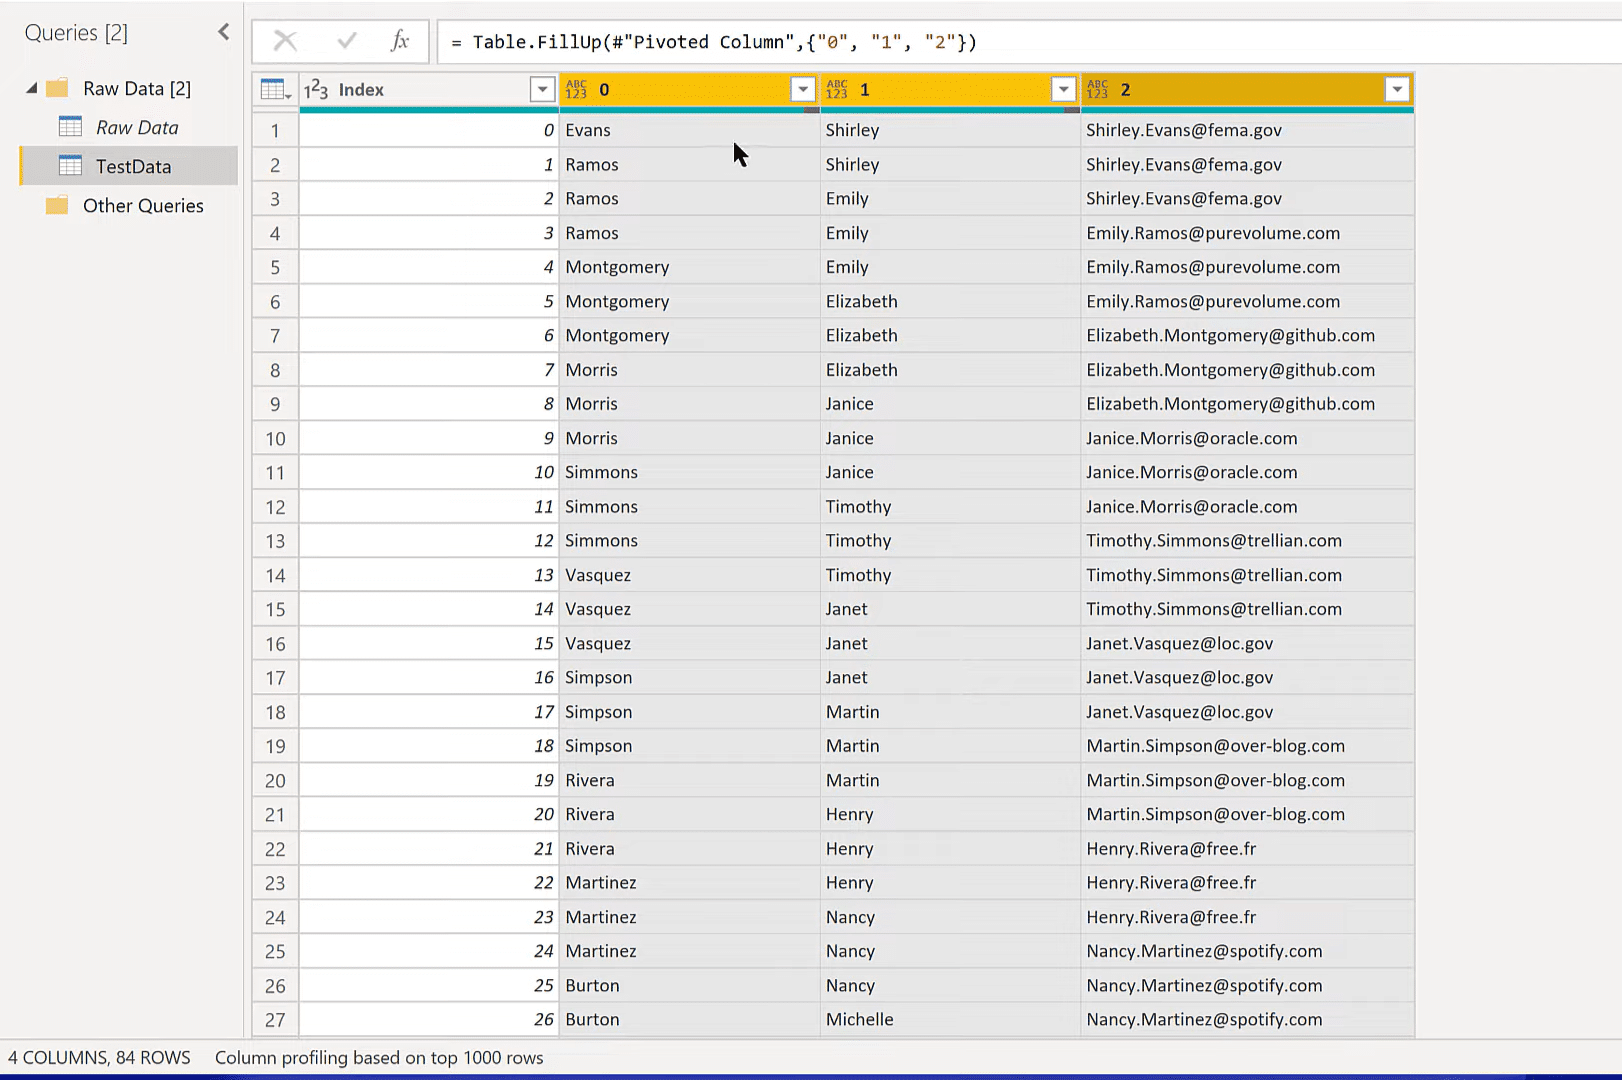
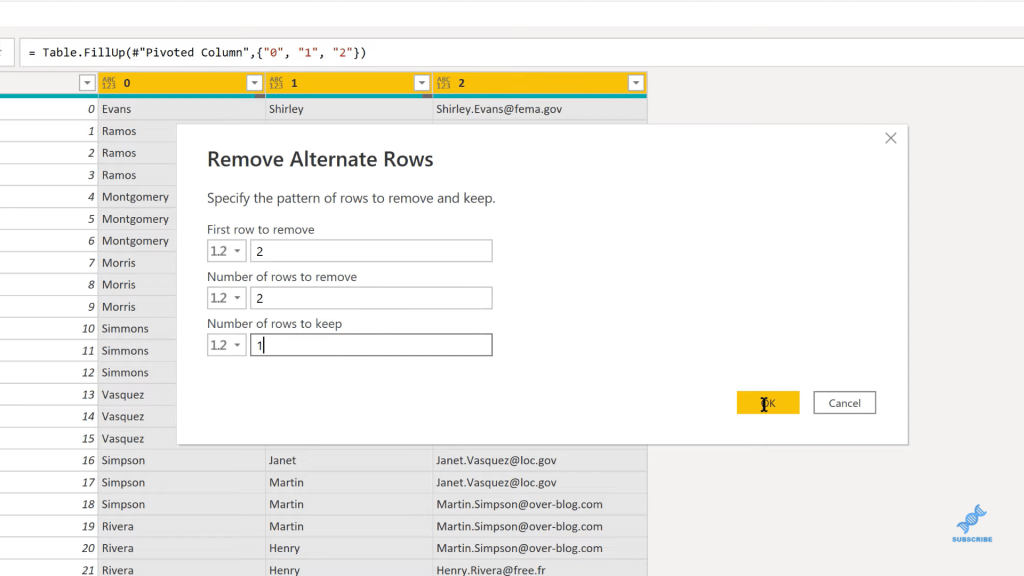
We can easily get rid of that by removing alternate rows. We can do that in the Remove Rows option.

We can say the first row to remove is two. Then remove the second and third row, and then keep the fourth and do that as a repeating pattern.
You can now see we’ve got all the correct data cleaned in a nice way and we’ve still got the 28 original email addresses.
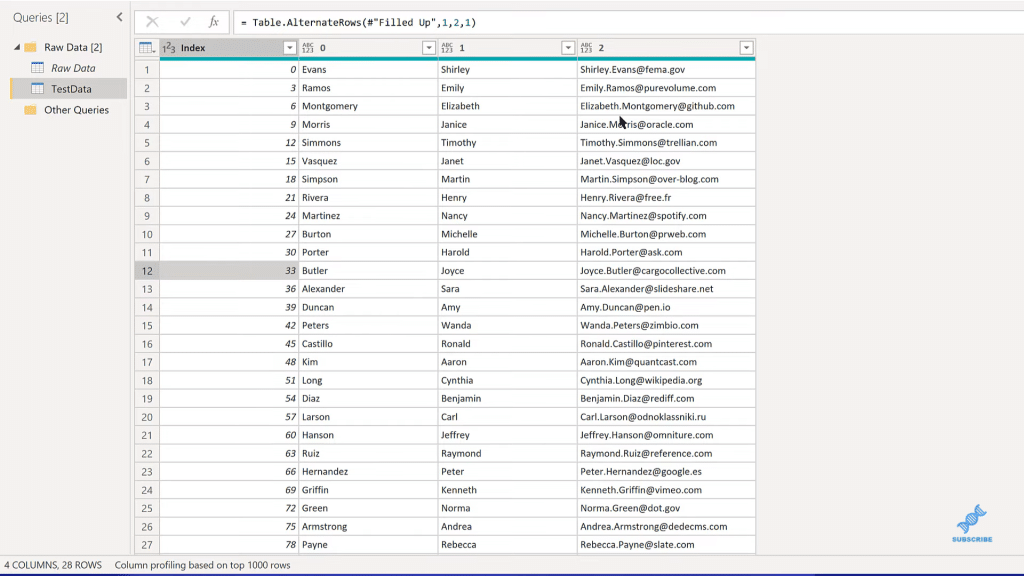
Now we can get rid of the Index column and rename the column headers accordingly.
***** Related Links *****
Power BI Modulo and Integer-Divide DAX Functions
Power Query Best Practices For Your Data Model
Power Query M: Alternating 0-1 Pattern In Date Table
Conclusion
You can see that with just the Modulo trick, and then pivoting the data and with a little bit of cleaning, it’s quite easy to do. Once you get the hang of it, it probably only takes about a minute to do the whole thing.
So, hopefully, this has given you a few more ideas and tools. You can also check out my next tutorial. In that, we’re going to take a further look at some of the things we covered in this tutorial and also look at how we can automate this process in a repeatable way, using custom functions. I’m going to show you some cool tricks for debugging your custom functions as well.
I hope you found that helpful. You can watch the full video below and check out the links below for more related content.
All the best!
Brian
[youtube https://www.youtube.com/watch?v=iK3elM1arOk&w=784&h=441]


