In this tutorial, you’ll learn the basics of coding using R and RStudio. You’ll also learn how to easily set up RStudio and R in Power BI.
RStudio is a great integrated development environment (IDE). It’s a one stop shop for all your coding needs.
RStudio includes a source code editor that allows you to work with scripts. It also has nice features like auto complete which is similar to IntelliSense in Power BI. Coding is also more organized in RStudio because of its syntax highlighting that shows different colors for specific functions and objects. In addition, it also includes some debugging tools similar with the VBA in MS Excel.
RStudio is a convenient place to develop your code compared to a standalone R program.
Getting Started With RStudio
When you open RStudio for the first time, you’ll see three windows.
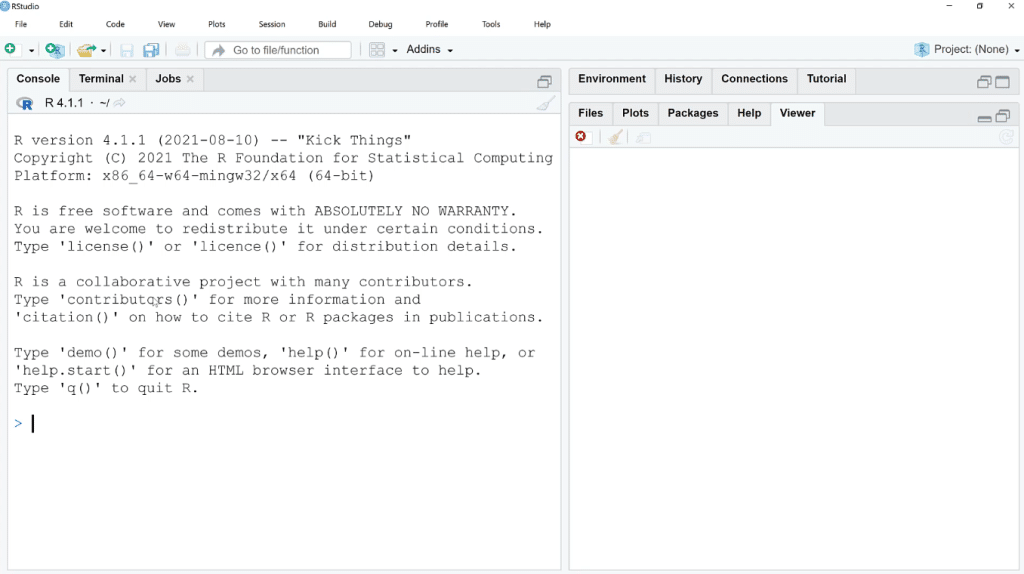
The Console is where the R code is executed and run. Here’s a basic example: if you input 1 + 1 and hit enter, you’ll get the answer 2.

If you input a range reference like 1:50 and hit enter, you’ll get a list of numbers from 1 to 50.

The numbers in the square brackets are placeholders for the index position of the numbers you executed.
Other than basic arithmetic and shorthand operators, you can also use functions. Some of these functions can also be used in Power BI. For example, if you take the square root of 25 by typing sqrt 25 and hit enter, you’ll get the answer of 5.

When you work inside an R script, you need to make sure to save it. Once you delete it without saving and back out of a session, the information is gone for good.
Moving on, if you want a long-term record R script, you can use the keyboard shortcut Control+Shift+N. With that, a fourth window emerges from RStudio.
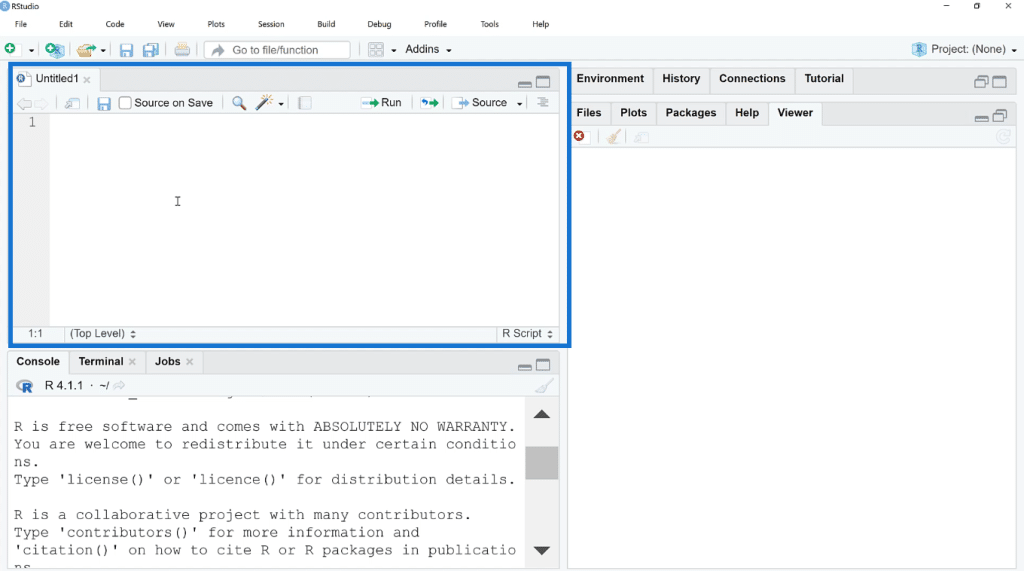
In the new window, when you input a function like sqrt, you’ll see a syntax completion tool.

When you complete the syntax, and for example input sqrt(25), select the option Run. You’ll see that all the functions will be executed in the Console window. You now have a long-term record of the R Script you just ran.

If you have more than one operation, RStudio will follow the standard order of operations.

Using The Help Documentation In RStudio
If you’re not sure about a function and want to learn about the arguments that it takes, you can use the question mark operator (?). As an example, let’s look at the Help documentation of the plot function by typing ? plot.

Once done, click Run. You can also use the default keyboard shortcut, Ctrl+Enter. You can change default keyboard shortcuts by going to Tools and then selecting Modify keyboard shortcuts.
The R code you’ve highlighted or where the cursor is placed is what will be executed when you Run.
Once the ? plot code has been executed, you can see that the Help documentation appears on the right-side window.

In this example, select Generic X-Y Plotting. This will redirect you to different content. Scroll down to see examples of how to use the Generic X-Y plotting using the Plot function.

Copy an example and paste it onto the R Script.
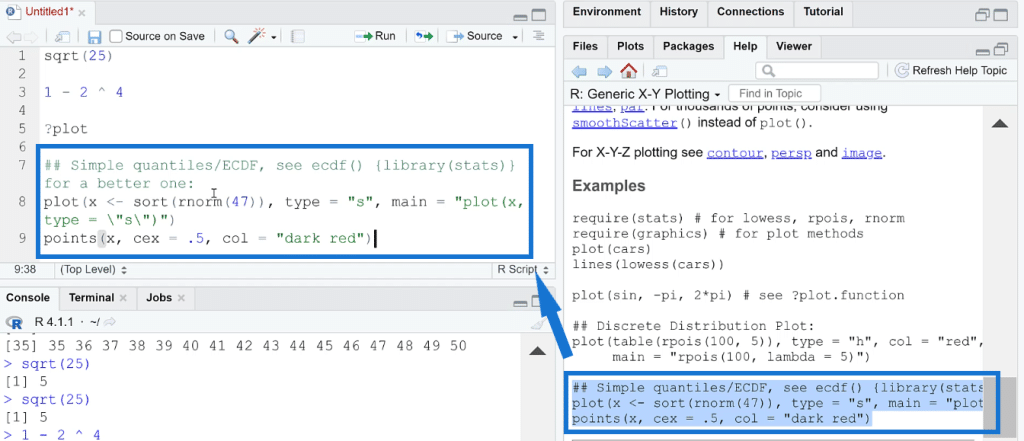
Comments in R are notated using a number sign or hash mark (#). When you Run the code after the comment, you’ll see a plot under the Plot window.
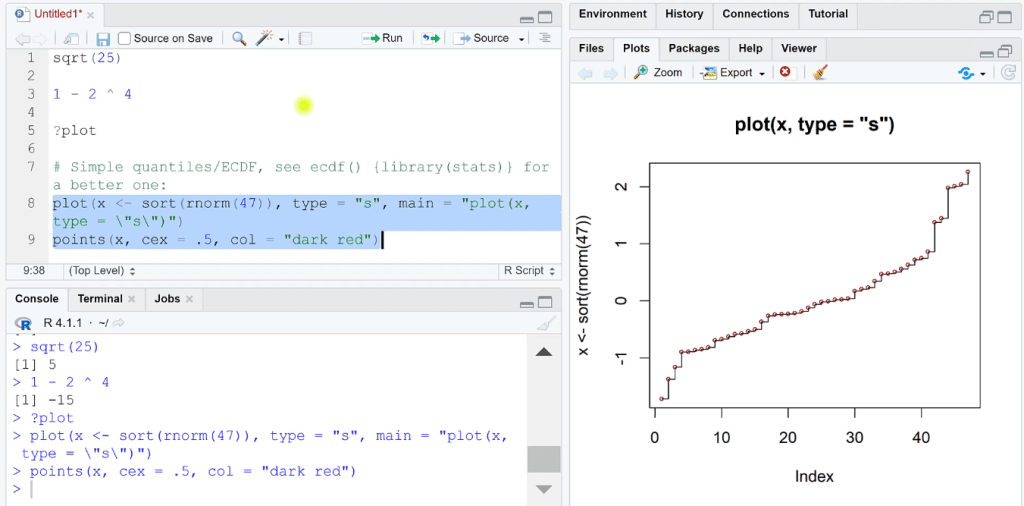
Remember to always save your work.
To add, another window in RStudio is the Environment window. When you click this, you’ll see an x. The x you see under Environment stores the values that are the result of the last sample code you ran using the Plot function.

How the Environment window works will be discussed in the next tutorials.
Setting Up Power BI With R And RStudio
Power BI With R
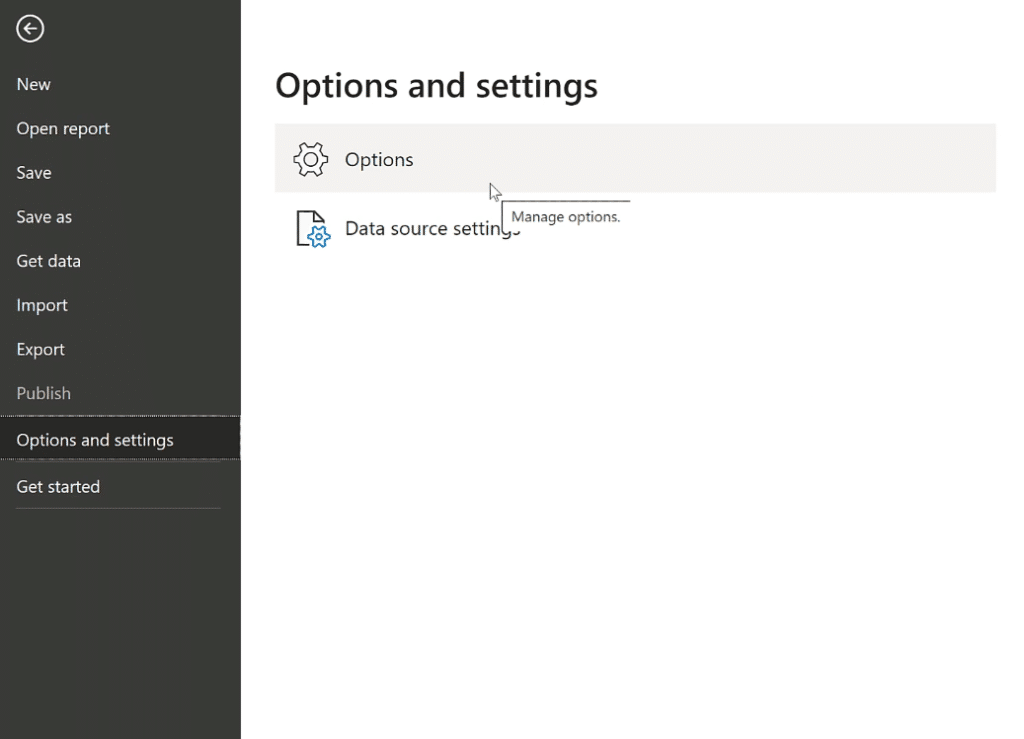
After the brief introduction of RStudio, let’s proceed with how to configure R in Power BI. First, open Power BI on your desktop. Go to File and select Options and settings. Then, select Options.
An Options menu will then appear on the screen. Under Global, go to R scripting. Choose the R version you want under the Detected R home directories drop down box.

If in case you don’t see the version you are looking for, select Other. Then, set the R home directory.

To locate the home directory, open your RStudio and go to Tools. Then, select Global Options.

In the pop-up window, you’ll see a file path under the R version box. Copy this and go back to Power BI.

Paste the file path in the set an R home directory box.
Power BI With RStudio
Once that’s done, the next step is to select an IDE as seen in the second drop down box. The best IDE to use is RStudio.

After you’ve set everything up, click Okay. Now, you’re all set to use R and RStudio in Power BI.
***** Related Links *****
R In Power BI: Downloading R And RStudio
Upcoming Course: Basics Of R For Power BI Users (Part 1)
Python In Power BI: How To Install And Set Up
Conclusion
R and RStudio are great complementary tools to use in Power BI. They are especially useful when dealing with statistical data and analysis. Configuring them to work with Power BI is quick and easy.
Though it will need some time to get used to the R and RStudio interfaces especially if you’re new to coding. But don’t worry, there are plenty of tutorials on how to use R with Power BI. Make sure to go through them diligently.
George


