
In today’s blog, we will continue our discussion on Quick Measures Pro. In Part 1, we talked about the out-of-the-box applications of this external tool, and today, you will learn how to navigate Quick Measures Pro. We will look at Quick Measures Gallery and Analyst Hub, two powerful Power BI solutions that make data analysis easier and better.
Quick Measures Pro is a powerful external tool that allows you to easily create and apply calculations to your data, without the need for complex formulas or programming. Whether you’re a beginner or an experienced user, quick measures can save you time and effort, while also providing you with more accurate and meaningful insights into your data. You can watch the full video of this tutorial at the bottom of this blog.

Power BI Solutions: Quick Measures Gallery
Quick Measures Pro is part of Enterprise DNA Power Tools Suite created by Greg Deckler. These tools help to speed up the development of your reports and automate a lot of common functions.
In the Quick Measures Gallery, there are 200 tools that you can use for your report. Many of them are straightforward in terms of what they do, such as the Polar to Cartesian, Running Products, Simple Aggregation, and Subtraction.
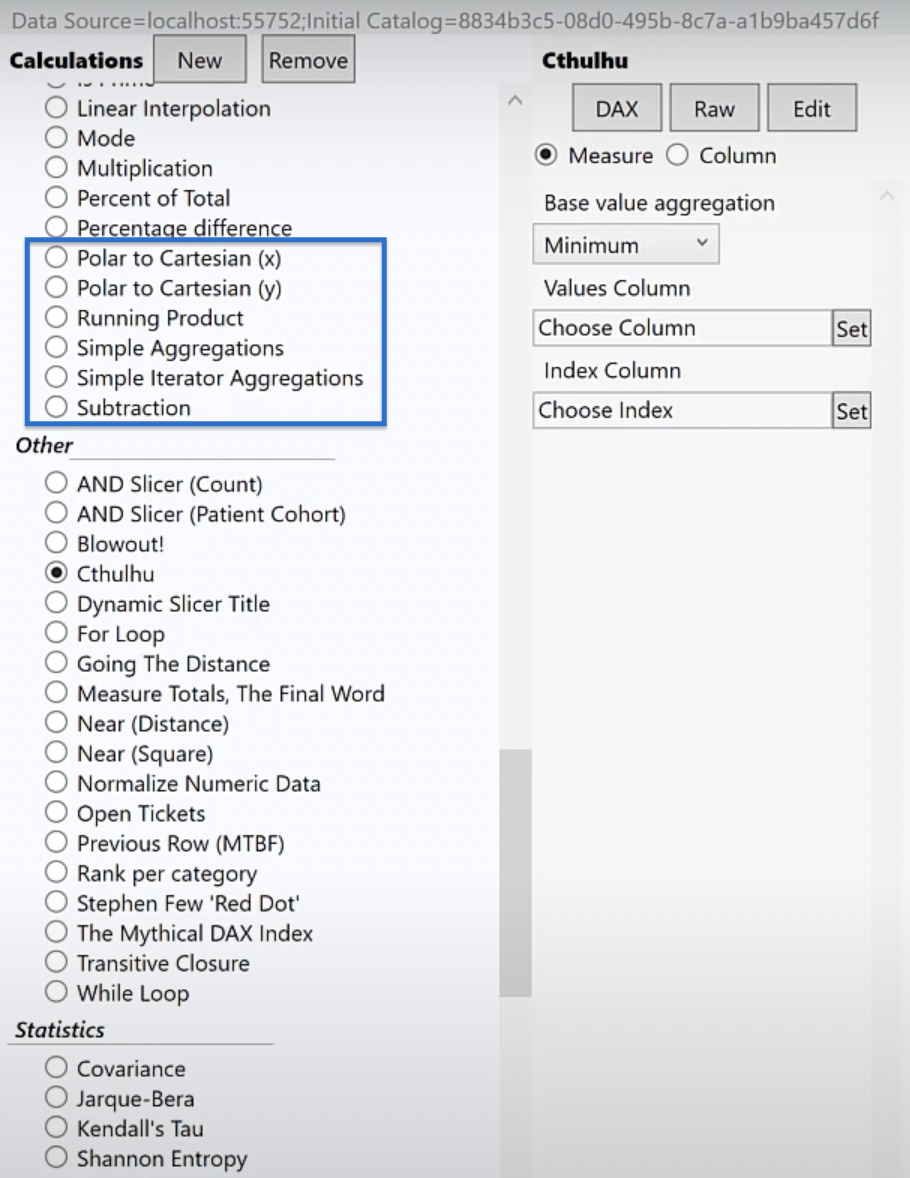
However, there are also others with functions that are not clear right away. For example, we have the Jarque-Bera, Cthulhu, and Blowout!.

To help you understand these tools, Greg provided an overview of their functions. For example, let’s use Cthulhu, one of his most popular tools on the Microsoft Quick Measures Gallery.
Choose Cthulhu from the list. Then, click DAX to show the DAX Code. You can read the Notes beside the code which provides a description of what this quick measure does. For example, we can see that Cthulhu is a resetting counter based on an index column.
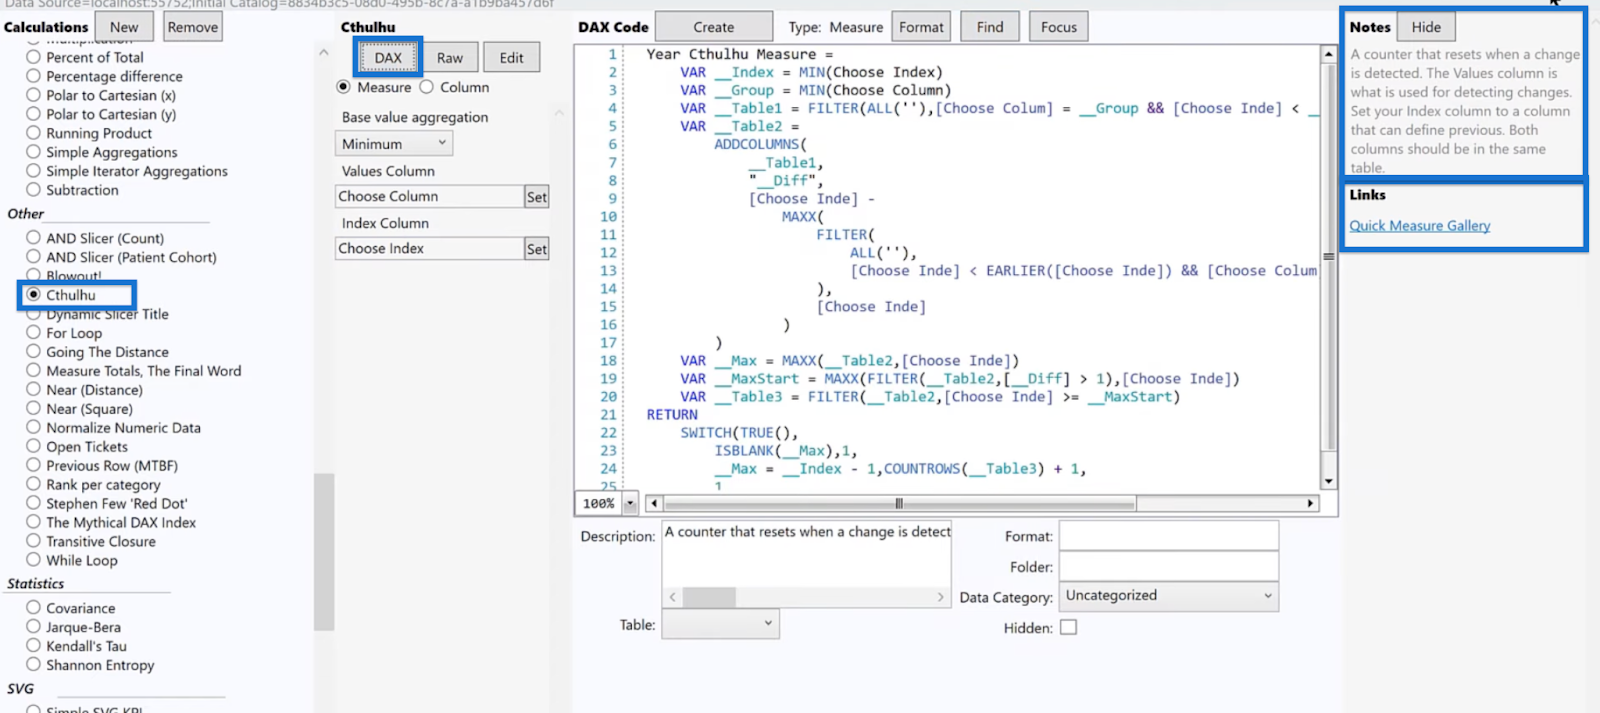
If you need further help, you can use the link to the gallery. Let’s give it a try by clicking the Quick Measure Gallery link.
On the resulting page, you can see that this tool has more than 25,000 views and an extensive description. You have the DAX Code required and an additional link that you can use as a reference to better understand the ones that are not immediately intuitive.


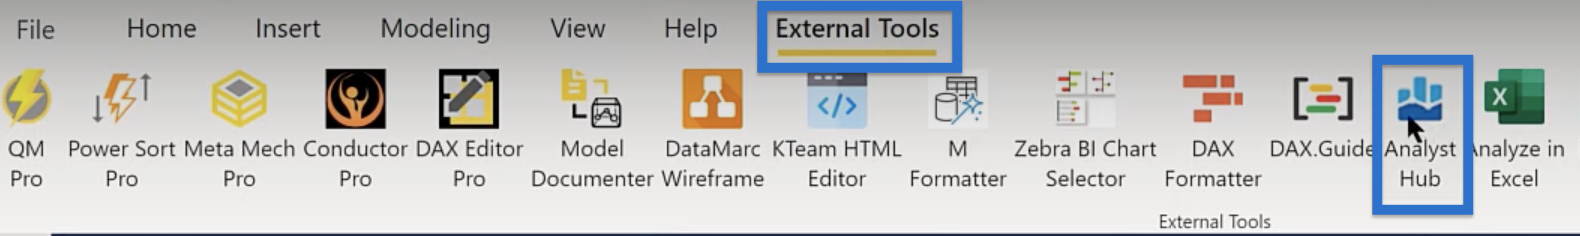
Power BI Solutions: The Analyst Hub
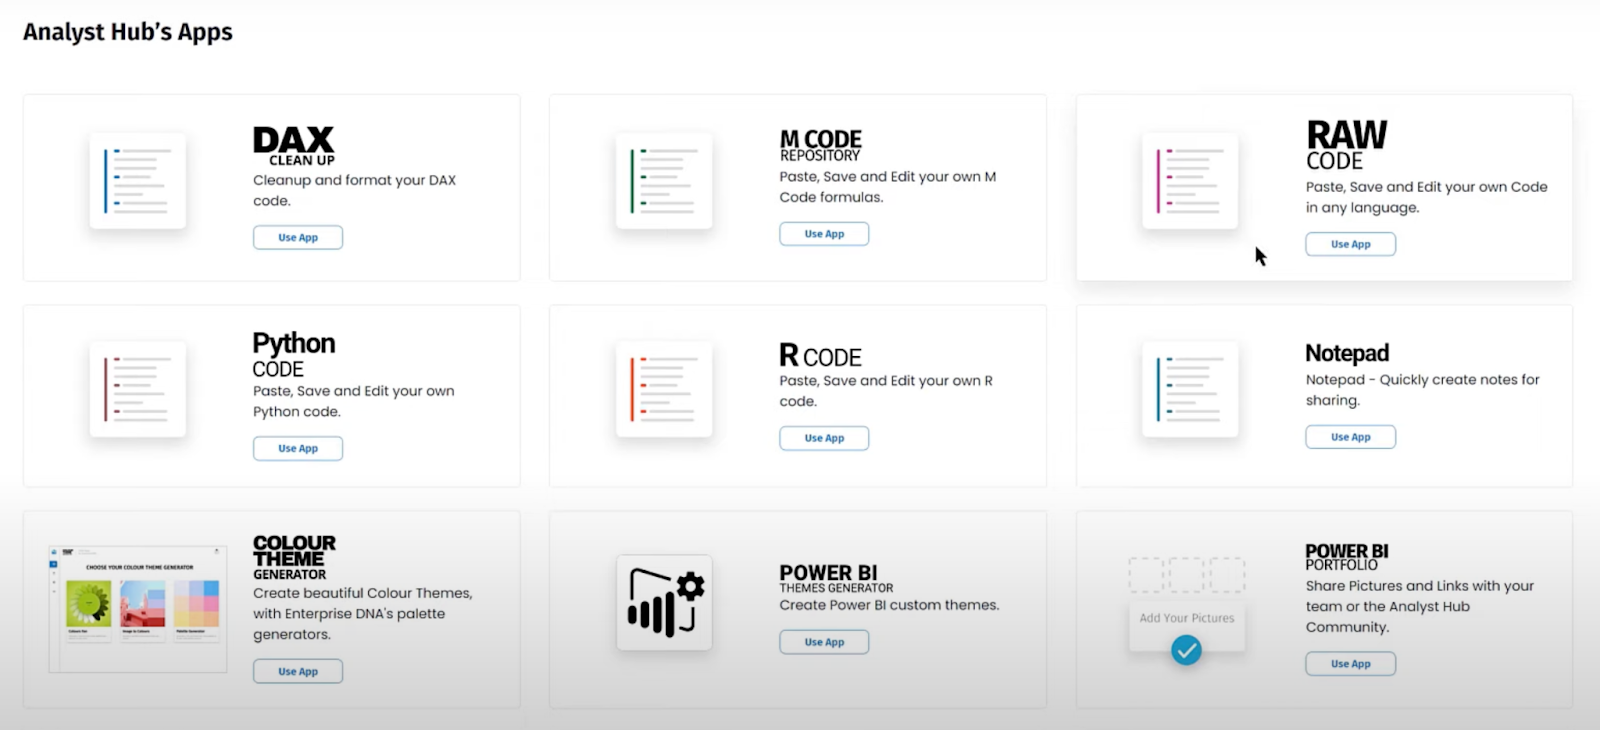
One of the best ways to create a custom quick measure is to use the Analyst Hub, an incredible tool that is available to Enterprise DNA members.
Analyst Hub contains code repositories for DAX, M, RAW, Python, R, and more.
What many users do is collect the common DAX measures to be used for their own reports.
For example, if I go to Documents, we can see that I’ve saved 33 DAX measures that I frequently use.

We can also go to Community and see that there are 367 DAX measures contributed by other users. You can take any of these measures and save them in your own library.

***** Related Links *****
Power BI Quick Measure Feature
Quick Measures – How To Use Them In Power BI Models
Elevate Your Color Palette Via The Analyst Hub Community
Conclusion
In conclusion, the Quick Measures Gallery and the Analyst Hub are powerful Power BI solutions that can greatly enhance your data analysis and visualization capabilities. The Quick Measures Gallery provides a wide range of pre-built measures that can be easily applied to your data, saving you time and effort.
The Analyst Hub, on the other hand, gives you the freedom to create your own custom measures and share them with others. Together, these tools can help you navigate the complex world of data analysis with ease and confidence.
Whether you’re a beginner or an experienced user, taking advantage of the Quick Measures Gallery and the Analyst Hub in Quick Measures Pro can help you unlock the full potential of Power BI and make better data-driven decisions.
All the best,
Brian Julius


