
In this tutorial, we’ll discuss essential transformations within Power BI Query Editor that can be used to optimize your rows and columns. In developing an intuitive Power BI model, it’s best to simplify your rows and columns inside your table.
Optimizing your table is essential in creating visualizations, so you can easily recognize your data.
There are numerous row and column transformations that can be done in the Query Editor. First, we’ll learn about column transformations.
The quickest way to access transformations for a column is by right clicking on it. Then, all the main transformations that we can apply for that column will be displayed.

Creating A Channel Code Column
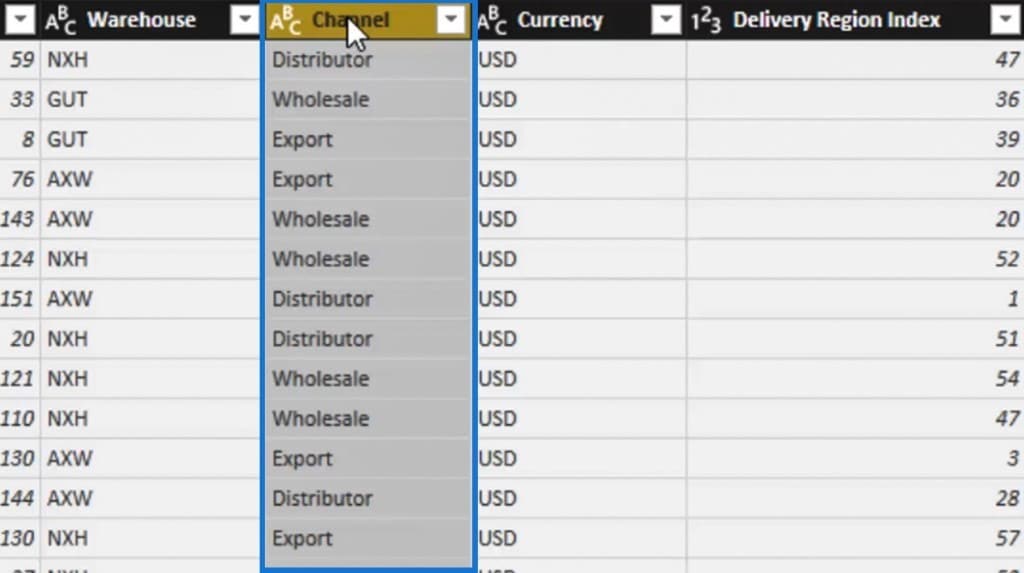
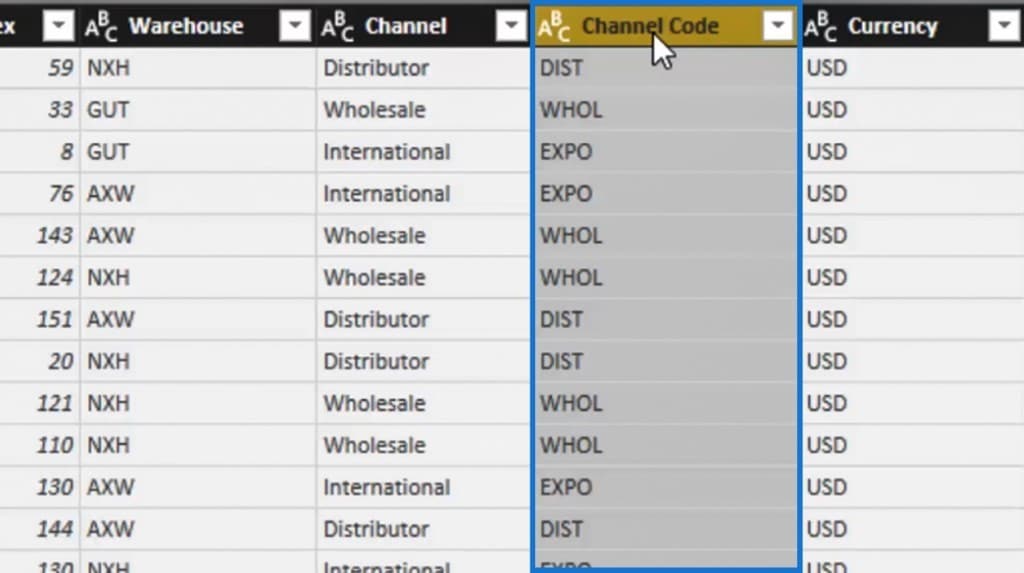
We’ll now start making some column transformations by adding a code or an abbreviated column for the Channel column. In line with that, we need to change the format of this column because we only want the first four letters of its values.
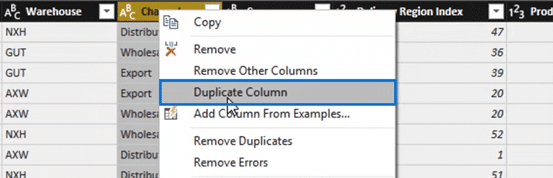
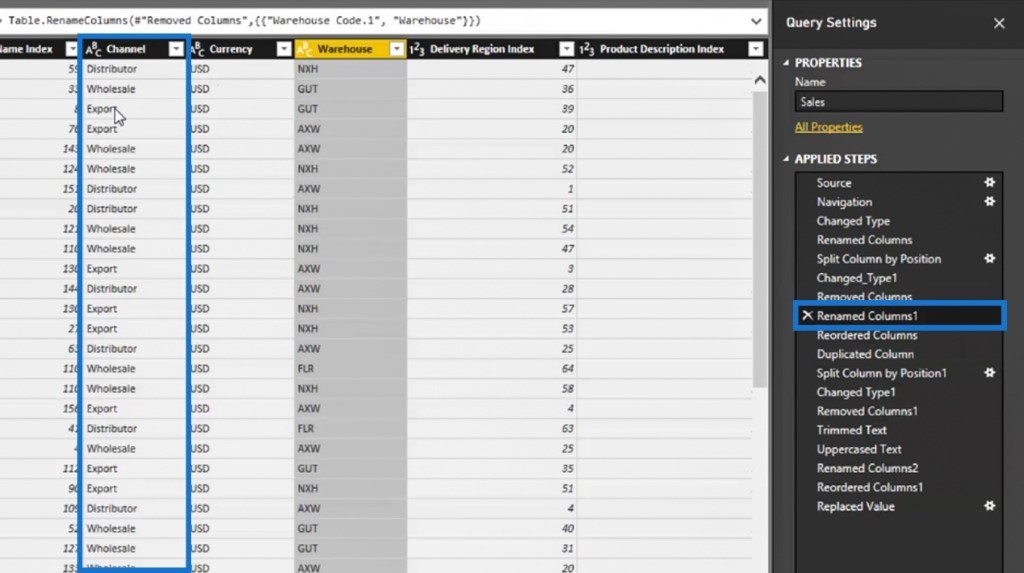
First, we’ll duplicate this column in order to retain the original Channel column. Right click on that column, then select Duplicate Column.
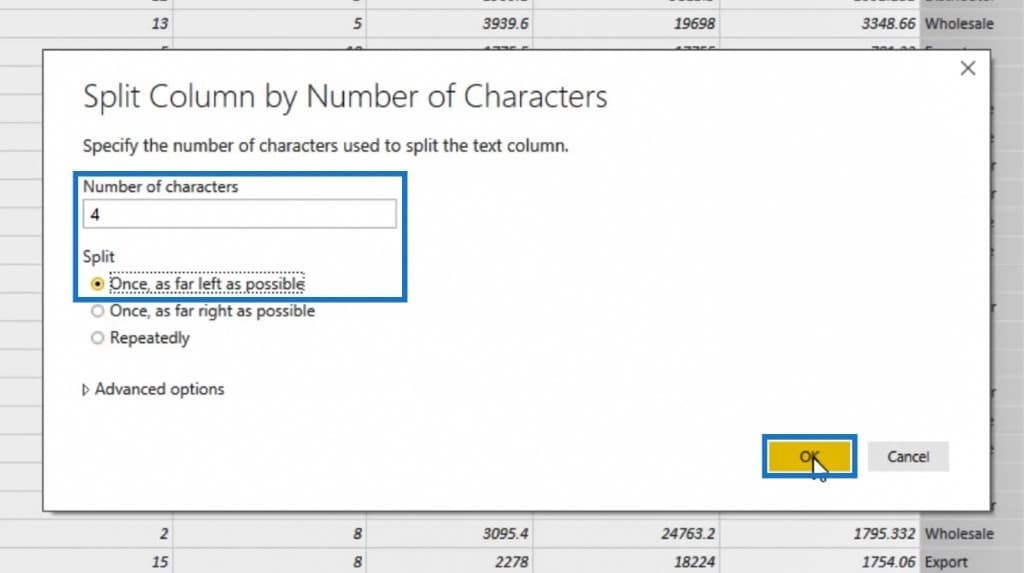
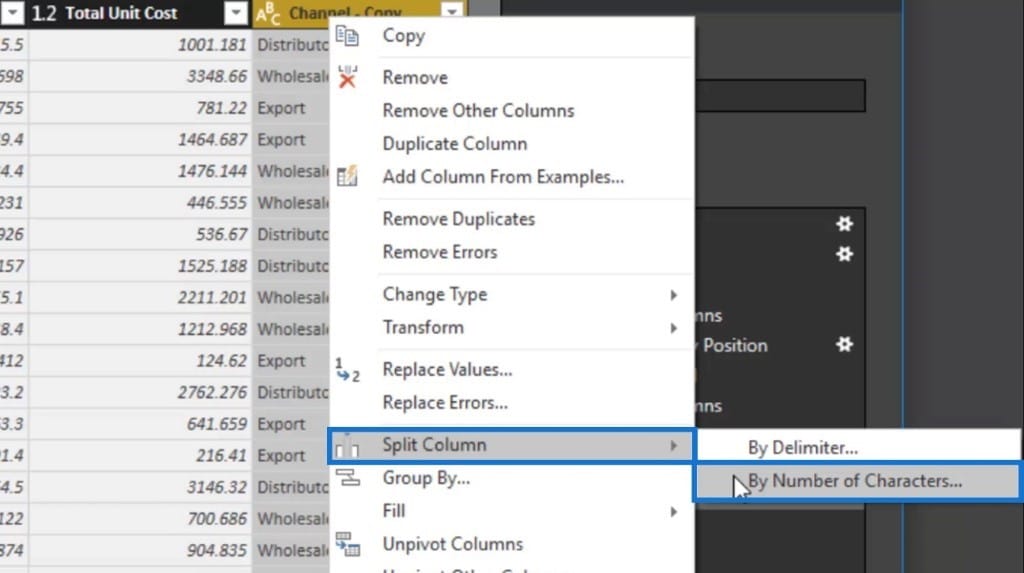
After that, right click on our duplicated Channel – Copy column and select the Split Column option. Within the Split Column, select By Number of Characters.
A popup window will then appear. Since we only want to keep the four letters of this column, we’ll set the value of the Number of Characters input to 4. Then, set the Split settings to “Once, as far left as possible”. To finalize the updates, click the OK button.
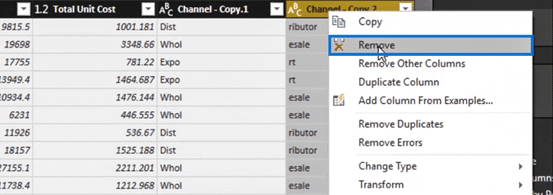
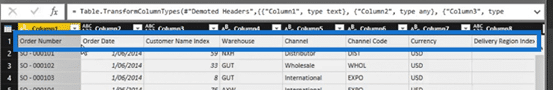
Now, it’s already separated into two columns. We’ll remove the other column that was created because we won’t be needing it anymore. Just right click on the Channel – Copy.2 column, then click the Remove option.
Let’s make another transformation here by right clicking on this column again, then select the Transform option. We’ll see that we have more options within Transform such as lowercase, UPPERCASE, and so on. In this scenario, we’ll use the Trim option.

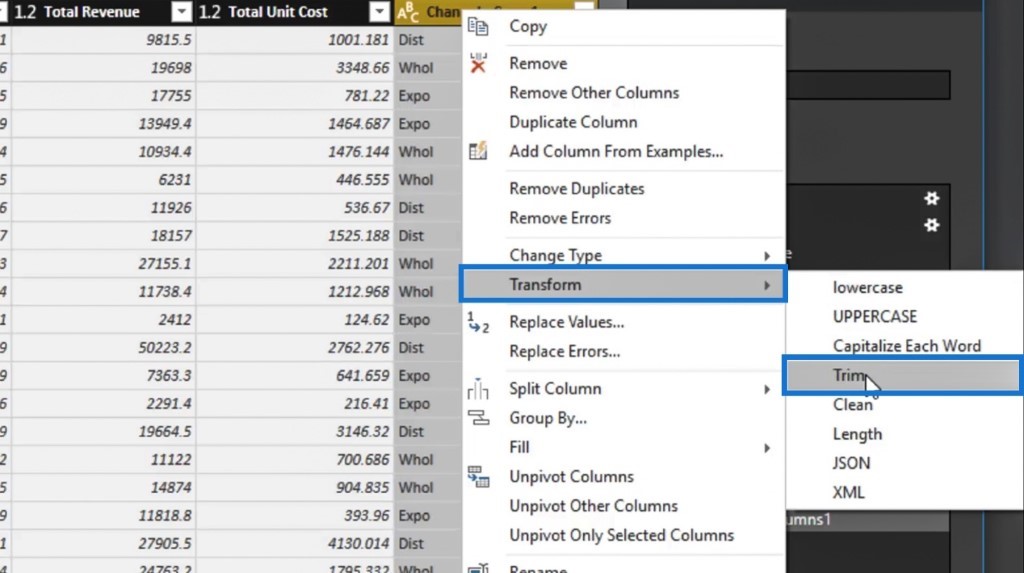
The Trim option removes any spaces on either the side of a particular word. So, let’s click the Trim option to clear unnecessary spaces within this column.
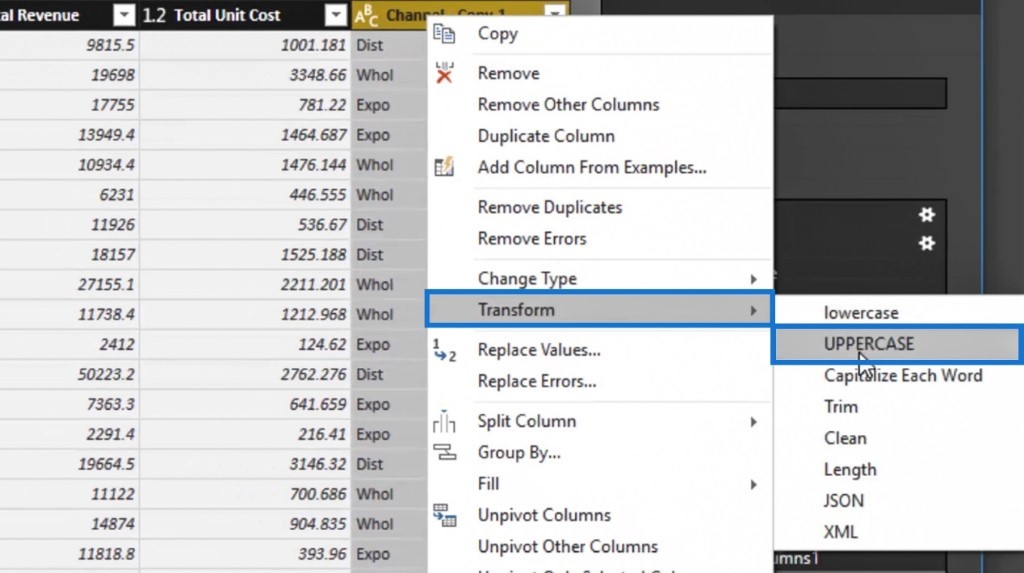
After trimming that column, let’s transform the content and change it to uppercase. Right click again on that column, then click UPPERCASE within the Transform option.
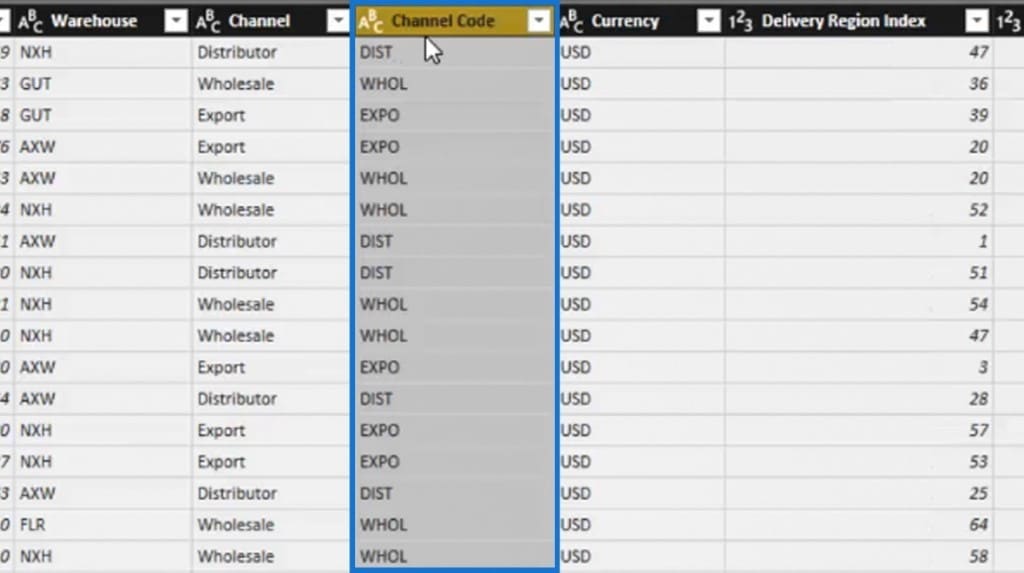
Let’s now rename that column into “Channel Code“. This will be a better name if everyone in our organization is more used to abbreviations or code names.
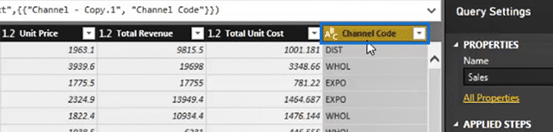
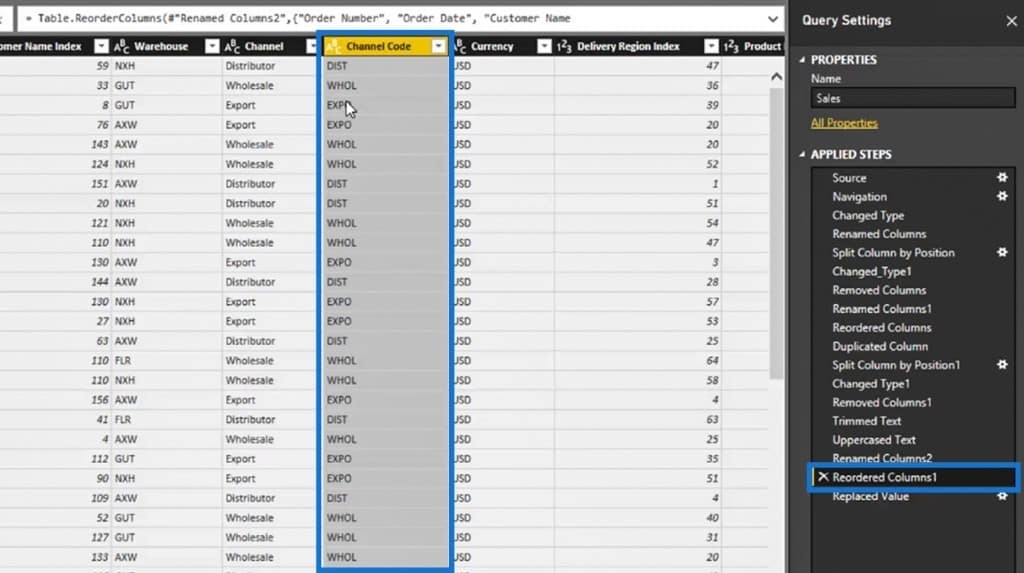
Lastly, let’s move our Channel Code column to the right side of the Channel column. We have now created a Channel Code column by using a different column transformation.
Using The Replace Values Option
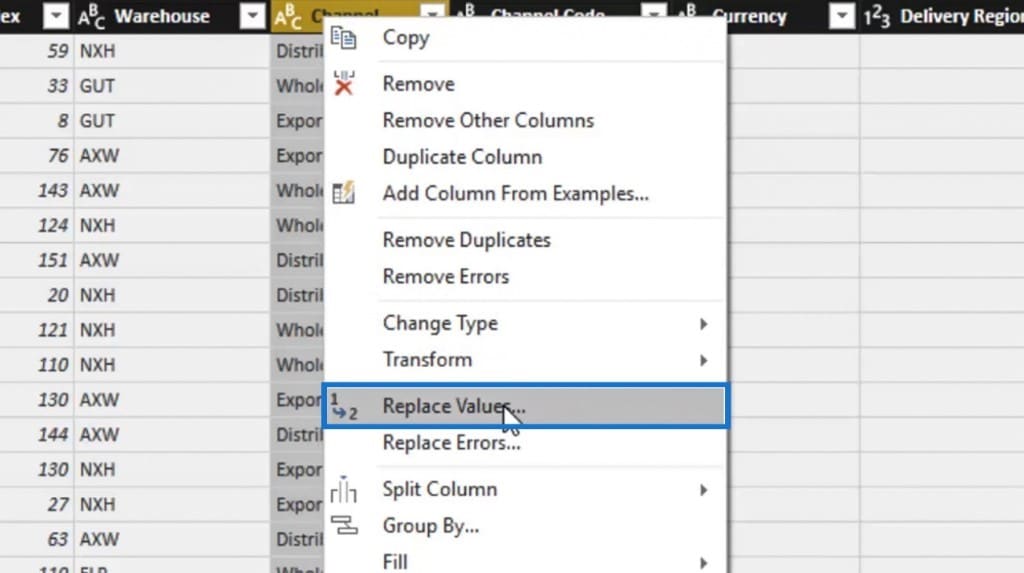
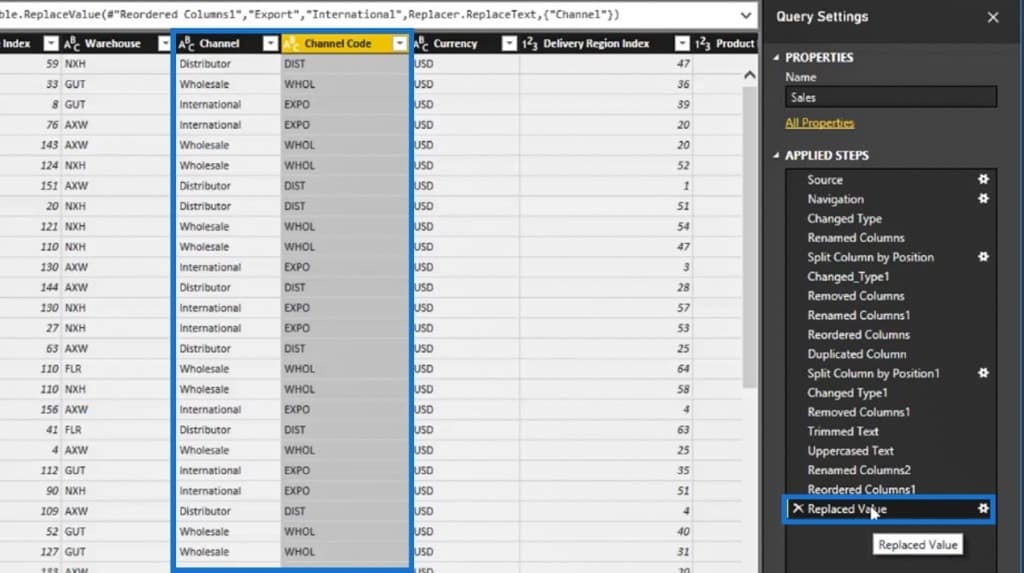
There’s also another powerful transformation that we can use in our columns, which is the Replace Values option. Let’s have an example to further understand this transformation.
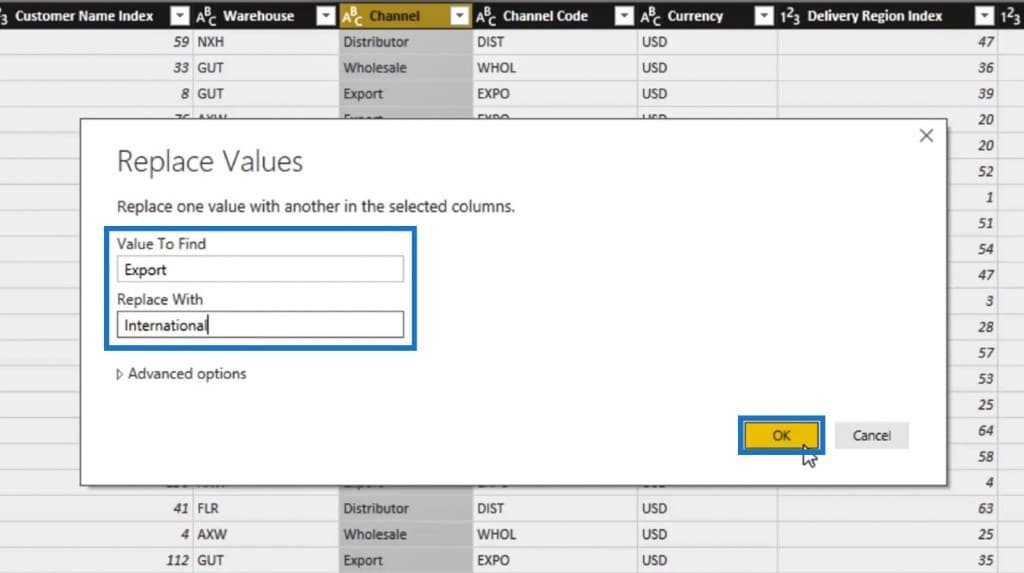
In our Channel column, if we don’t like the word Export from our set of values, we might want to call it International instead. So, let’s right click on that column and then click on the Replace Values option.
A popup window will then appear. Let’s type the word ‘Export’ in the Value To Find input, then type ‘International’ in the Replace With input. Click the OK button to apply the settings.
After doing so, all our Export values will be changed to International.
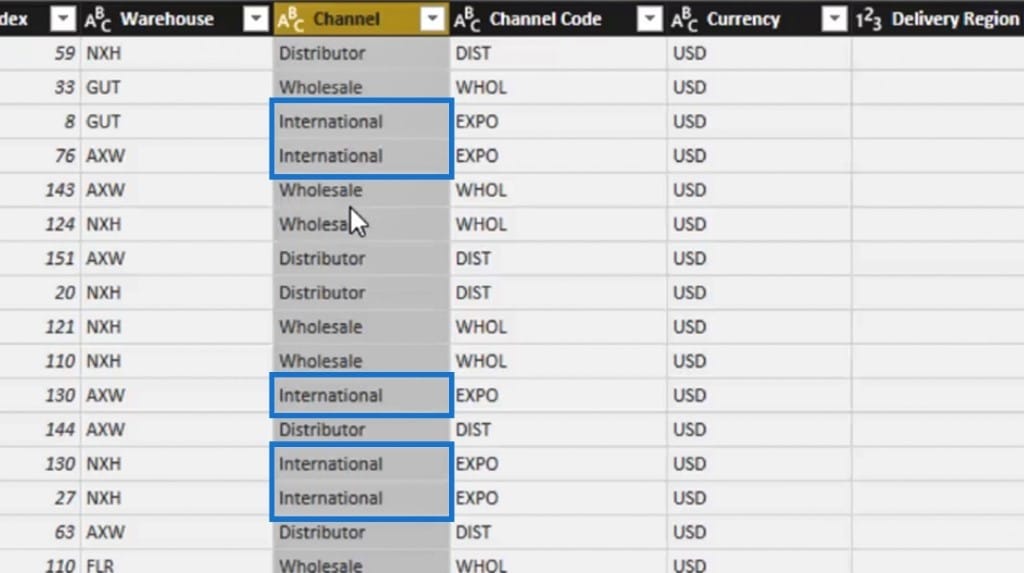
Take note that this doesn’t affect our Channel Code column.
This is the real power of sequential transformations within the APPLIED STEPS pane. Let’s go back to the previous steps by selecting Renamed Columns1. As we can see, the Channel column retained its first initial value.
Then, let’s click the latest Reordered Columns1 step and we’ll see that we changed it into an abbreviated value in another column.
Now, let’s click our latest step, which is the Replace Value. We’ll see that we can do another transformation after that, but it doesn’t affect anything before. This is because the query changes one step at a time. Therefore, we can change a lot of things inside any table.
Fixing The Data Type Of Numeric Columns
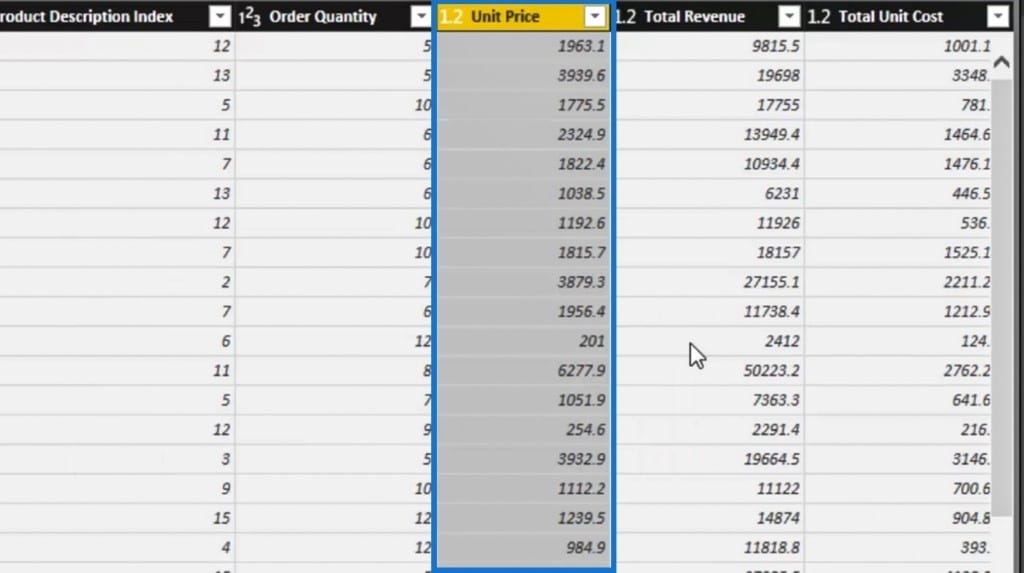
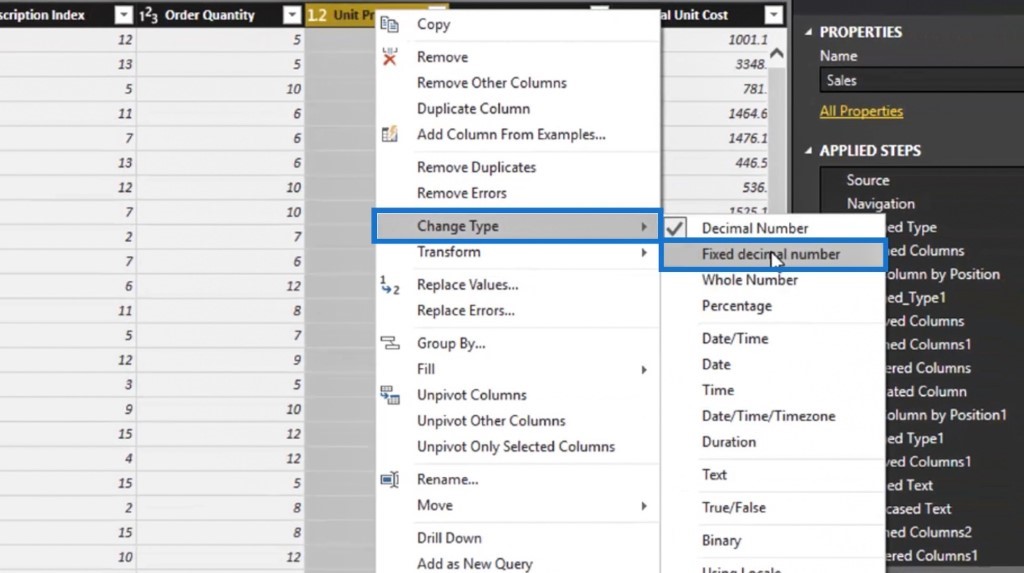
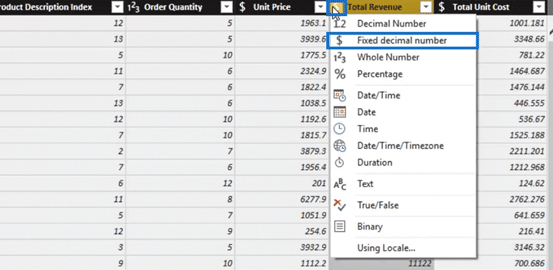
Let’s have another example of transformation in the query editor. If we take a look at our Unit Price column, this is where we might want to make a Change Type transformation. In this case, we’ll fix its data type because based on its data type icon, it’s being displayed as a decimal number.
Let’s fix the data type of this column by right clicking on it. Then, click the Change Type and select the Fixed decimal number option.
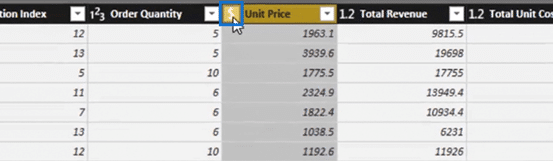
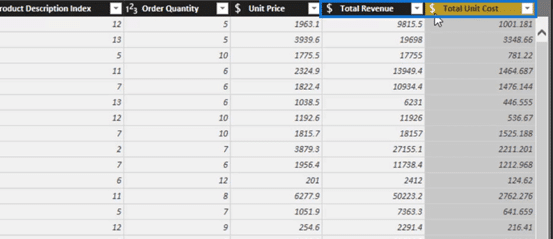
Instead of a decimal, the data type icon is now a dollar sign. This is much better because it’s representing the Unit Price.

Let’s also fix the data type of the Total Revenue and Total Unit Cost column by doing the same step that we did with the Unit Price column.
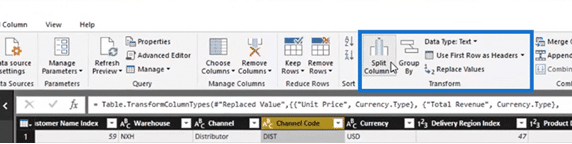
Another option that we can do to make a column transformation is by right clicking on the columns’ data type icons.
The good thing about this transformation is that this will be carried over to our table. Once we commit this data while it’s still in its other form, we have to turn our Total Revenue into an actual dollar, and we have to do that inside our model.
We can do various transformations using Group By, Unpivot Columns, Rename, and many more. You can also access some of these transformations here in the Transform ribbon. However, I prefer to right click on the columns instead to easily access all the transformations.
This is a good opportunity for us to become more familiar with all the different things that we can do in Power BI.
Using Excel or other tools for cleaning our data takes up a lot of time. When using Power BI, we can do a lot of dataset cleaning by combining all the different column transformation techniques that we’ll use. We don’t need to write any complex formula for it.
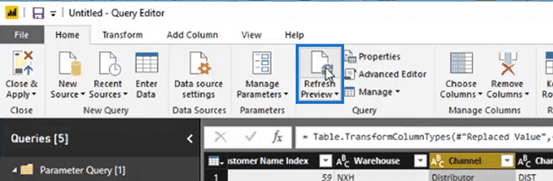
Click on the Refresh Preview option to refresh all the transformations that we’ve created.
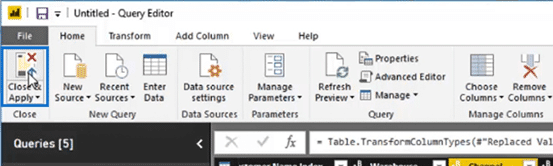
We can now publish our query by clicking the Close & Apply option within the Home tab.
It will then publish physical tables that are in a clean and optimized state. And that’s all for column transformations. The next thing that we’re going to discuss is row transformations.
Row Transformations In Power BI Query Editor
Row transformation doesn’t give us as many options as we have in column transformation. However, there are some specific purposes or unique occurrences where a row transformation could be useful.
The place where we will access most of the row transformations are not within each individual row. This is because right-clicking on a particular row will not give us transformation options.
What we can do is to go to the top left portion of this particular query. Then, click on the dropdown icon which will give us options. This is where we can do most of our row transformations.
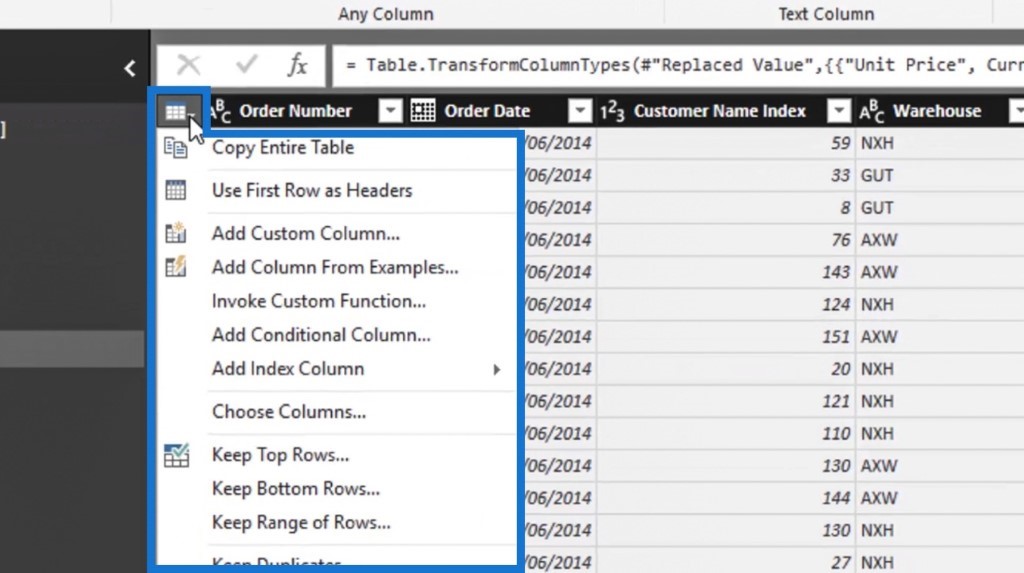
We can also access some of these transformations in the Transform tab.
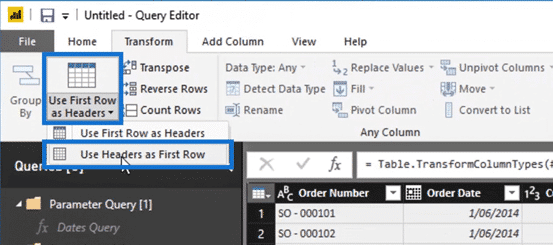
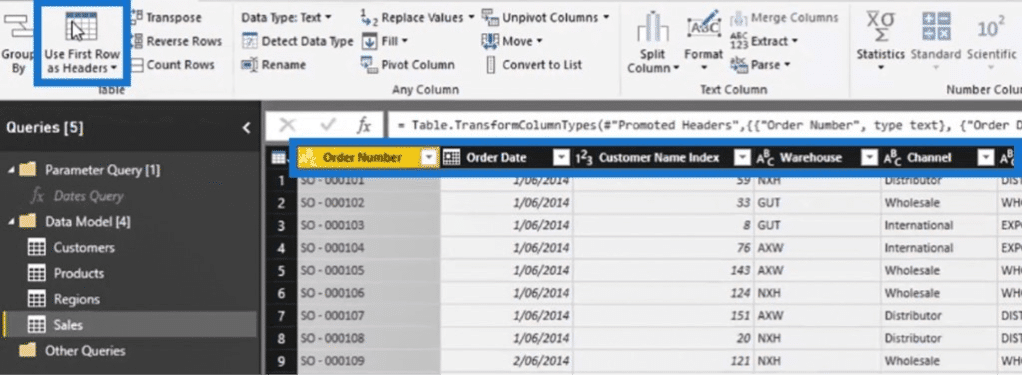
Let’s now try a few examples using row transformation. Usually, when we query a spreadsheet, our headers are most likely in the first row. As an example, let’s temporarily set our headers as the first row.
Click on the Use First Row as Headers option, then select the Use Headers as First Row.
Sometimes, we might get a type of query that looks similar to where our column headers are located in the first row.
We can change or fix that by clicking the Use First Row as Headers option. It will then set those headers from the first row as our actual column headers. And that’s one of the various row transformations that we can do.
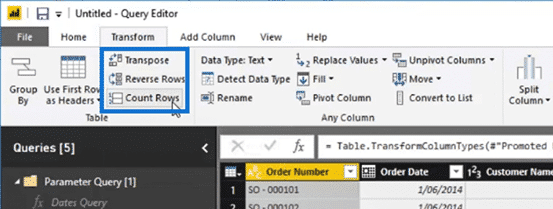
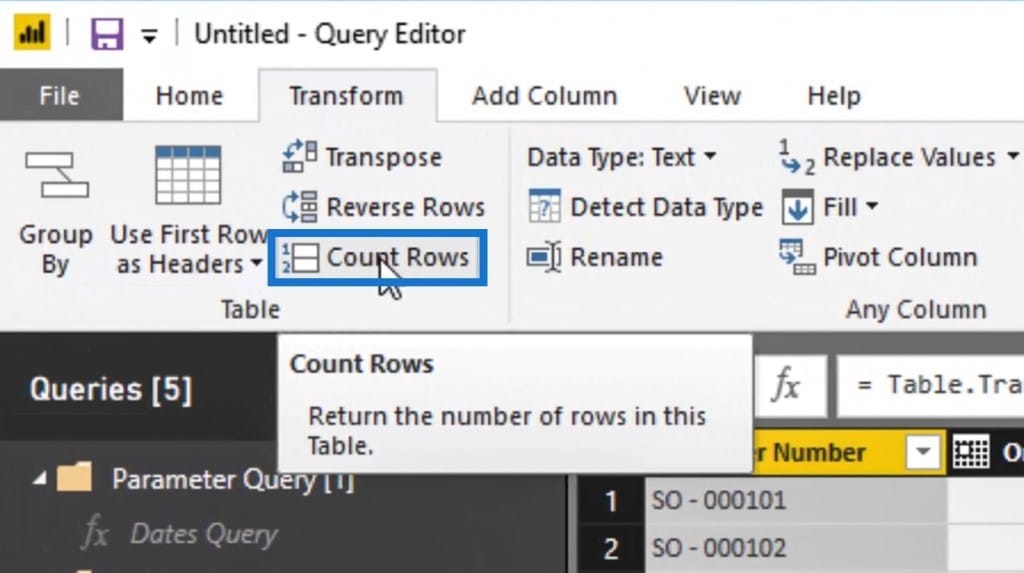
There are also other things like the Transpose, Reverse Rows, and Count Rows options that we can use in circumstances where these are applicable.
Using The Transpose Option in Power BI Query Editor
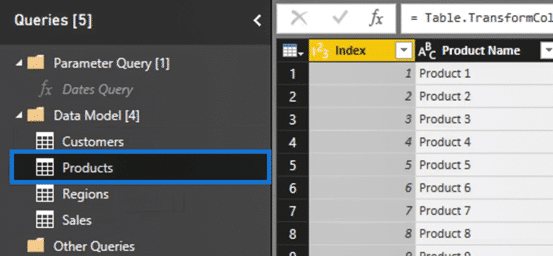
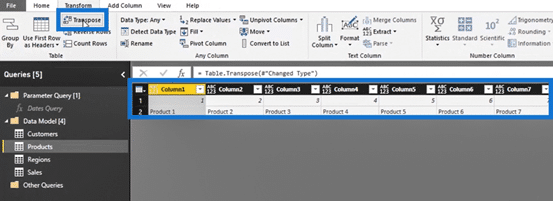
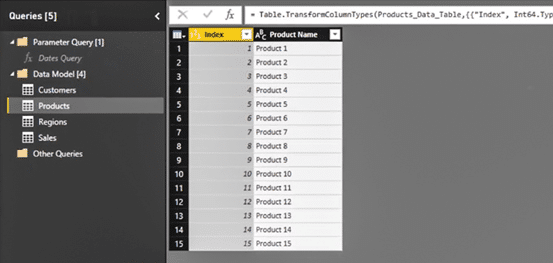
Let’s go to a smaller table like the Products table so we can try the Transpose option.
Then, click the Transpose option. This option switches up the row and columns of a table as shown from the image.

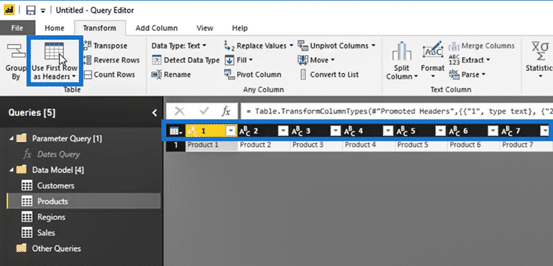
Let’s use the Use First Row as Headers option to set the first row as our column headers.
This example is not applicable here, but knowing the Transpose option can be useful especially if we’ll encounter an opposite scenario in the future where we need to switch the column and rows of a certain table.
Let’s now remove the transformations that we made in this table since we only did those as an example. In the APPLIED STEPS within the Query Settings pane, remove the Change Type1, Promoted Headers, and Transpose Table transformations by clicking the x icon beside them.
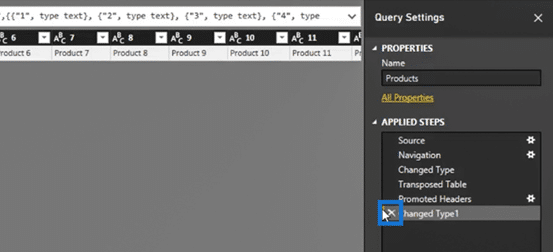
Our Products table should now go back to its original state. We can easily remove the transformations that we are trying for experimental purposes. Because of this, we can do and try as many transformations as we want.
Using The Reverse Rows And Count Rows Option
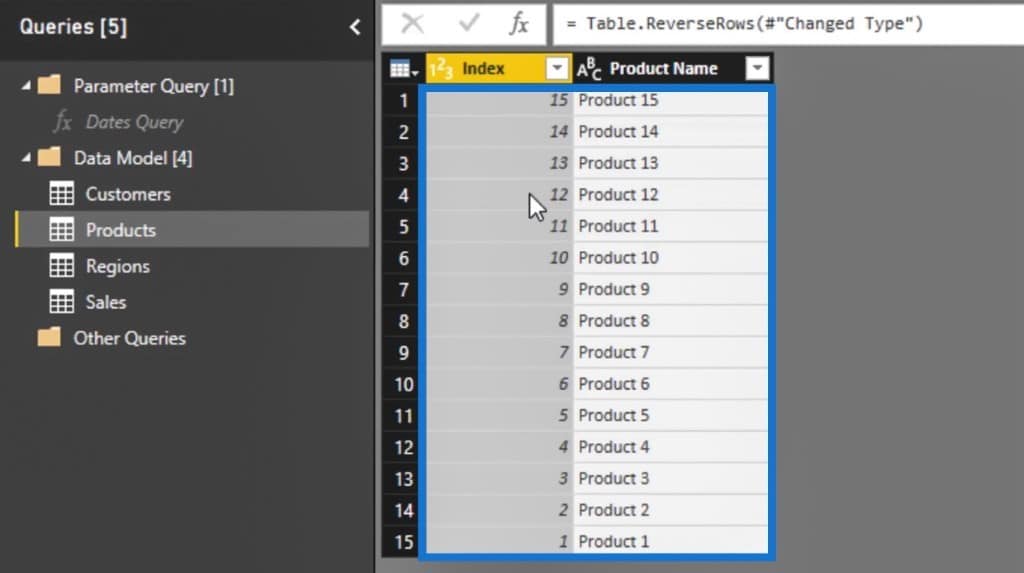
We can also use the Reverse Rows option. This can be useful when we want to make a sorting direction or if our data is structured in a reverse direction.
Let’s click the Reverse Rows and we’ll see that the values of our rows are now reversed. There could be certain reasons why we might want or need to use this transformation.
Let’s bring our table again to its original state. Just remove the Reversed Rows transformation in the APPLIED STEPS by clicking the x icon beside it.
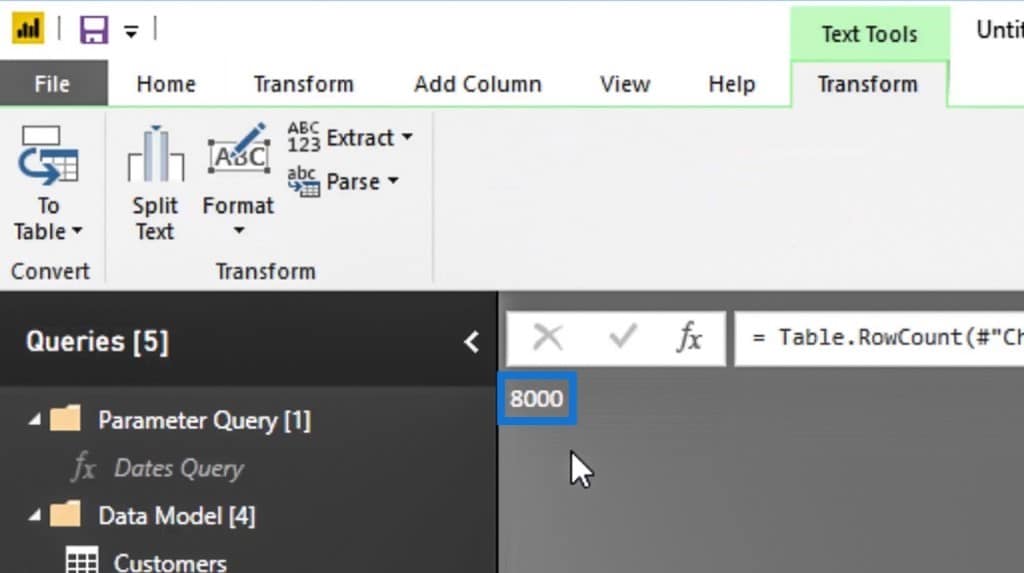
The other option that we can use is the Count Rows option. Let’s go to our Sales table to try the Count Rows option. We can use this option if, for example, we want to show the number of transactions we have.
Let’s now click the Count Rows option.
Then, it will show us that we have 8,000 rows or transactions.
Let’s remove that transformation again because we don’t want our table to permanently look like this. Just go to the APPLIED STEPS, then remove the Counter Rows transformation.
Using The Remove Top Rows And Add Index Column Option
Let’s now try the other available row transformations that we have. If we know that there are some redundant rows at the top of our data table, we can easily remove them by clicking the Row Transformation icon. Then select the Remove Top Rows… option.
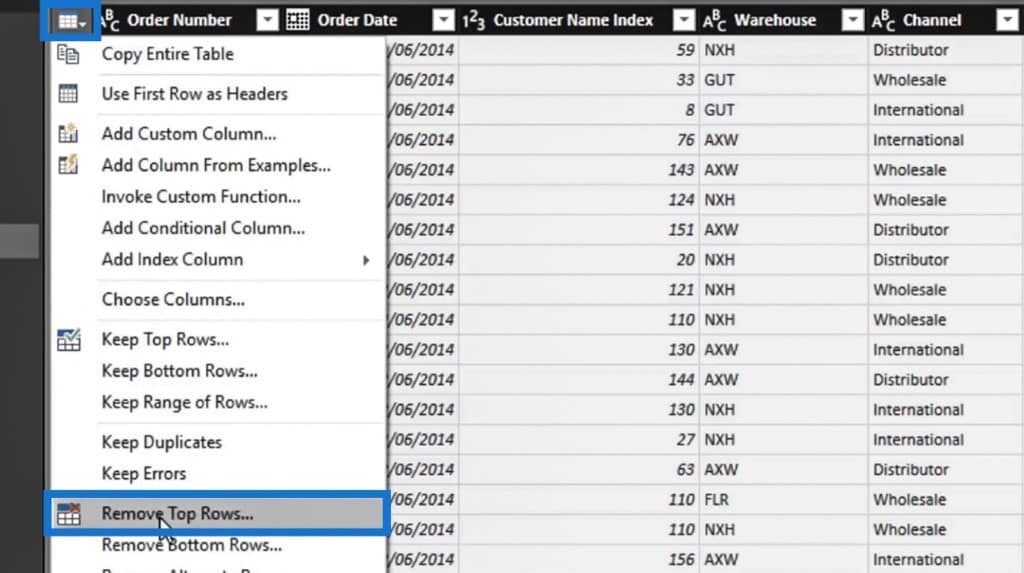
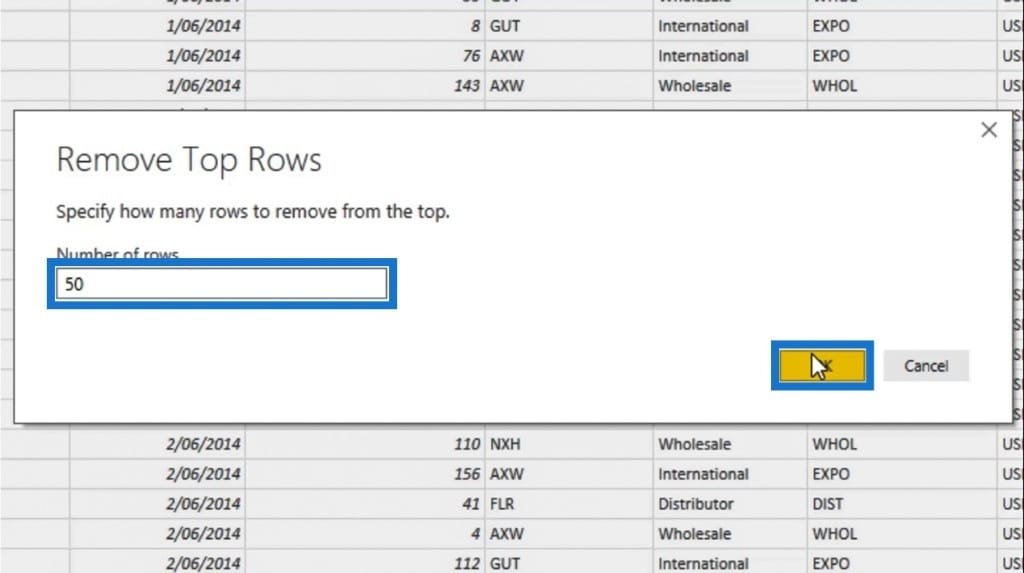
A popup window will then appear. We can now remove the top 50 rows of our data table by entering 50 in the Number of rows input, then click the OK button. And that’s another good row transformation that we can utilize.
Before trying the next transformation, let’s not forget to remove the sample Remove Top Rows transformation that we did.
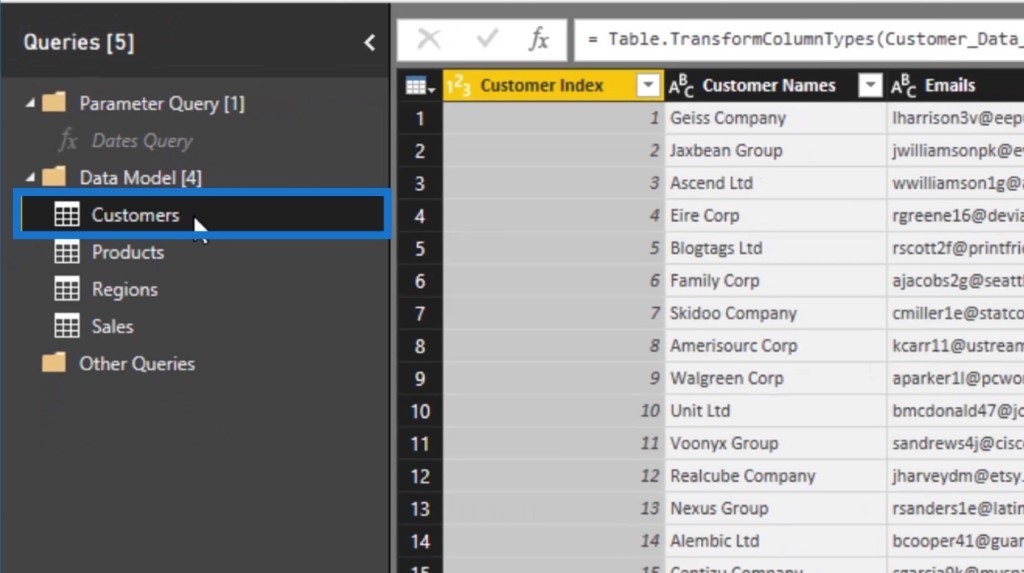
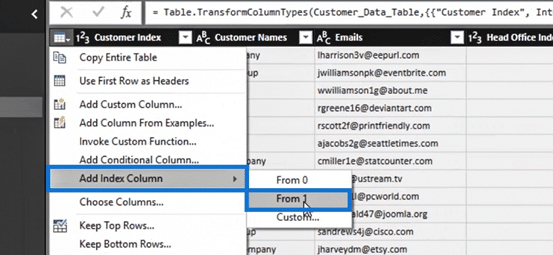
Another good transformation that we can use is the Add Index Column. We already have index columns in our tables. But, just to try it as an example, let’s go to our Customers table and use the Add Index Column option.
After going inside the Customers table, click on the Row Transformation icon, select the Add Index Column option, then select the From 1 option.
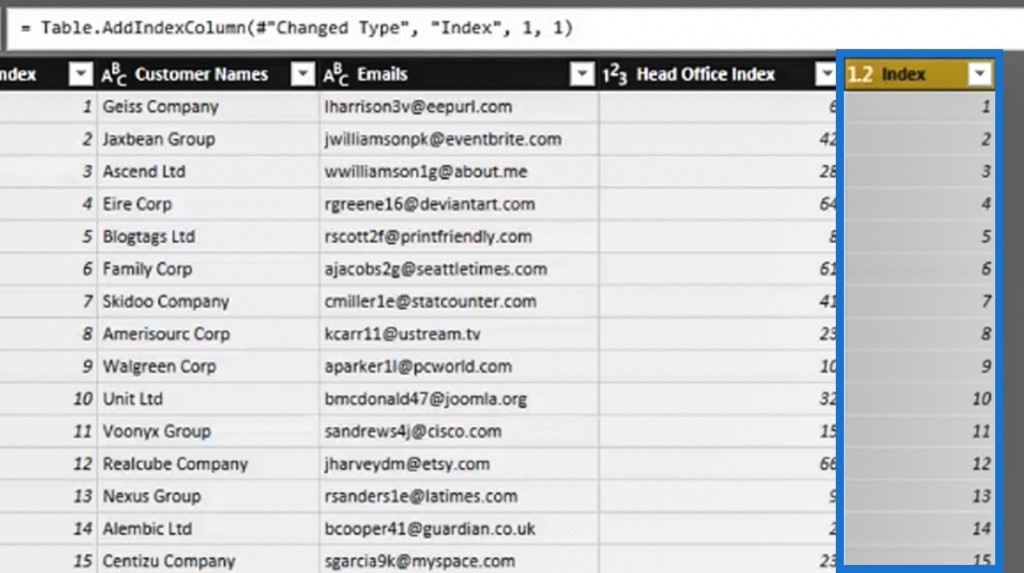
We’ll then see that an Index column was added. Let’s not forget to remove that transformation again because we don’t really need that in our Customers table. We just tried it as an example.
We also have other row transformation options that we can use like the Keep Bottom Rows, Keep Duplicates, Keep Errors, and so on.
As I’ve said, row transformations aren’t as developed as column transformations. However, there are some unique cases where these can be really useful.
***** Related Links *****
Row And Column Transformations In Power BI
Power BI Query Parameters: Optimizing Tables
How The Query Editor Works In Power BI
Conclusion
Another interesting thing about Power BI is that we can’t change anything individually in any particular cell or row. That’s because Power BI is all about columns and tables. That’s also the reason why column transformations are more detailed than any row transformation.
You’ll probably see some of these transformations in some of our articles. It’s essential to properly use them in combination with all the other different transformations. Hopefully, this tutorial helped you think about the importance of data transformation within Power BI.
All the best,
Sam


