Today, we are diving into what you could do in the Power BI formula bar in terms of syntax, comments, and variables.
These are all very important techniques that you could use in your work patterns. But before we jump into Power BI formulas, I’ll show you how I sort my Dates column within my visuals. You may watch the full video of this tutorial at the bottom of this blog.
Simplifying Presentation Of Dates
The first thing that I will do is to bring in the Dates table.
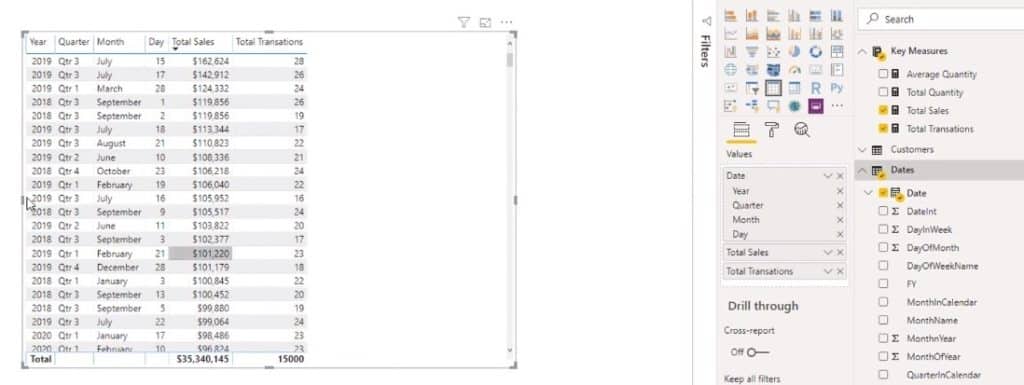
One thing that can be annoying with the Dates table is that it builds an automatic hierarchy into your table.
What I do is click on the drop-down menu and choose Date instead of Date Hierarchy.
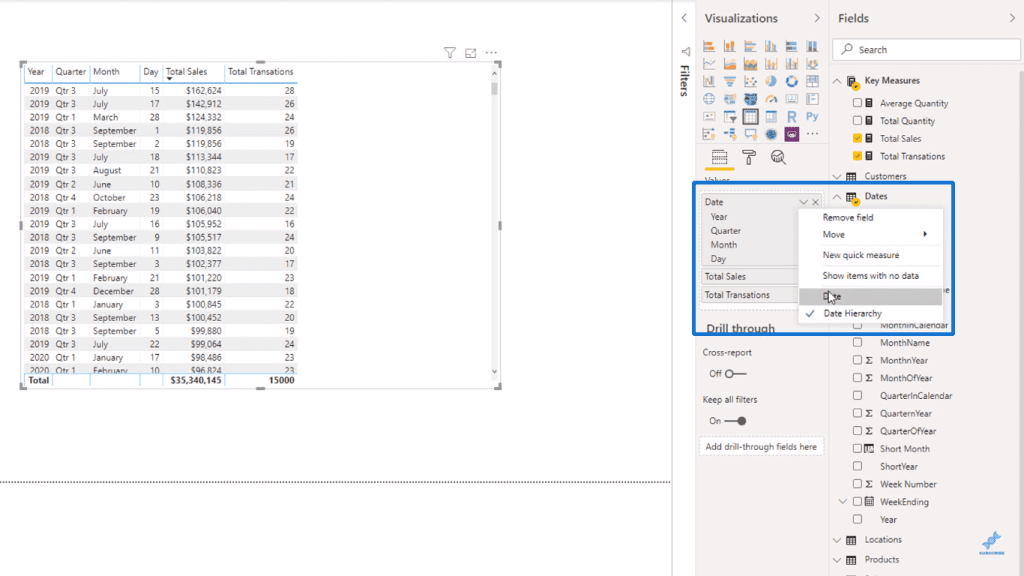
After that, you will have every single date in just one column.
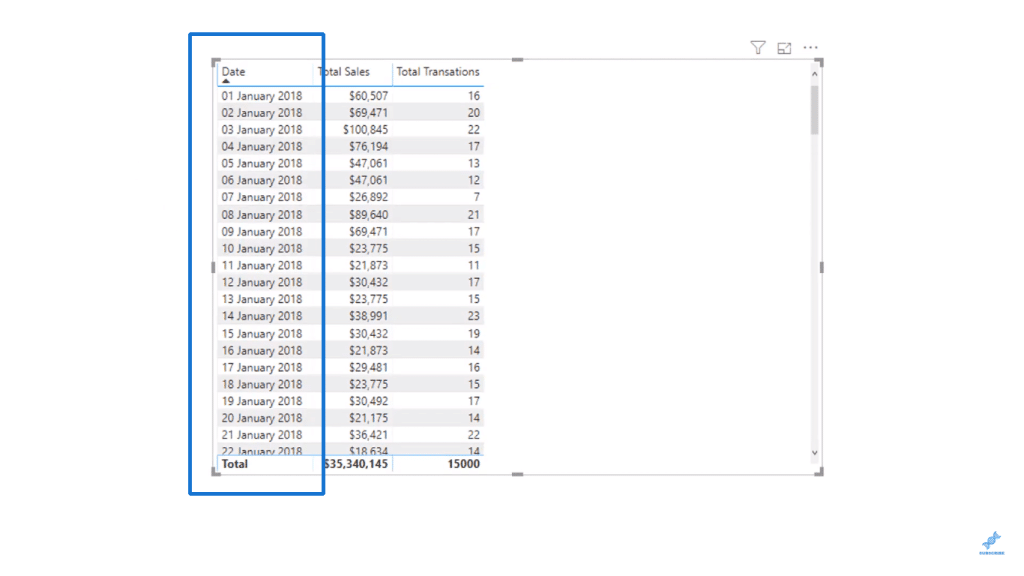
One other thing that I am going to do is change the date format by going to the Data area.
I will then highlight the whole Date column and select one of the other available date formats below.
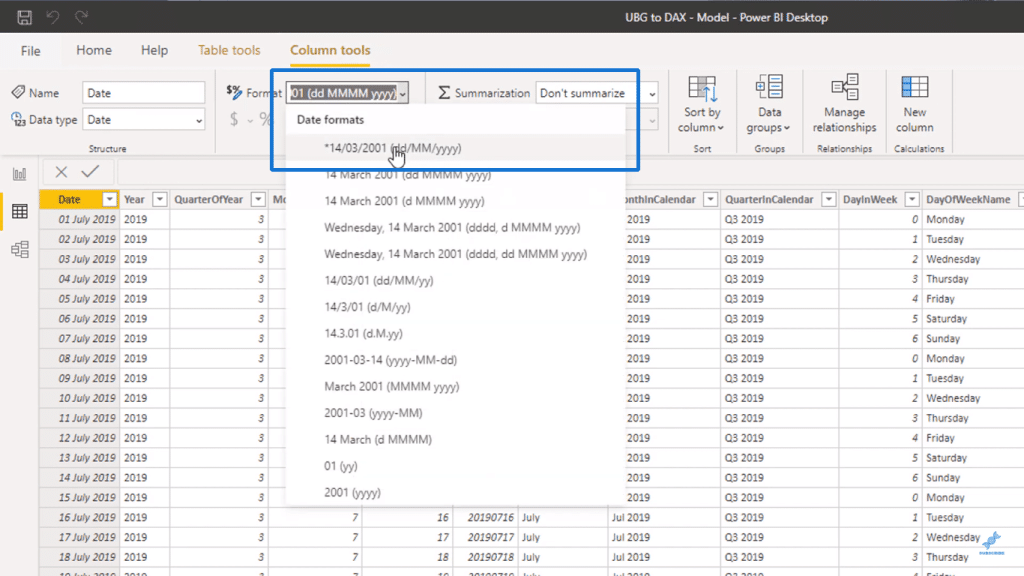
After that, we can come back to see our Date column in its new format.
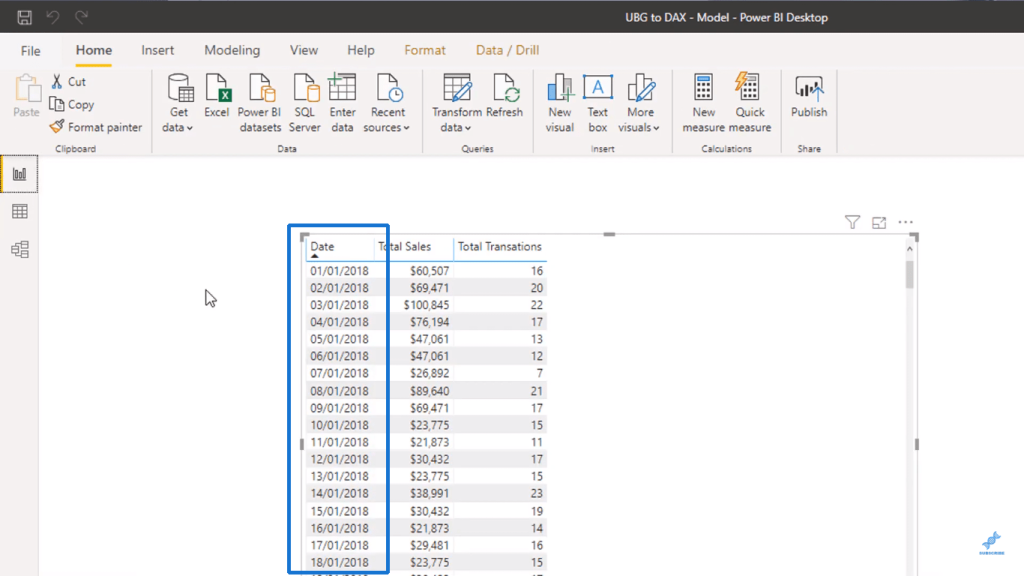
I’ll drag in the Date table again and remove the hierarchy one more time.
Then, I can make a slicer out of it so that I can quickly change the timeframe to look at a specific range of time.
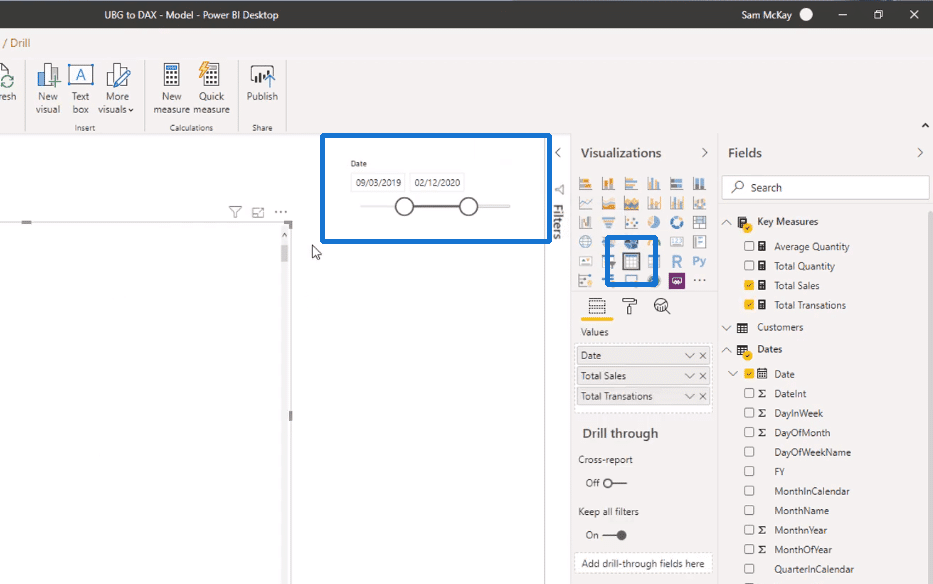
Now that I have my date slicer, I’ll show you some Power BI formulas.
Power BI Formula Using FILTER Function
Let’s create a formula that is more complex and write it in a needlessly complicated way so that we can simplify it later on.
What if we wanted to get a far more specific result? For example, I just want to look at Florida Sales within my measure so I can compare my overall sales to just my sales in Florida.
To do this, we have to create a new measure called Florida Sales and use a function called CALCULATE which we will go over more later.
Inside it, we can put our Total Sales measure since you can actually put measures inside of formulas through measure branching, which is a concept unique to Power BI.
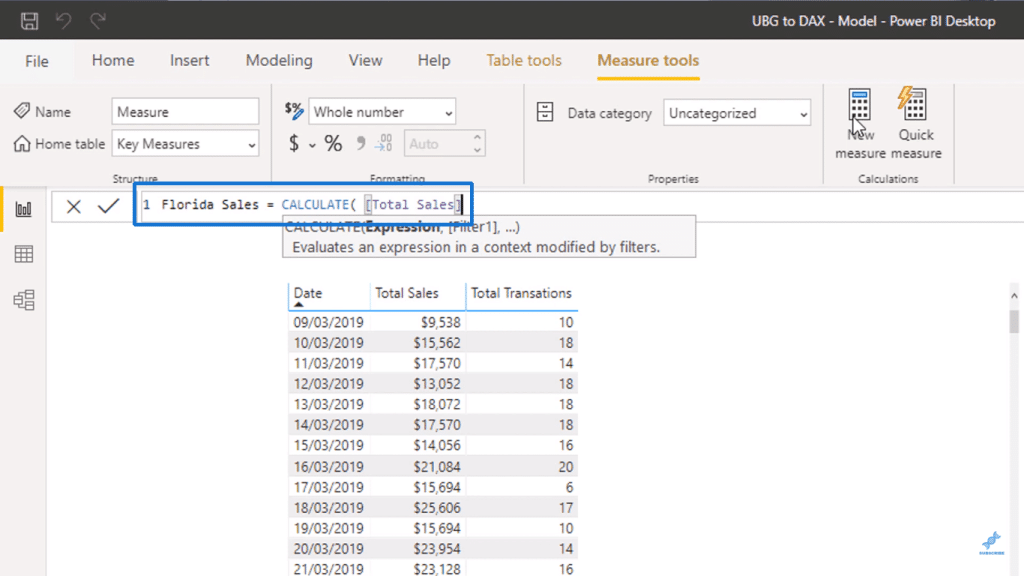
And then, I will use the function called FILTER and look through the Locations table. I could then use the State Code and equate it to “FL” in order to just look at Florida.
Basically, FILTER allows me to create a filter within a formula.
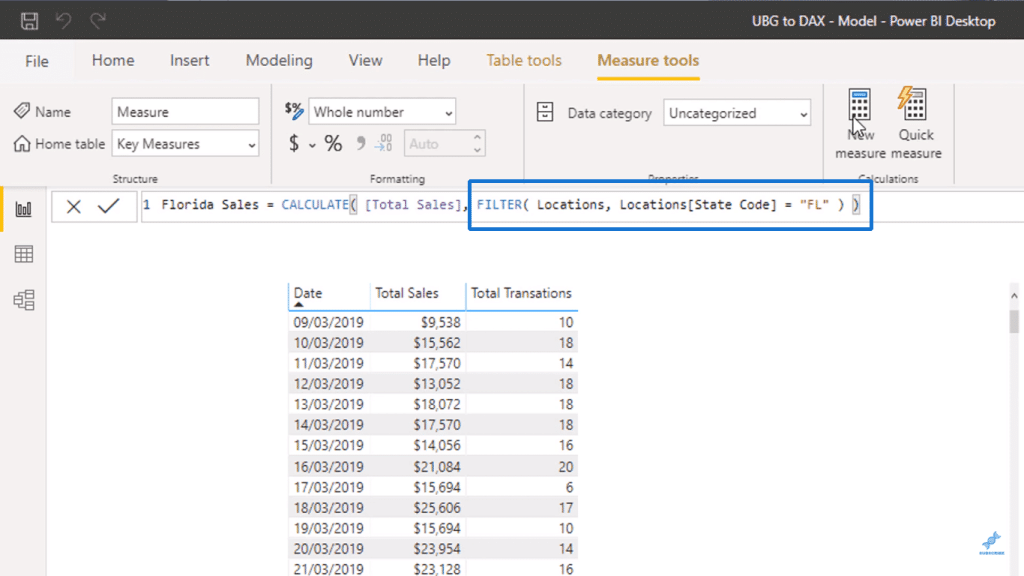
So just press Enter after typing in the formula, and then you can drag in the Florida Sales measure to compare it to our Total Sales measure.
From here, you can calculate more interesting things like the percentage of Florida Sales to Total Sales.
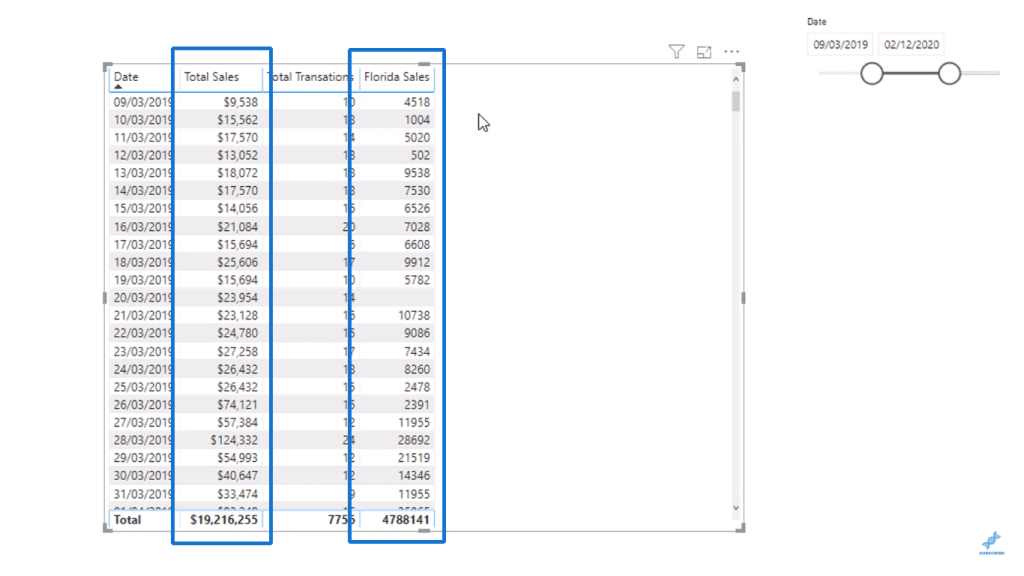
But I want to do something even more complicated here. I do not want to just look at Florida Sales, but also at sales of specific products.
To do this, we will use the FILTER function again and put in the Product Name from the Products table and set it equal to “Product 1”.
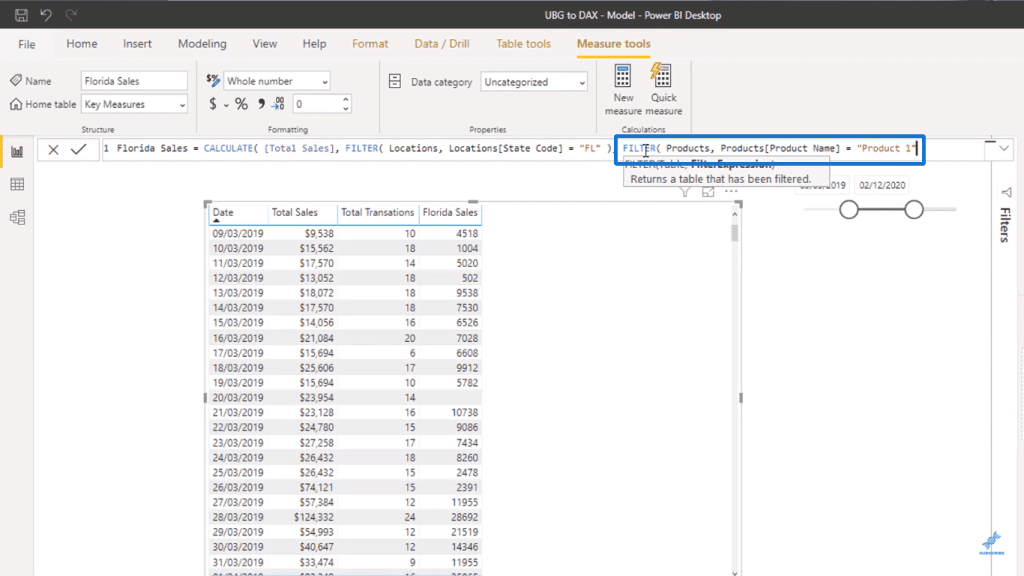
And then, I am going to use the operator OR and put in the Product Name equal to “Product 2”. Finally, I will rename the measure to Florida Sales of Product 1 or 2.
This means that I am filtering the results to look at the specific sales in Florida with the names Product 1 or Product 2.
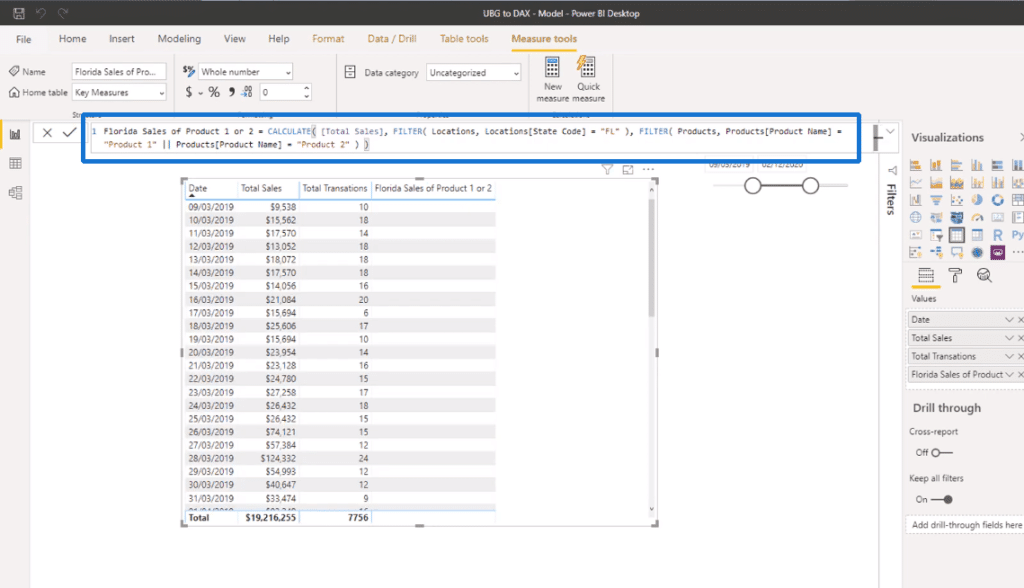
To get some results in, I will change the formula to Product 2 and Product 5, rename the measure accordingly, and then widen the timeframe by using the date slicer.
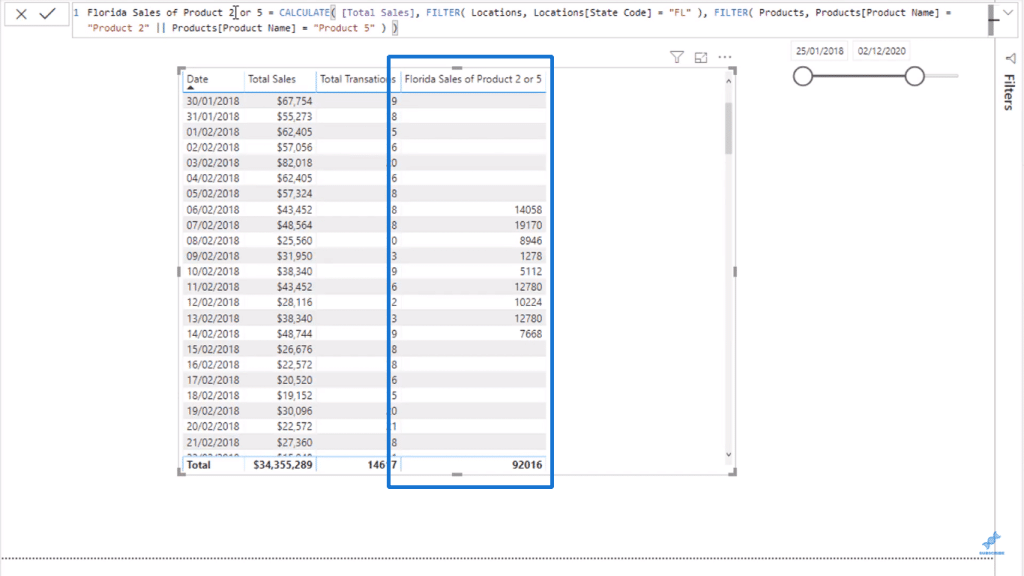
The one thing that I want to highlight here is how the formula looks too long and complicated.
We can clean things up by pressing Shift+Enter to bring a line down one row and then use the Tab key to create an indent.
We bring down CALCULATE and the two FILTER functions. We create indents before the FILTER functions.
You can see immediately how much easier it is to read the formula compared to what we had earlier.
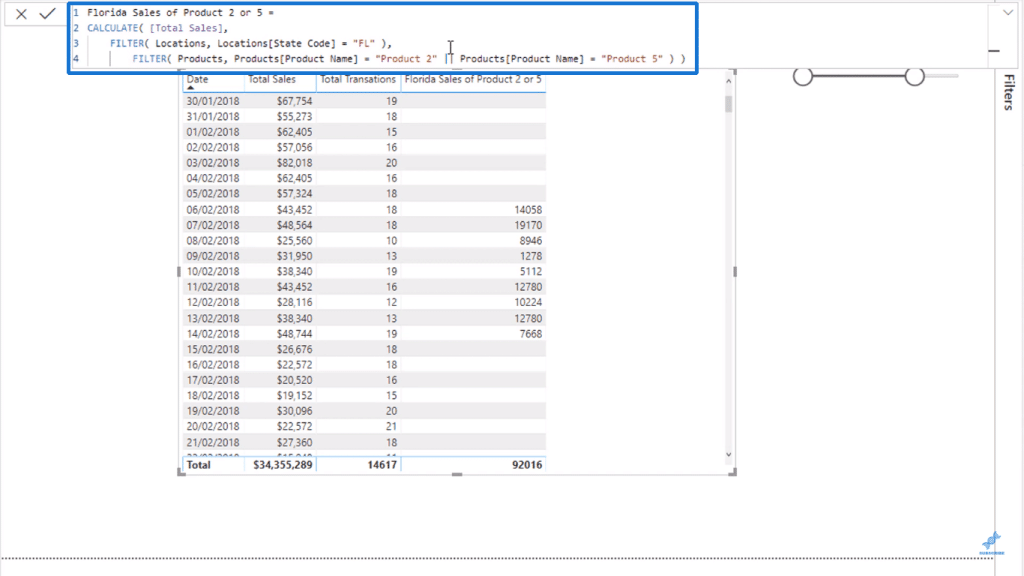
This is a really easy fix for when you need to write complex formulas.
The way I usually do it is if there is a function that has logic in it, I will usually place it on a row of its own with an indent in front of it so that the functions would be displayed in a descending manner.
Power BI Formula Using Variables
Another way of simplifying a Power BI formula is through variables.
What you can do here is write in VAR and then name your variable as long as it is one word with no spaces.
For our example, we will use the name FloridaLocation and then set it equal to the FILTER function that takes Florida Sales. Although you can store singular results inside variables, you can also put tables in it.
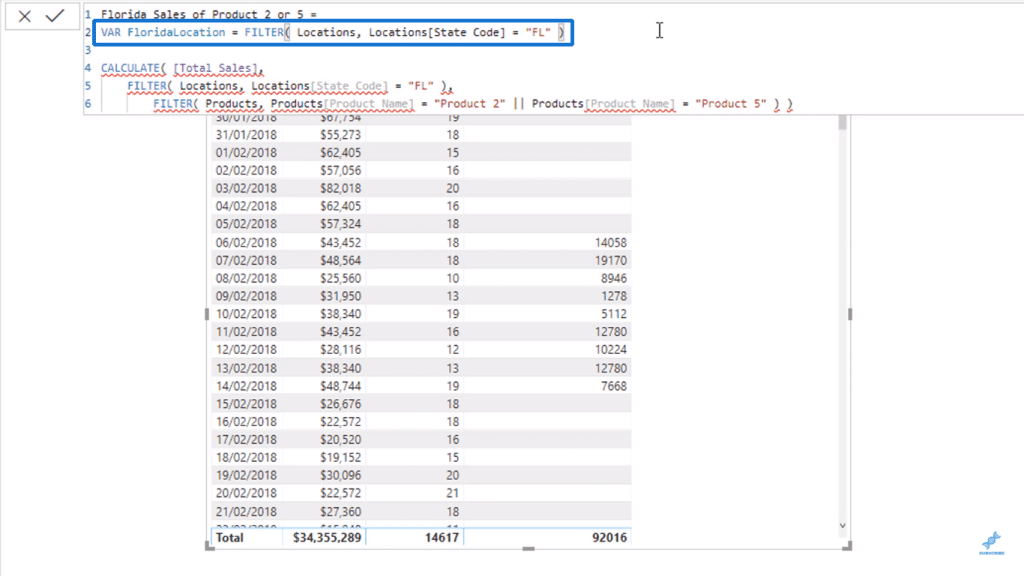
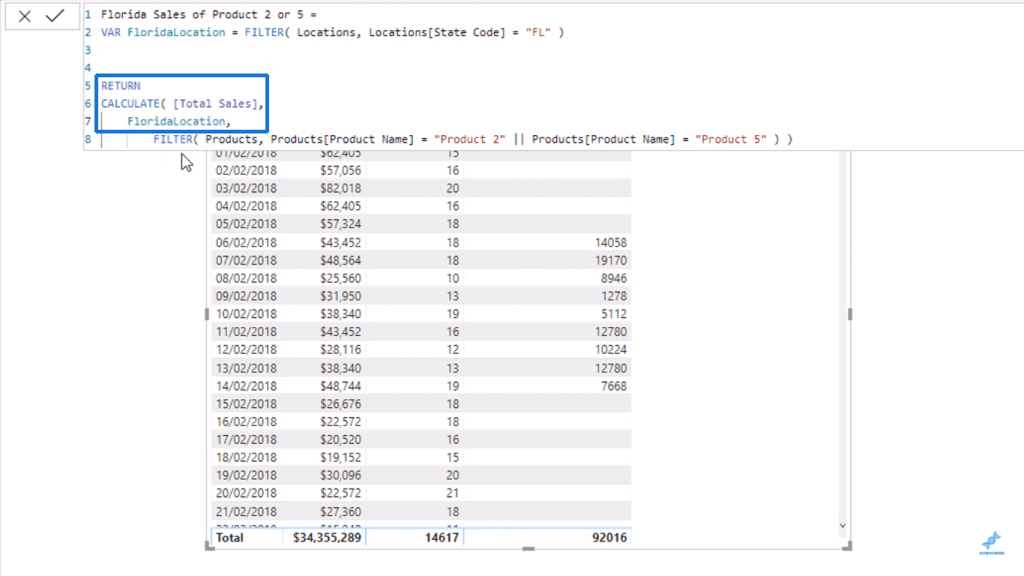
To make this work, you need to put RETURN before your formula’s final logic.
Then, you can put the variable you just created to replace the whole function.
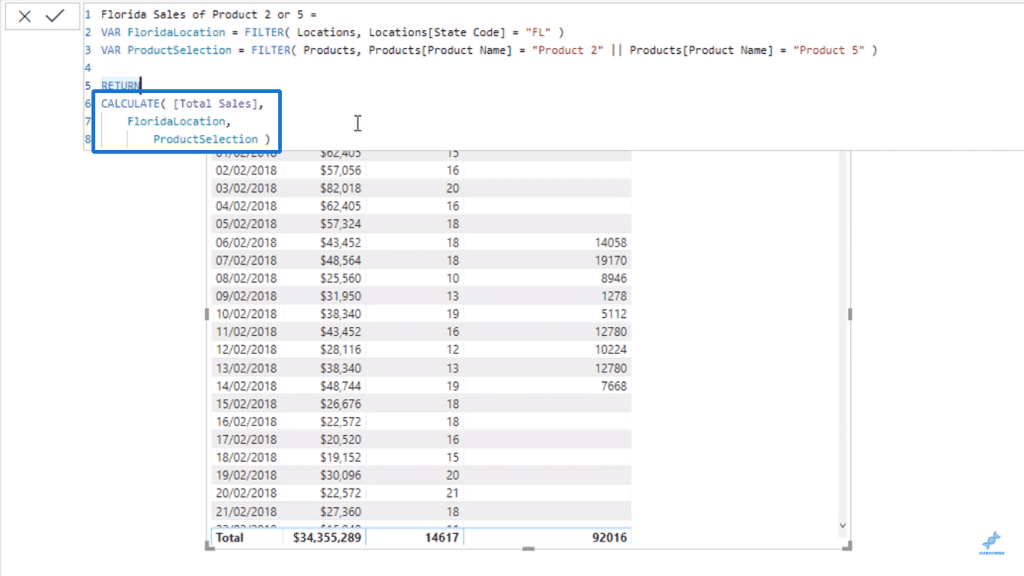
I can create another variable called ProductSelection, set it equal to the other FILTER function, and use it as a replacement for the function down there again.
Now we can see how much cleaner it is instead of the function that we had before.
Using Comments In The Power BI Formula Bar
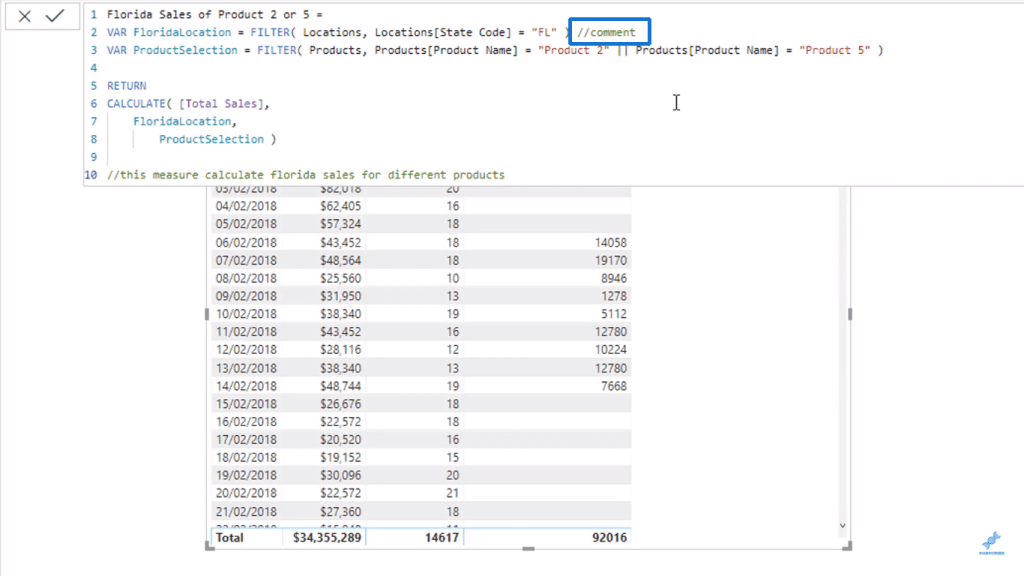
The last thing that I want to go over is writing comments in your formula bar. This can help your team or users understand your Power BI formula.
Just by typing in forward slash twice (//), you can say something like “this measure calculates Florida sales for different products”.
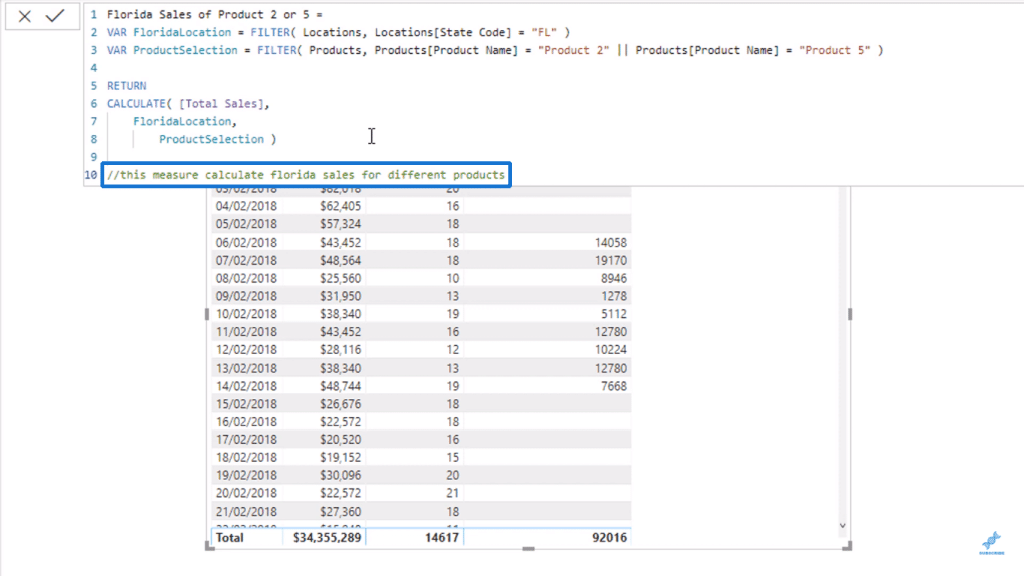
You can put comments wherever you like since they do not actually get registered as calculations in your formula bar.
***** Related Links *****
Formatting DAX Code
Using Variables In Power BI – A Detailed Example
Effective Ways To Use The GROUPBY Function In Power BI
Conclusion
In this blog, I have discussed how to sort out your Power BI formula to keep things simple.
The one thing that I do not want to see is writing formulas out without any thought on how to make them more readable. Because when you get more complex and advanced with DAX, the formulas tend to become unreadable and incomprehensible.
You will do yourself a huge favor by setting up your formulas efficiently.
All the best,
Sam


