In this tutorial, I’m going to talk about Power BI financial year to date calculations. Achieving a year to date analysis of a selected period is quite complex, but I’ll demonstrate to you a formula technique that enables you to quickly create a cumulative total over your specific financial year. You can watch the full video of this tutorial at the bottom of this blog.
I’m going to work with a simple model here. It’s pretty generic, but don’t get too caught up in the specific measures. The techniques are all the same especially if you’re doing financial year over anything like sales, quantity, revenue, costs, transactions, or forecast, for example. It’s all the same technique. You just need to sub-in the correct core measure into the actual pattern or formula combination.
So let’s dive into it.
Calculating Power BI Financial Year To Date Total
First, I’m going to set up a generic table, so we can look at the data itself. I’m going to bring in my core calculation, which in this case is Total Sales. Getting things into tables, to begin with is key.
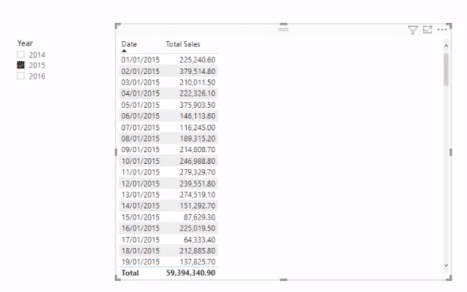
Now I’m going to show you how to do this financial year total. I’ll go create a new measure and call this Sales FYTD (financial year to date).
I’m going to use the CALCULATE function, which changes the context of the calculation. So I still want to calculate the Total Sales, but only for a financial year to date. This enables me to select what my financial year is, and then always be accumulating the amounts up to the end of the financial year.

Then, I have this time intelligence function called DATESYTD (dates year to date), which returns a set of dates in the year up to the current date. If I don’t specify something specifically for my financial year, it’s literally going to do the entire calendar year. And so, I put my Date column in there.
And then I want to specify the actual financial year. So maybe my financial year ends in June, right? But, it could also be at the end of March. So in this example, I put 31st of the third as the end of my financial year.
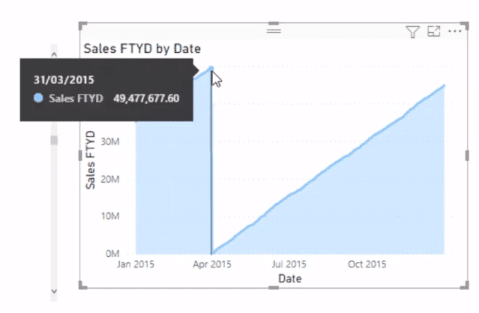
I push enter and I’ll drag this measure into the table, and you’ll see here that it is working out the financial year results. Now, remember that this can make it a bit tricky. I selected here on the slicer a calendar year, which is 2015. And so we’re actually seeing March 31st of 2015 as the end of the 2015 financial year.

Sometimes it’s easier to look at this within visualizations. So I’ll create an area chart here and you can see that we come to the 31st of March 2015, which is the end of our financial year.
Financial Year To Date In A Slicer
A better way to set this up is to have a financial year within the slicer. It makes more sense. In my Date table, it looks like there’s a financial year already embedded.

And so, I’ll go to Transform Data and work out the financial date that was embedded into this Date table. In the Advanced Editor, you can see that this is a Date table that enables you to specify the financial year, and here it started in July. So let’s just go with that.

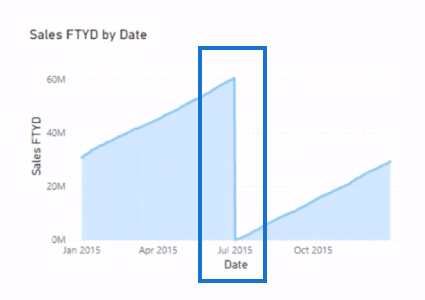
So I’ll go back to the formula and change the financial year-end to the 30th of the sixth. This way, we can align the actual financial year of the Date table.

With that, you can see the results in the visualizations changed as well.
Then, I’m going to bring in my financial year (FY) in the slicer instead of my Year. You’ll see that if I select one of these, it’s going to give me just the cumulative total for that particular financial year.
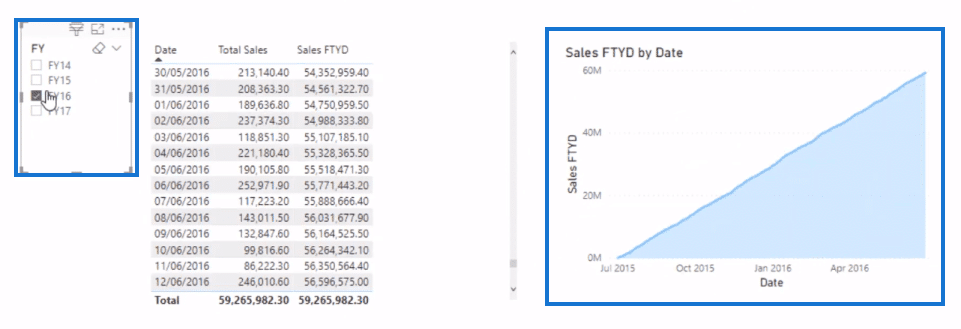
I can also do a multi-select and the results in the visualization changes as well.

Utilizing The Analyst Hub
You can also utilize the Analyst Hub really effectively here. This is where you can format your calculations well. Just go to DAX Clean Up App.
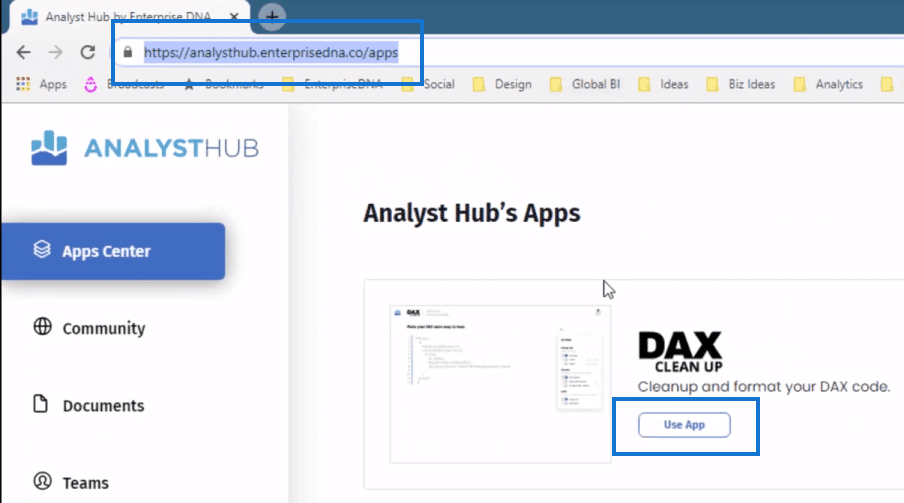
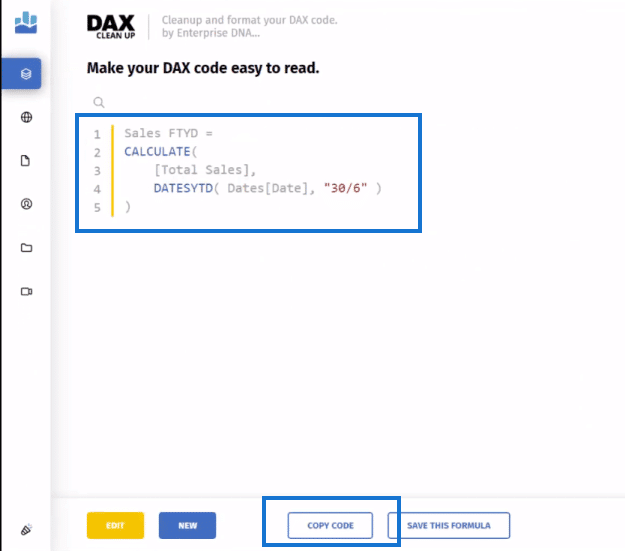
Simply copy and paste your formula here, and it will automatically set it up in a way that is easier to read and understand. Then copy the newly formatted version of your formula by clicking on Copy Code.
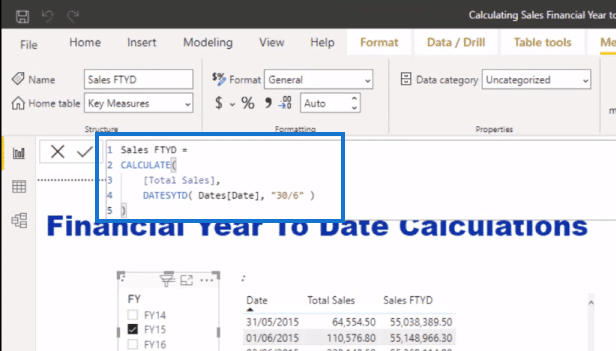
Then you can paste the formatted formula back into your model like so.
You can also save the formatted version of your formula in the Analyst Hub and share it (click the share to community button) with other users. This way, you can easily reference it in any future calculations that you might do.

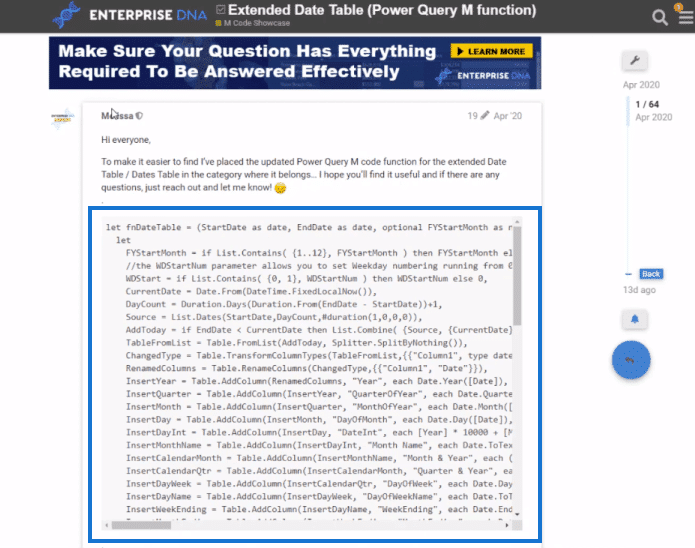
Now, if you want to have the ultimate Date table, I highly recommend you go to the Enterprise DNA forum and into the M Code Showcase. Here you can find the Extended Date Table (Power Query M function). I myself use this Date table pretty much in every development that I do.
And as you can see, it has a lot of views already. It’s one of the most popular pages on our site.
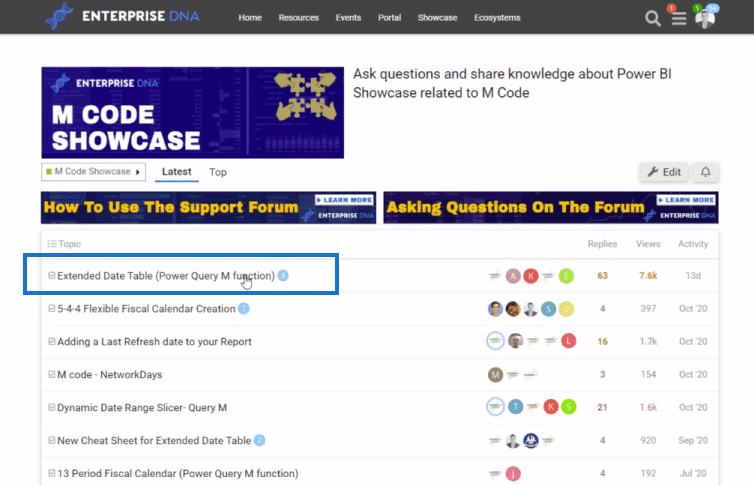
Click on the Extended Date Table (Power Query M function) and you can create your Date table using this code. Melissa, one of our Enterprise DNA experts, has created this really comprehensive M code that you can literally take and embed into your models.
***** Related Links *****
Calculate Financial Year To Date (FYTD) Sales In Power BI Using DAX
How To Create Unique Financial Year Quarters Using A Calculated Column
Year To Date Sales For Power BI Custom Calendar Tables
Conclusion
Calculating a Power BI financial year to date is just this easy. You could also do quantitative financial year to date or anything else at all. You just branch off from a different core measure and utilize the same technique.
As soon as you become familiar with calculating time intelligence functions, you’ll discover how amazing Power BI is. All the best with working through this one.
Cheers!
Sam


