For today, I’ll talk about financial reporting. I want to show you how to create customized tables for your Power BI financial dashboard report. The ability to customize your tables inside Power BI will give you immense flexibility when creating reporting applications. In this example, we’re talking about financial reporting, but this technique can be used in any type of reporting. You can watch the full video of this tutorial at the bottom of this blog.
You may have come across a situation where you want to show different results on different rows, or give summary calculations on a particular row. Unfortunately, it’s not possible to create a subtotal within your calculations in a normal table.

Using Table Template For A Power BI Financial Dashboard Report
There are new custom visuals that can do this, but they don’t give you as much flexibility if you utilize this technique inside Power BI.
The idea behind these customized tables is that you need a template of what you want your table to look like. Another term for this is the supporting table. It is not going to be a part of your model per se, but it’s going to support the calculations you’re doing inside your core model.
When you look at my data model, you’ll see my core tables as well as a whole range of supporting tables down at the bottom.
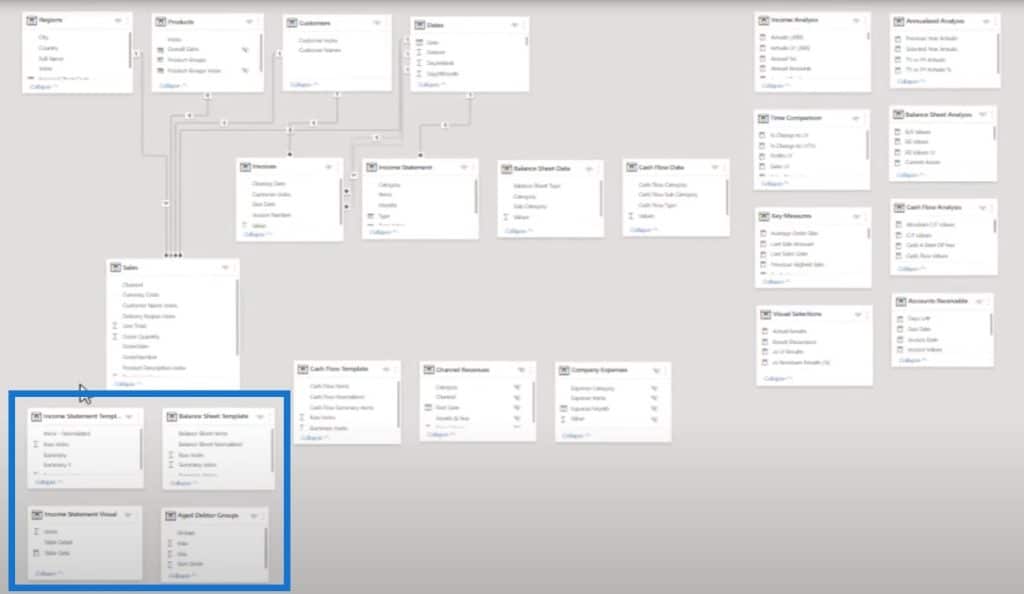
We need to utilize a template like this. In this example, you’ll see at the bottom there are all these totals.

This was all set up in Excel using tabs or spaces so that some of these entries were out further than the subtotals. I’ve also created a Normalized column (right column) to help me with my calculations.
The important thing here is to create a template like this.
Creating A Formula For A Power BI Financial Dashboard
The next step is to create a formula that works out what row we are in and allocates a result to that particular row. The main concept in the DAX formula language, and generally with Power BI, is this concept of context.
And context comes from the row. If this is just a random supporting table with random text values that have no relationship to our model, then we need to get the results from somewhere else and allocate them to these particular text values based on logic.
That’s how we can allocate anything to a row. We’re just creating the logic ourselves within our measures.
Let’s go back to our dashboard and you’ll see that I’ve added that template to this table. I also made sure that it has been sorted correctly and that the row index is hidden.
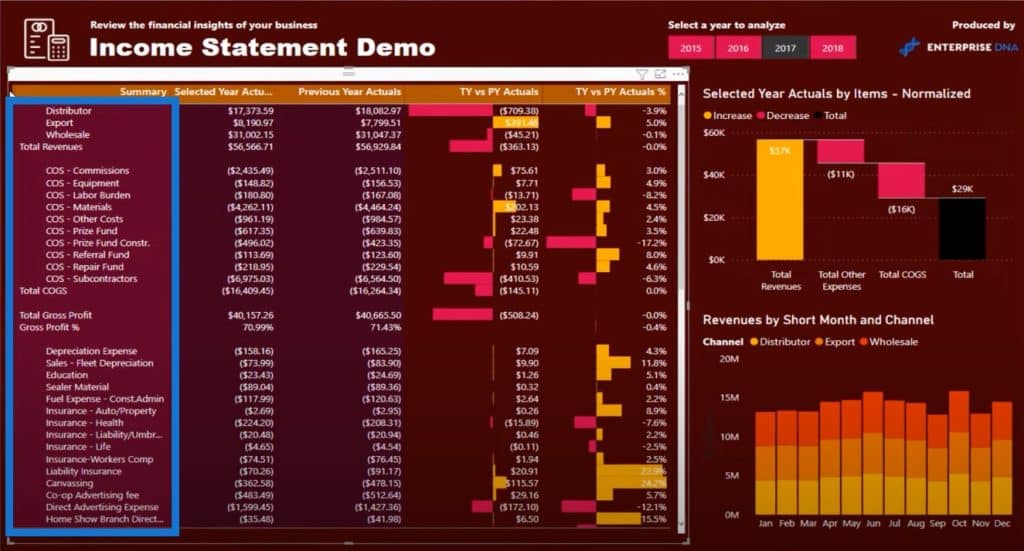
The next step is to work out all of these individual subtotals, such as the total revenues and cost of goods sold. As you can see, there are quite a lot of measures but none of these are complex.
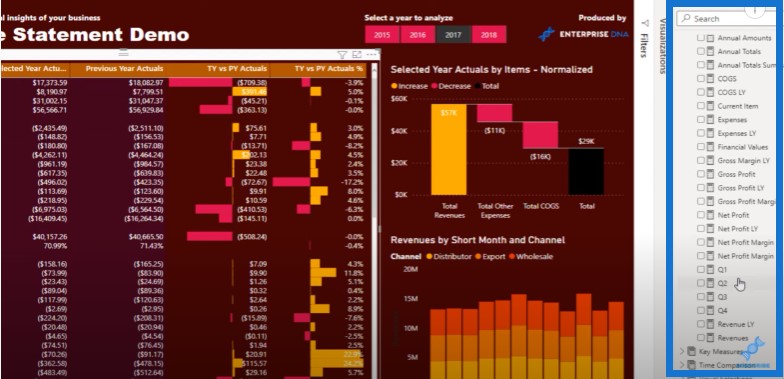
For example, if we go to Revenues, we’re just grabbing the values in my dataset that have revenues tied to it.

In my dataset, I have a more simplified table with all of the financial metrics in it, which makes it easy for me to run calculations.
So now I’m going to extract the information I want out of here, and then allocate it to where I need it to go inside my table.

Calculating Cost Of Goods Sold
Now that we already have the revenue calculation, let’s have a look at the cost of goods sold calculation. I’ve added a minus because it doesn’t have one in the raw data.
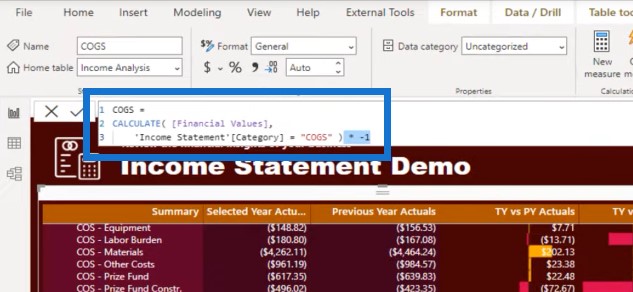
Calculating Gross Profit
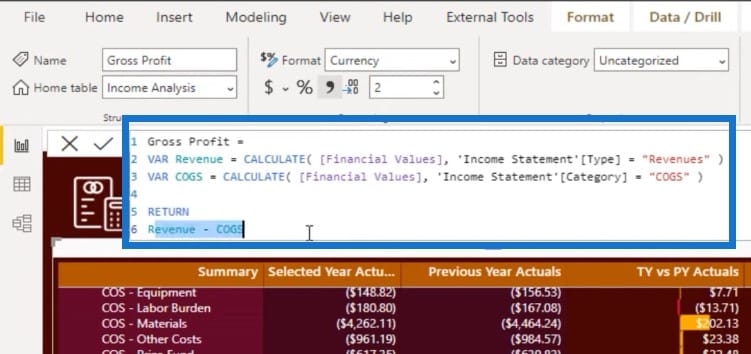
To calculate for profit, I use the difference between revenue and cost. In this particular case, I could have used the values, but I added them inside of variables just to break it out.
Calculating Gross Profit Margin
And then I’ve also calculated the gross profit margin.

I’ve also done the same for the Previous Year Actuals and was able to isolate those particular results too.
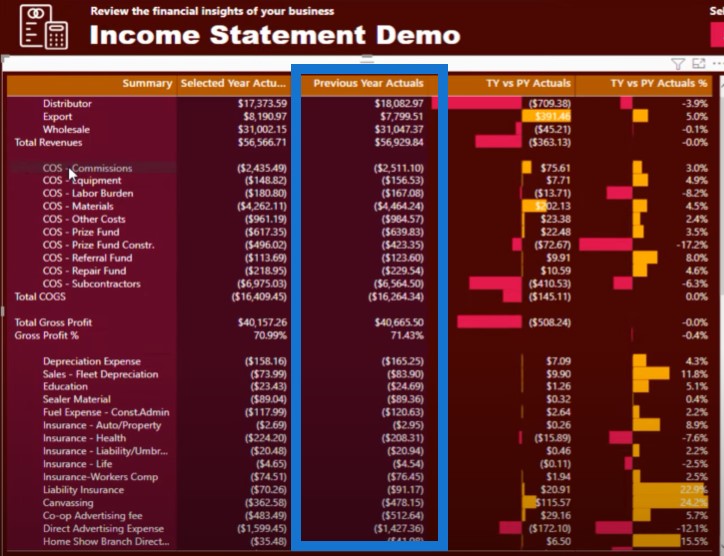
I already have these individual results, but I still have these other results that I need to allocate to. I don’t have to create a formula for these like I did for the individual ones since a lot of these row items already exist in my dataset.
There’s no need to isolate and calculate measures for every single item. We can allocate these all at once and only do the subcategories or subtotals where appropriate, like these roll-up calculations.
Let’s have a look at how I achieved the complete customization of my tables by overlaying the results into my templates.

This is a methodology that can be re-used in any report development. Within the first VARIABLE, we’re working out the row we are on and the context used.

Then I used SWITCH TRUE to run a lot of logic. This function is like a nested IF statement and is a better way to write a more advanced logic inside of Power BI.

The logic is going to say that if the current item equals total revenues, then I want it to be that revenues result that I calculated.

The same goes for the cost of goods sold, gross profit result, profit margin result, and so on and so forth. I’m able to allocate these roll-up calculations to those subtotals.
In the end, if there’s not any one of these, then the calculation should look up that exact row in the income statement table, and then return to me that result.

This Actuals measure is really just a sum with a little bit of logic broken down into revenues and expenses. I’ve allocated the subtotals and then created the final logic, which gave me all of the other results. This way, I don’t have to create a hundred different allocations; I only had to do this for the few ones that really mattered.
I’ve actually done exactly the same strategy to come up with the Annual Totals measure. This is a master calculation that has enabled me to allocate everything into the table all at once.

***** Related Links *****
Power BI Financial Reporting Tips and Techniques For Accounting & Finance
Financial Information Management Reports In Power BI
Evaluation Context In DAX Calculations
Conclusion
The key things I wanted to highlight in this Power BI financial dashboard tutorial are using a template and implementing an allocation methodology. There are a few steps to get there: making the template, figuring out what your rollup totals are, getting those results individually, and then creating the allocation algorithm.
Once you go through this step-by-step logic, it will save you time from having to write out so much traditional additional logic. This can be easily done and replicated in many different scenarios.
That’s all I wanted to show in this post. If you want to delve deeper, we also have a complete course within Enterprise DNA’s Learning Center. This is a comprehensive course that goes into all aspects of financial reporting, where you will learn how to build a complete solution from start to finish.
Sam


