
Power BI is a powerful data visualization and business intelligence tool that allows users to connect to various data sources, create interactive reports and dashboards, and share them with others. In today’s blog, we will be exploring the most powerful function call in Power BI.
This function call will greatly enhance the capabilities of Power BI and take your data visualization and analysis to the next level. This would let you take the analytical capabilities of Power BI up a bunch of notches and do amazing things all within the context of the Power BI framework. You can watch the full video of this tutorial at the bottom of this blog.

Dataset Function Call In Power BI: Problem Overview
This sample problem is from a site called Excel BI Nightly Power Query Challenge which is run by VJ Verma. He puts out a problem every night, and the community solves it and discusses it among members.

In the example, the question has a very simple construction with given upper and lower limits. Between these two numbers, we have to calculate the number of prime numbers in that range.
Though it’s quite simple and straightforward in concept, it’s a lot harder to implement in Power BI. That’s because, among the 800 M functions and around 400 DAX functions, there’s no feature that directly lets us determine whether a number is prime or not in Power BI .
Instead, we will delve into the Dataset Call which is a way to move from Power Query to R or Python, execute instructions, and then go back into Power Query seamlessly and continue our analysis.
Let us take the data from the Excel BI challenge and start working.
Changing The Data Type
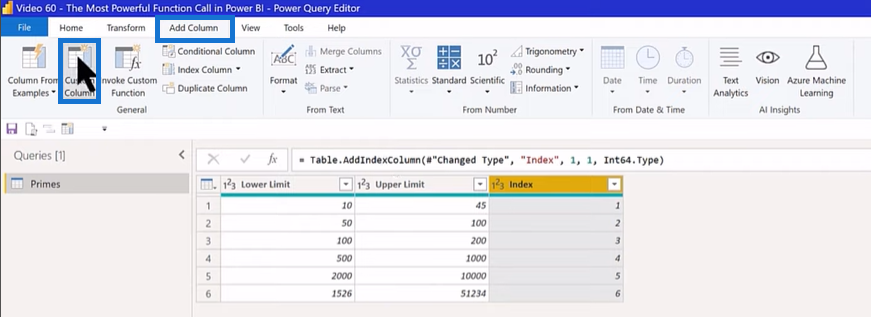
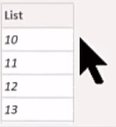
Shown below are the Lower and Upper Limits.

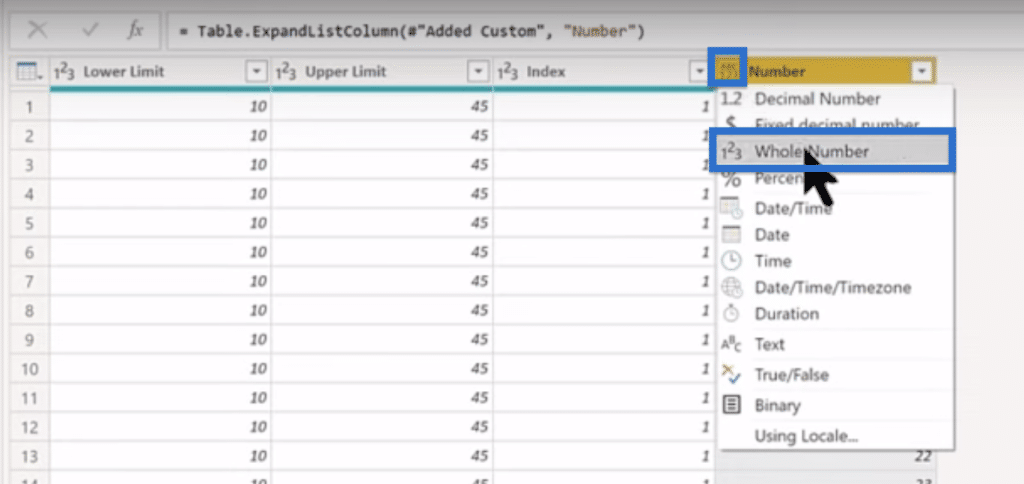
These givens are in text format, and we need to change them into whole numbers. To do that, double click on the header row (Lower Limit or Upper Limit). In the options that will appear, choose Change Type then select Whole Number.


The next step is to create a new column for all the numbers between the lower and upper limits. Then, we’ll pivot the column to make a list.
Go to the Add Column tab and pick Custom Column since there is no way to do this directly through the user interface.
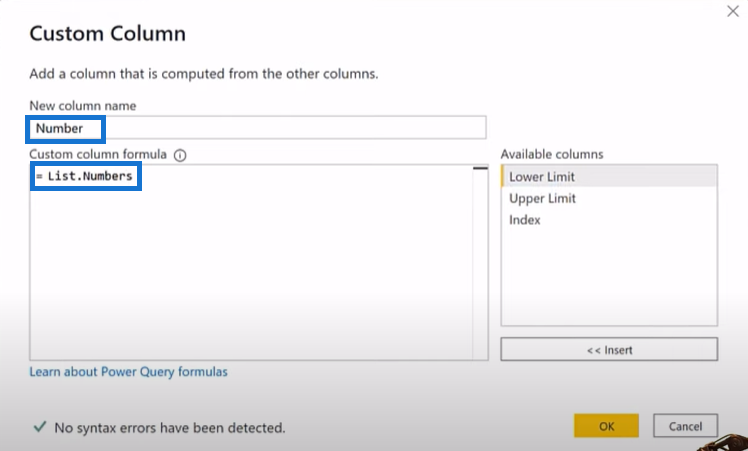
Create some simple M code and make a column named as Number. Use the List.Numbers function which returns a list of numbers given an initial value, count, and optional incremental value.
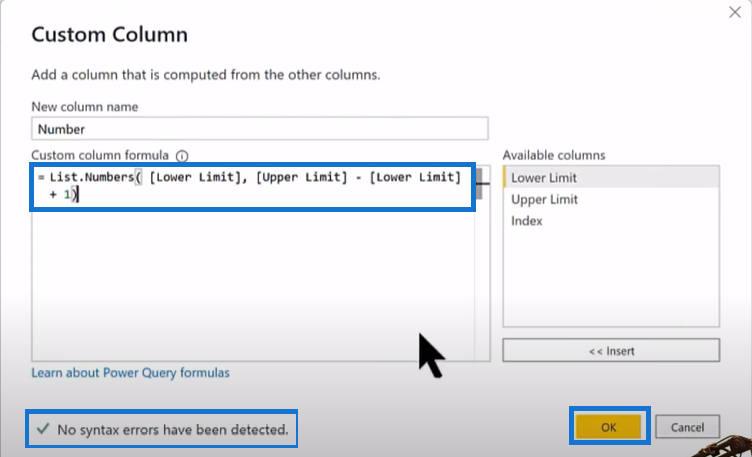
Set the initial value to be the [Lower Limit] and the count as the [Upper Limit] – [Lower Limit] + 1 to account for the N point. Make sure that no syntax error is detected. Click OK.
A new column with Lists should appear. Click on the List to see the numbers in the range at the bottom.
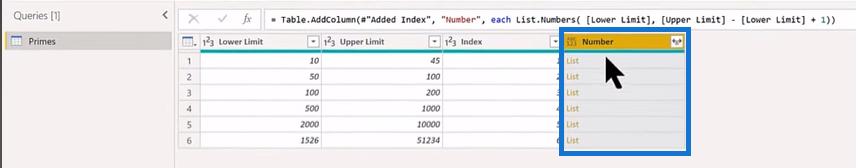
For example, if we click the List in the first row, we’ll get a list showing numbers from 10 to 45.
Click the arrow beside Number and click Expand to New Rows.
Next, click the format icon on the left of Number and change the format to Whole Number.
At this point, we want to determine if each of these numbers is prime or not. Again, there is no way to do that directly in Power BI. We could program a series of steps that would determine prime numbers but here is an easier way to do that in Python.

The R Prime Number Package
In R, there are different packages. These are add-ons that we can build into the program in order to accomplish certain functions, equivalent to custom visuals or external tools in Power BI.
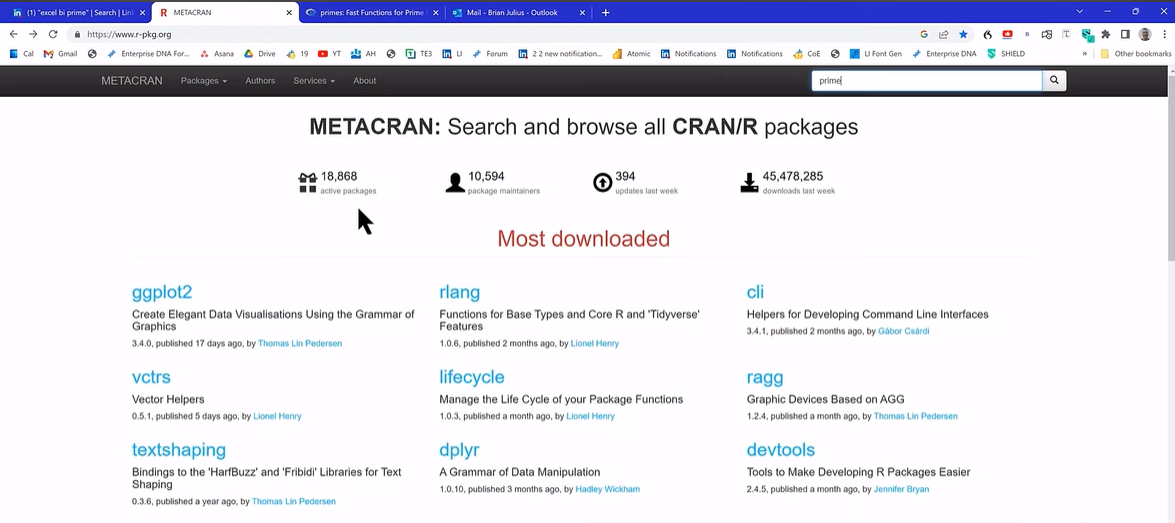
METACRAN presents a catalog of all the approved R packages. There are over 18,800 active packages in R, but we can also load in directly from the developer site. This means that we can do any analysis within the program by finding the right package.
In our case, we will look and try to find something that will determine whether a number is prime.
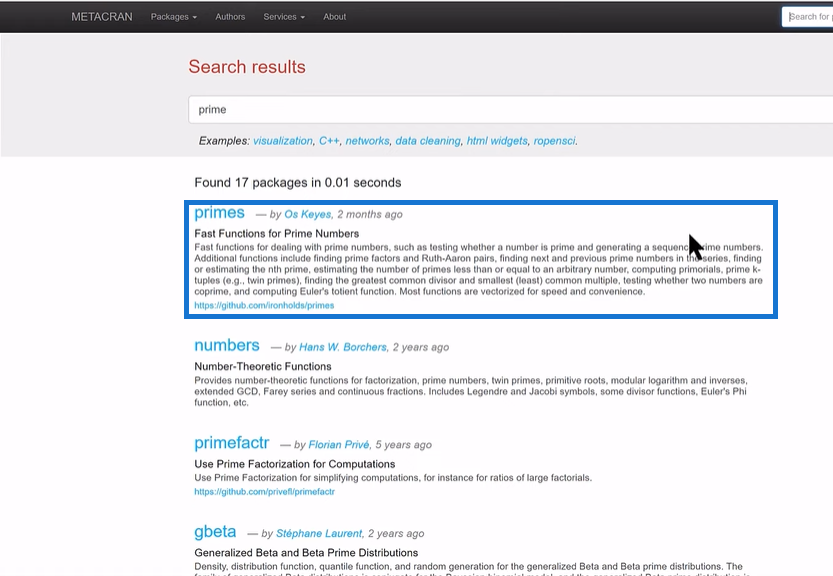
Type prime in the search box.

Choose the first package named primes – Fast Functions for Prime Numbers. This is a package that tests whether a number is prime and generates a sequence of prime numbers.
Inserting The R Prime Package Using The Dataset Function Call In Power BI
Go back to Power BI and click Run R Script from the ribbon.

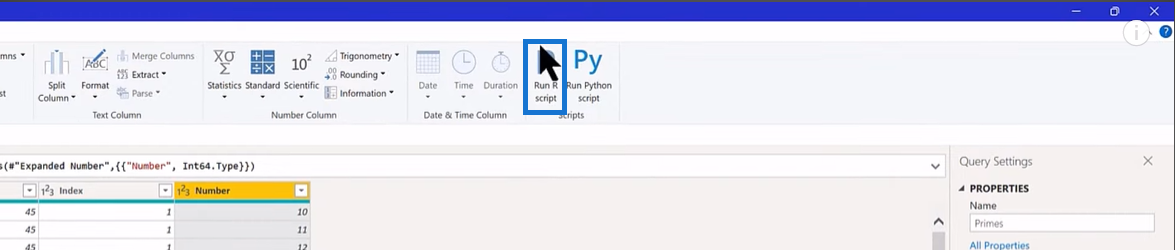
A Run R Script wizard will pop-up.
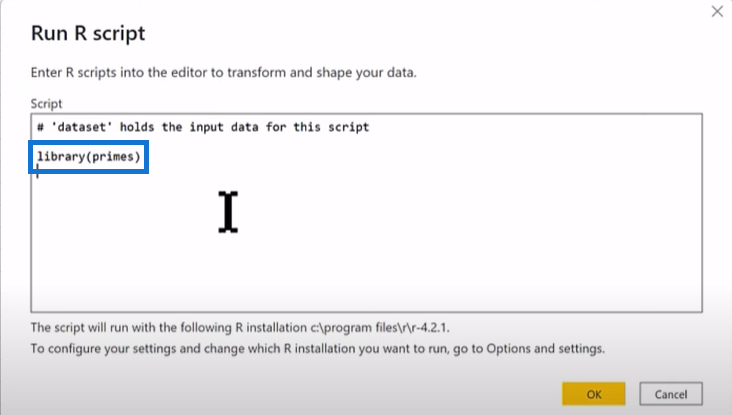
The pound sign (#), which is an indicator for comment, says that the variable ‘dataset’ holds the input data for the script. It lets us clean, structure, and shape our data, as well as add columns and pivot things. As soon as we call dataset, everything that we have done up to that point gets fed into R. The same thing is true for Python – the data set works the same.

We can take all the knowledge we have on Power Query and do all our shaping there before calling R. This is very helpful because we do not have to learn any R functions that do the same thing as we did in Power Query. Basically, we can go directly into the analytical portion which is what we will demonstrate today.
Let’s start by installing the package. We can use the install.packages command, but in this case, we’ll use the library.
Type library and call the primes package. This is equivalent to bringing a custom visual in Power BI from AppSource.
Then, create a table called df for data frame and assign the dataset table to that.
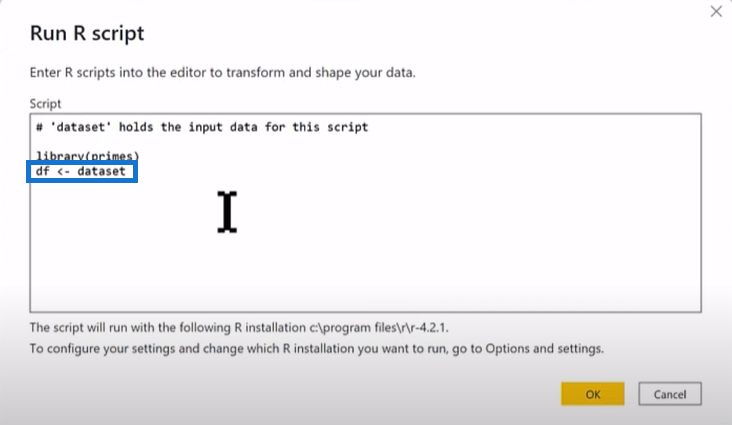
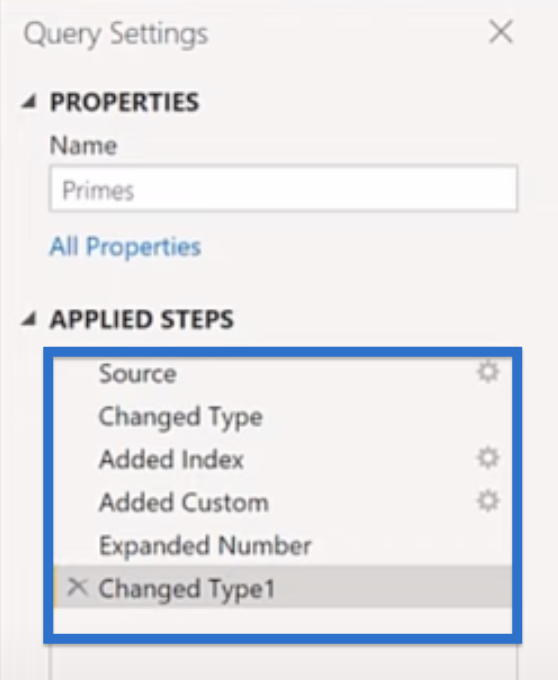
In Power Query, our dataset is composed of everything from Source to Changed Type 1 and that was what we assigned to df.
Create a new column equivalent to the calculated column in Power BI by typing df$isprime. Note that the dollar sign ($) in R is similar to the square brackets in Power BI.
Isprime will be our column name and to that, we will assign the is_primes function from the primes package. We will then call the Number column from df.
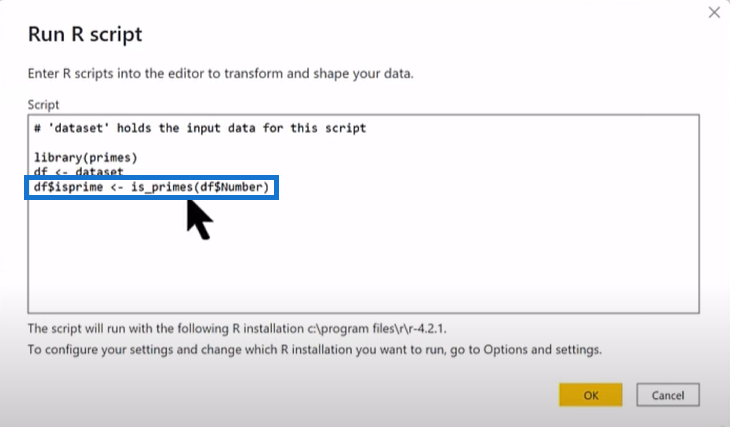
This takes the number column and runs it through the is_prime function to say TRUE if the number is prime, and FALSE otherwise. The function will then put the TRUE or FALSE in the isprime column in the df table.
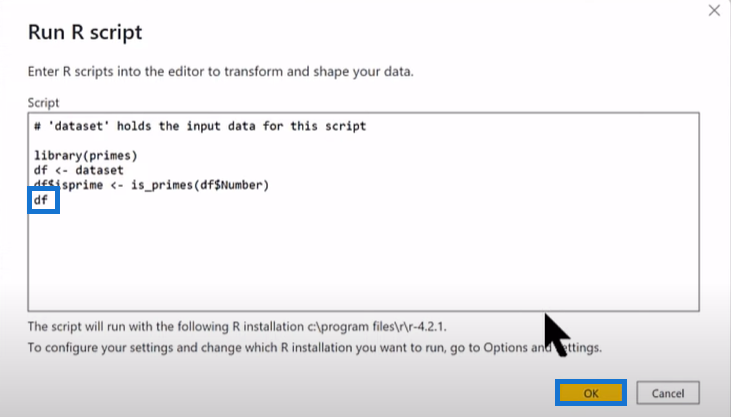
Call the df table in the end. Click OK.
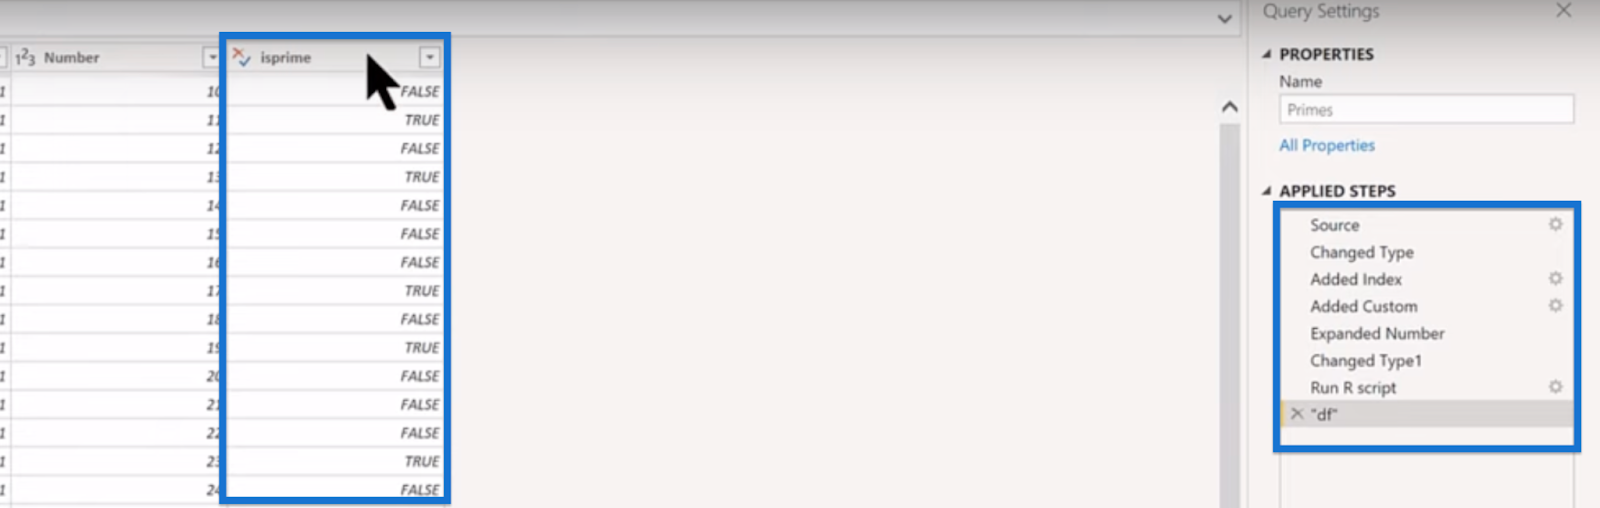
We can see the df appear in the Applied Steps pane. When we click on it, we should see the isprime column which contains the TRUE or FALSE classification.
Filtering the Prime Numbers
Next, we’ll remove the rows for numbers that are not prime. Click the arrow beside isprime to open the filter. Uncheck FALSE so we can count the prime numbers.

Click OK then go to the Home tab and choose Group By.
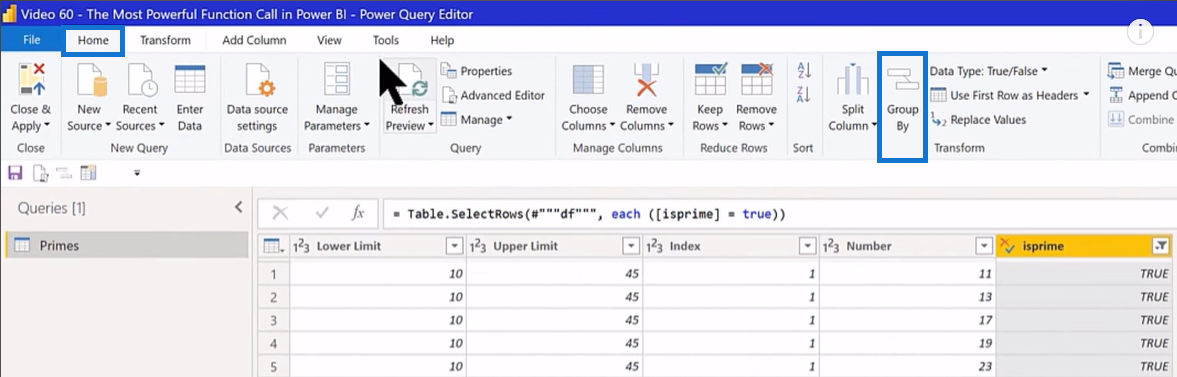
Open the Advanced option. In the pop-up window, group by the Lower Limit and add a group for the Upper Limit. Then, create a column called Count and set Count Rows as the operation to count the number of TRUE. Click OK.

This will yield the result similar to that from the challenge.

***** Related Links *****
Create a Perpetually Updated Practice Dataset in Power BI
Three Ways To Use R Script In Power BI
R For Power BI | A Beginner’s Guide
Conclusion
In conclusion, the dataset call is the most powerful function call in Power BI, and is a valuable tool for any user looking to gain insights from their data. This single, simple Power BI function call lets you radically expand the analytical capabilities of the program, literally putting hundreds of thousands of additional functions right at your fingertips from within Power Query.
By understanding how to properly use this function, you can easily manipulate and analyze large sets of data, leading to more effective and informative visualizations. With the insights gained from this function, you’ll be able to make data-driven decisions and improve your overall understanding of your data.
All the best,

Brian Julius


