
In this tutorial, we’re going to dive into some procurement analysis or purchasing decision-making within organizations. You may watch the full video of this tutorial at the bottom of this blog.
This tutorial demonstrates the versatility of Power BI when it comes to helping make insightful decisions for a procurement division. I’m going to run through an intro example where we’ll start from raw data, create a quick data model, and then run some analysis.
Then I’ll get you started on how you can start building up some of the core calculations, which are going to lead us to ultimately optimizing our purchasing decisions.

Being able to run this type of analysis in Power BI is immensely effective. You can get great quality insights very quickly; and I’ll show in the video how you can do just that.
If this is something that you deal with on a day-to-day basis in your work, this tutorial will be a huge help for you.
The Data Model
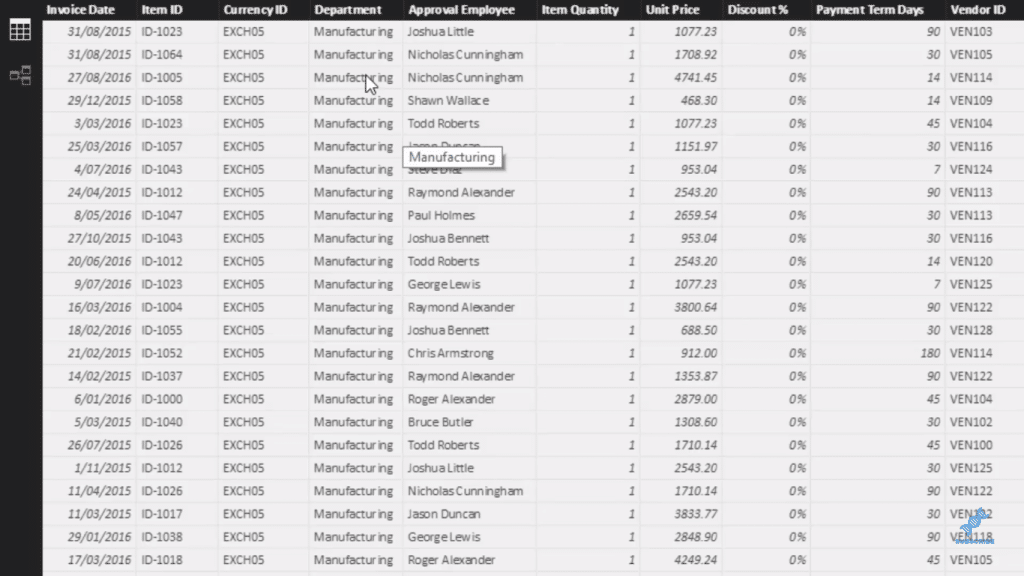
First of all, let’s go over the data that we’re working with for this procurement analysis. Here we have some invoicing information, so you need to think about your procurement team. However, purchasing could also be from your marketing team, manufacturing team, or sales team.
Our Invoicing Details here shows what we are actually buying. We can see what item and currency it was, from what department, who’s allowed to approve it, what’s the quantity, the price, the discount, the payment terms, and who’s the vendor.
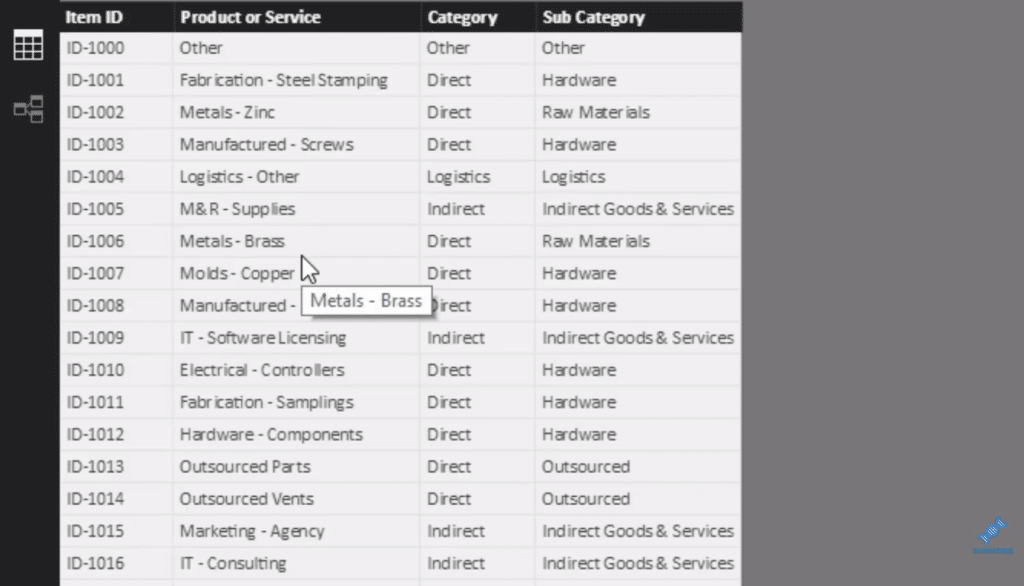
We’re looking at a particular item, which we have in a table here. We can see the products and services that we are purchasing.
Now let’s look at the data model. It has Lookup tables at the top and the Fact table at the bottom. We have our Dates, Exchange Rate Items, and Vendors (Lookup tables), which all feed down by relationships to our Invoicing Details (Fact table).
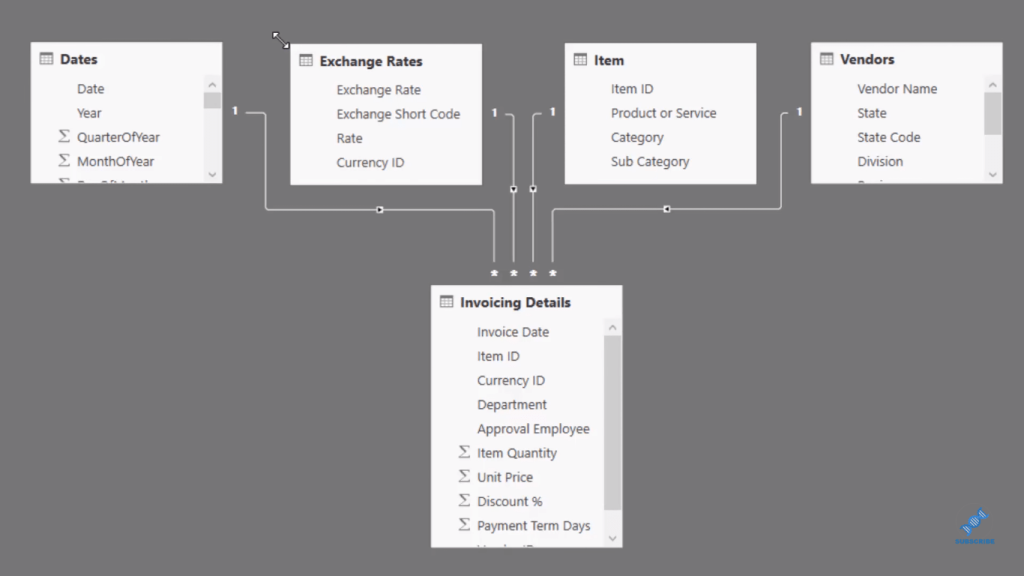
So now I’ll show you how you can run analysis over this data set. There are loads of insights we can get from this. We can look at it from a vendor’s perspective, or from which department is purchasing what. There’s a lot of filters here as well, which is fantastic!

Optimising Procurement Using Iterating Functions
The key thing that we need to work out is a value that is in our base currency. So we need to adjust it by the exchange rate and account for the discount that we might get.
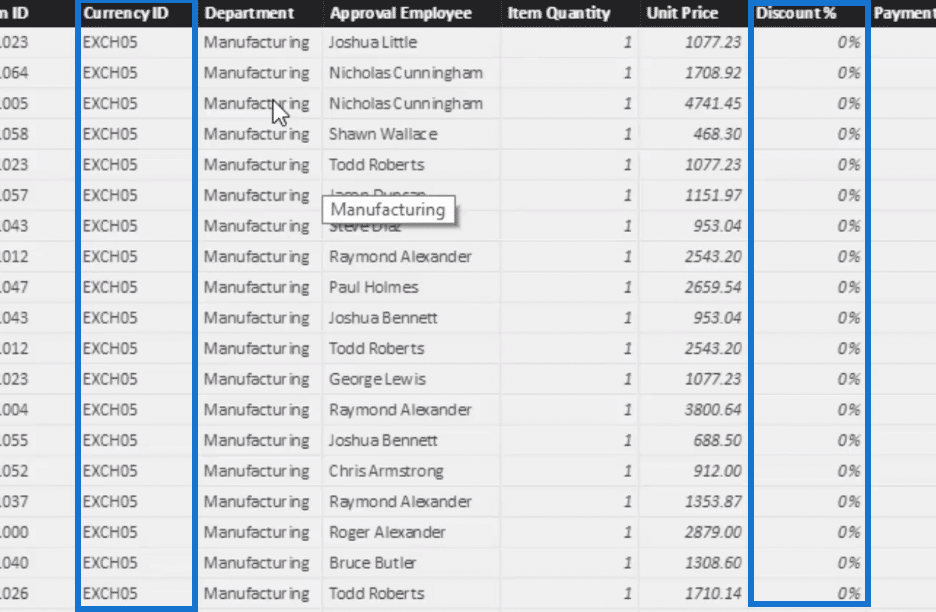
The discount here may be a zero all the way down, but in some cases it might be more, which we need to take off from the unit price. Now we need to run a relatively advanced iterating function.
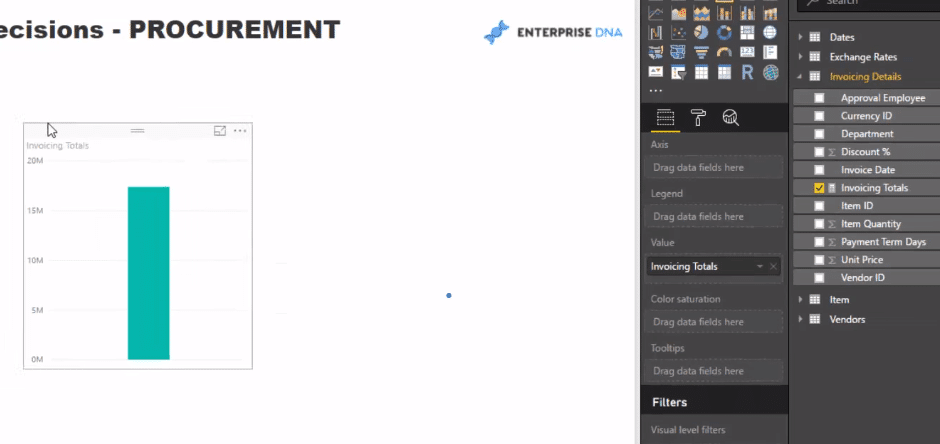
So let’s create a measure and call it Invoicing Totals. We use SUMX, which is going to jump into the Invoicing Details table. Then, we place our logic that goes multiplying Item Quantity by the Unit Price. We put some brackets around it, then multiply it by 1, and then subtract the discount percentage.
Lastly, we divide it by the RELATED currency. This way, we reach back to our Exchange Rate table and find the exchange rate.
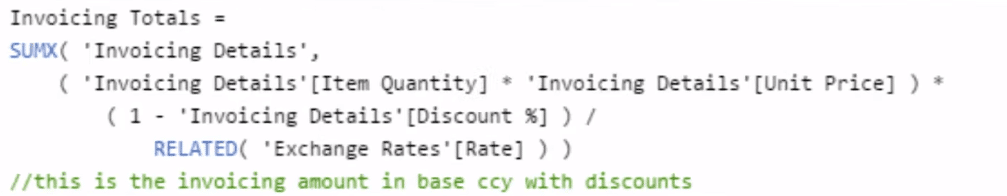
We have three different calculations here on each row, and now we have our value.
This is a really cool example of how you can utilize iterating functions. We get an awesome logic on a per row basis, and then it does that sum inside an iterating function.
Extracting Insights From Procurement Analysis
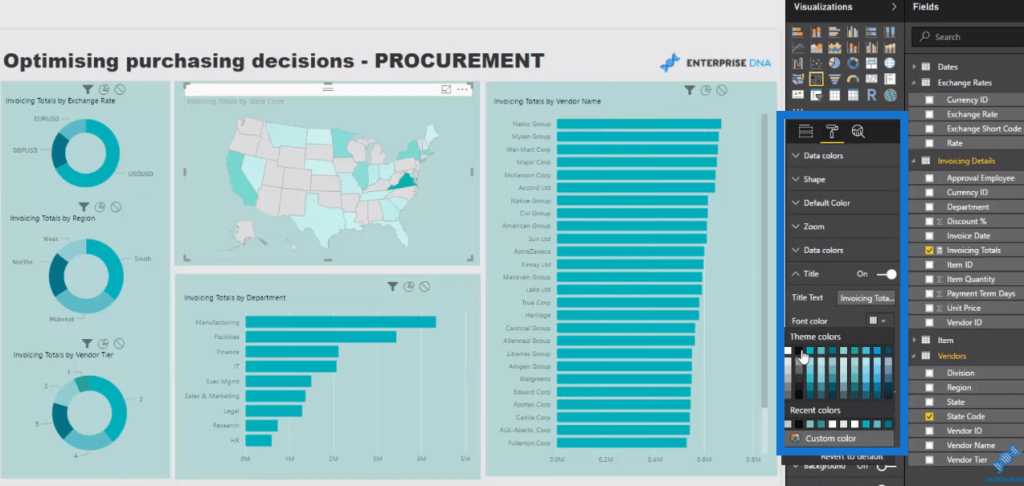
We can get a lot of insights from here. We can see in which currencies we get a lot of our profit from, so we can look that up. We can also check out our vendors and see who we are purchasing from. We might also want to see what’s happening from a department perspective, and we can absolutely do that too.
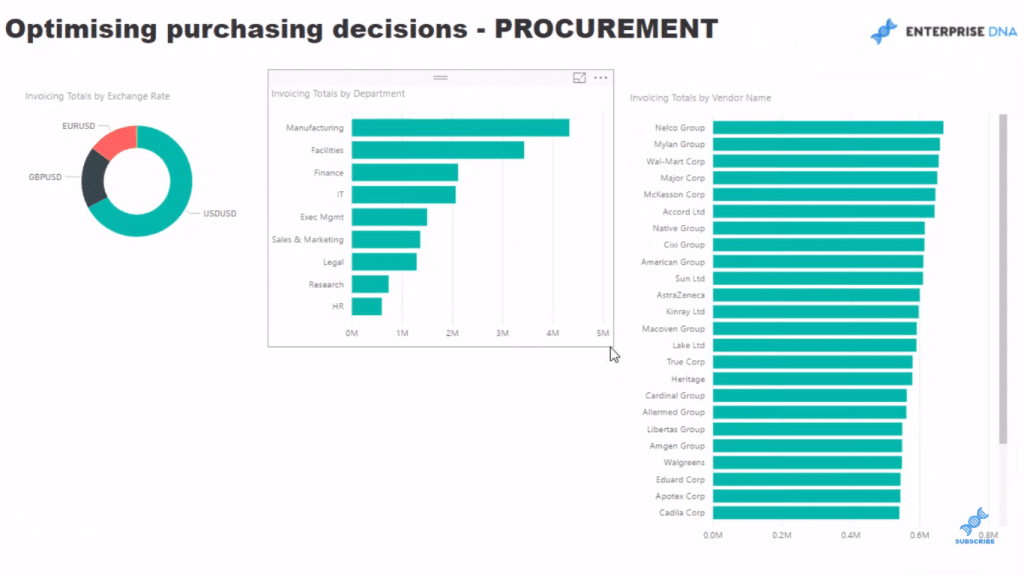
Furthermore, we could also look at it from a regional perspective, where we get our stuff from. This is how quickly we can maneuver our way around and get a lot of great insights. Now we have a pretty good picture of our spending.
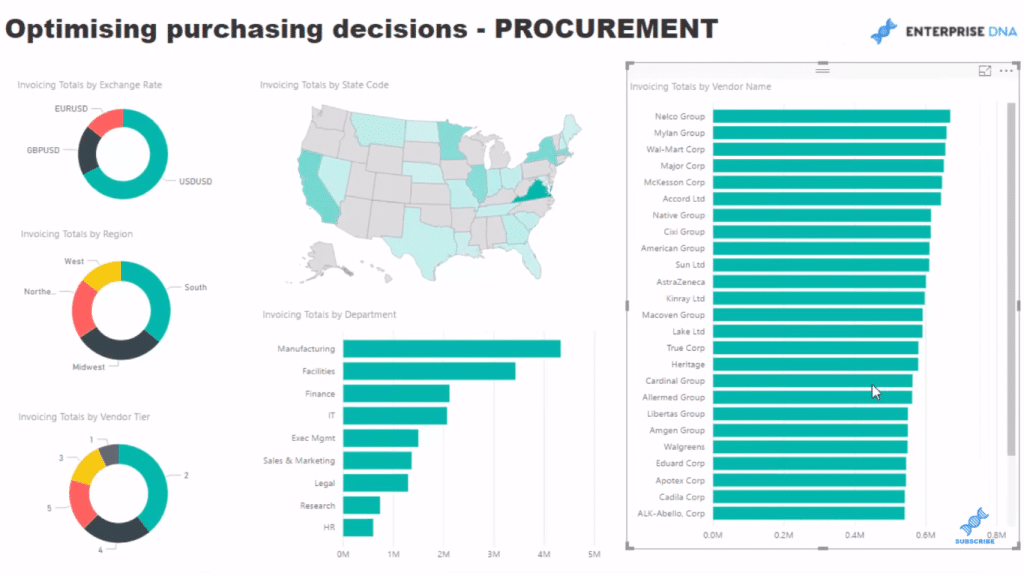
We can just change a few things here like the filtering and the colors to make this work well.
***** Related Links *****
Calculating Average Monthly Purchases In Power BI Using DAX
Iterating Functions In DAX Language – A Detailed Example
Using Iterating Functions SUMX And AVERAGEX In Power BI
Conclusion
That’s how we can quickly optimize our purchasing decisions for a valuable procurement analysis. We can find some insights from our procurement information and make a compelling visualization. We are able to utilize the power of the data model to really filter all this information really quickly.
I recommend that you utilise the filtering that you can get from Power BI as much as possible. In this example, we only created one DAX formula, nothing complex. It’s just a matter of placing these details against the right context.
If you’re in a procurement division within an organization where you need to make some sort of purchasing decisions, this is a great tutorial to get your mindset aligned to what you can achieve in an efficient way within Power BI.
The end result is that you will understand how you can use Power BI as an optimization tool for some of the decision-making that you might have to make around purchasing.
Good luck on this one!

Sam


