
In today’s blog, I’m going to feature the solution to the Enterprise DNA Problem of the Week #9, including a simple and generalizable framework for incorporating M code into a Power Query custom column. You may watch the full video of this tutorial at the bottom of this blog.
Being able to create columns in Power Query using M code increases your ability to solve more complex problems.
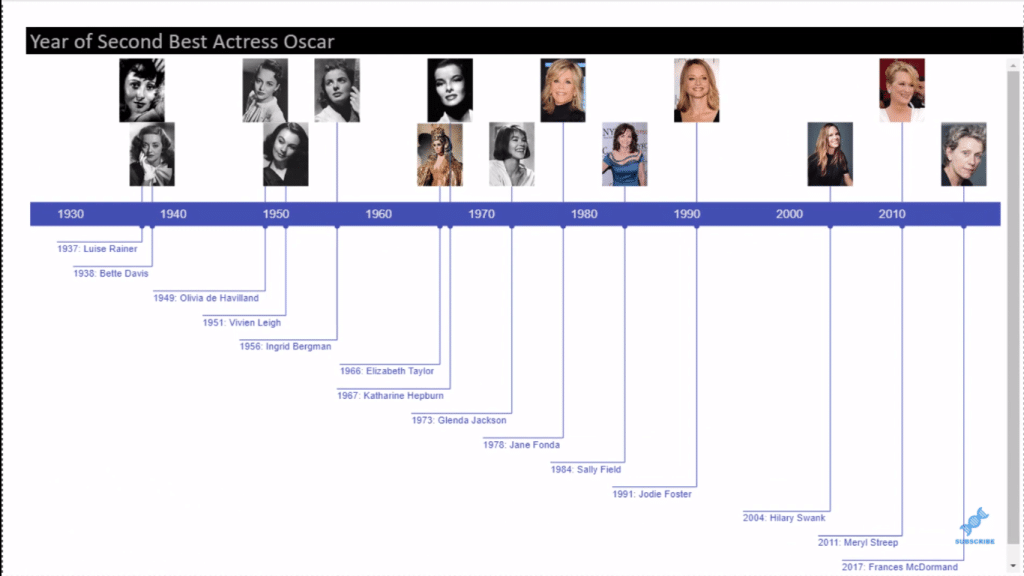
Before we go into the solution, let’s review the nature of the problem. I’ve given a big data set from Kaggle of 93 years of Oscar data. We wanted to pull out the best actress, winners, and particularly those women who had won more than one best actress award and then to visualize using the Queryon Timeline the year in which they won their second award.

I had a number of objectives when putting this problem together. What do we want the problem to focus on and what do we want the main objectives to be?
And in this one, there were three of them.
The first one was to learn or develop some practice with the Group By and All Rows construct. It’s something that I’ve been really focusing on because it solves a wide range of problems quite simply and oftentimes eliminates the need for some very complex DAX.
The second objective is particularly for folks who were not used to working in M. I wanted to create a problem that would develop some comfort in writing basic M code. I wanted to force that mode of thinking about what it is like to develop basic M code and the process of doing that.
According to a chapter in Gil Raviv’s book on Power Query, about 40% of problems in Power Query can be solved just through the user interface. But that, with the addition of some basic M code and the ability to create custom columns, is really not that hard. You can bump that percentage up over 80%. You can double your problem-solving capabilities with some fundamental, simple skills.
The third thing I want to do is introduce the Queryon Timeline custom visual to those who are not familiar with it. It’s one that I’ve really come to love. I’ve used it in a number of different instances and I think it just provides a really unique way of visualizing data.

Solution Approach To Problem Of The Week #9
In thinking about this problem, I wanted to do a thought experiment. What if instead of a CSV file, I just gave you 93 slips of paper (one with each year’s Best Actress winner), what would the solution look like?
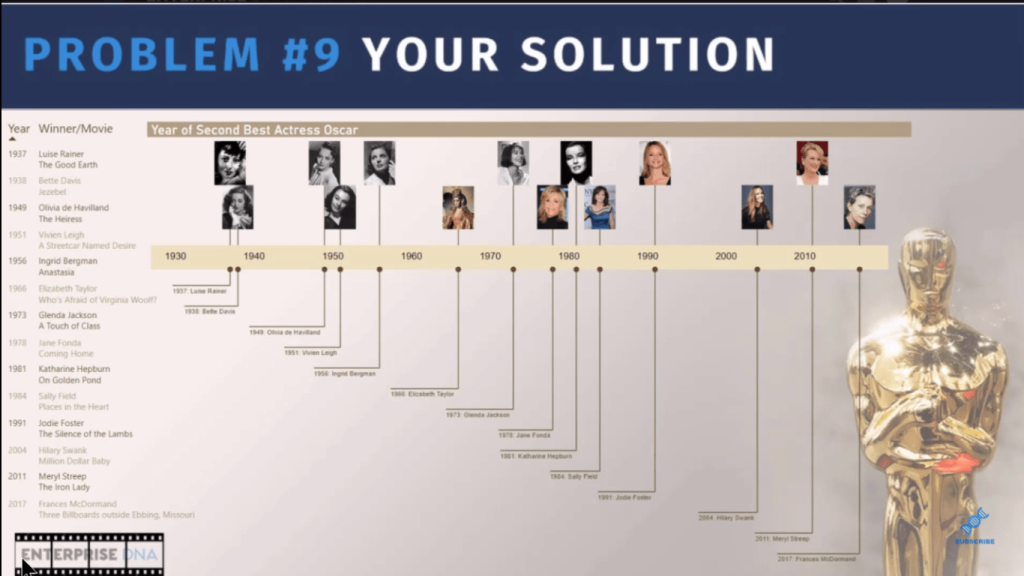
Your solution would probably look something like what I’ve got below.
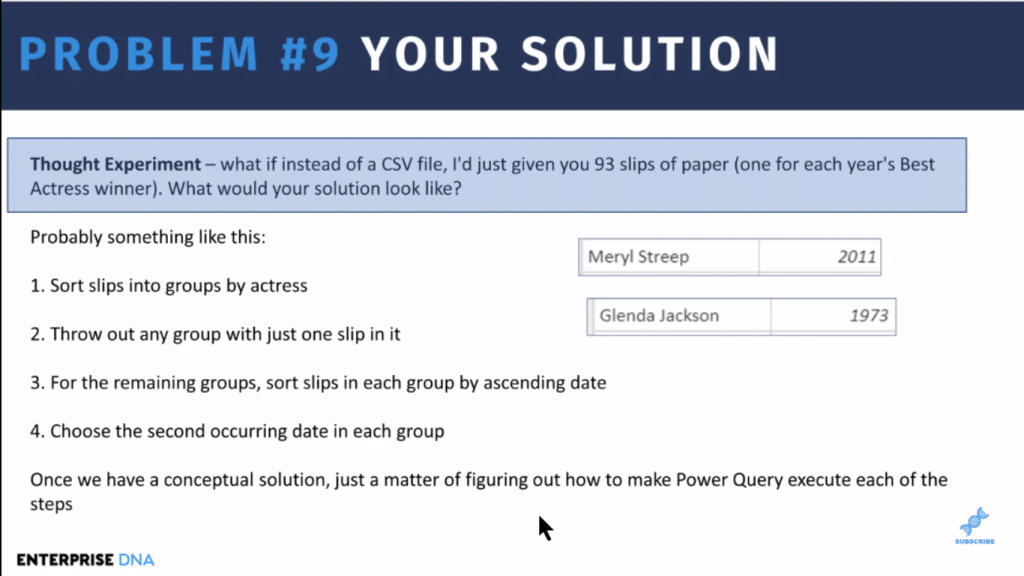
I think everybody would have a relatively similar solution to that. Once you’ve got that conceptual solution, then it’s just a matter of figuring out how to make Power Query execute each of those steps.
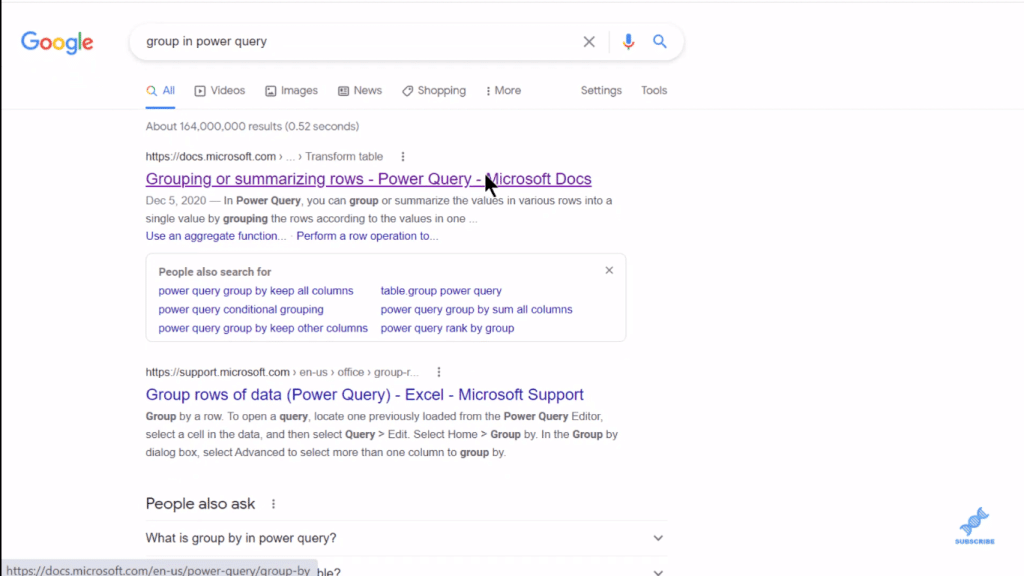
And so, I’ll just take this as a broad outline, and then go through how they operationalize this conceptual solution into something in Power Query. The approach we’re going to use is what Melissa, our resident Power Query guru, refers to as learn by Googling.
Now if we go back to our conceptual model, the first two steps include sorting the slips into groups by actress and throwing out any group with just one slip on it. So, we want to do a count. If we don’t know how to do that, we can go into Google and try to search for a term. In this example, I tried “group in power query”. With that, we can find everything we need to know about how to do this grouping.
Using Group By In Power Query
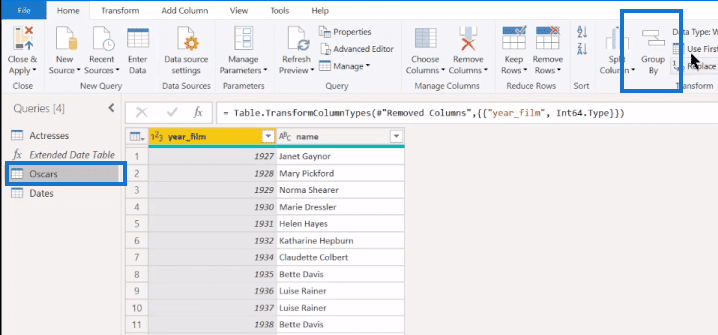
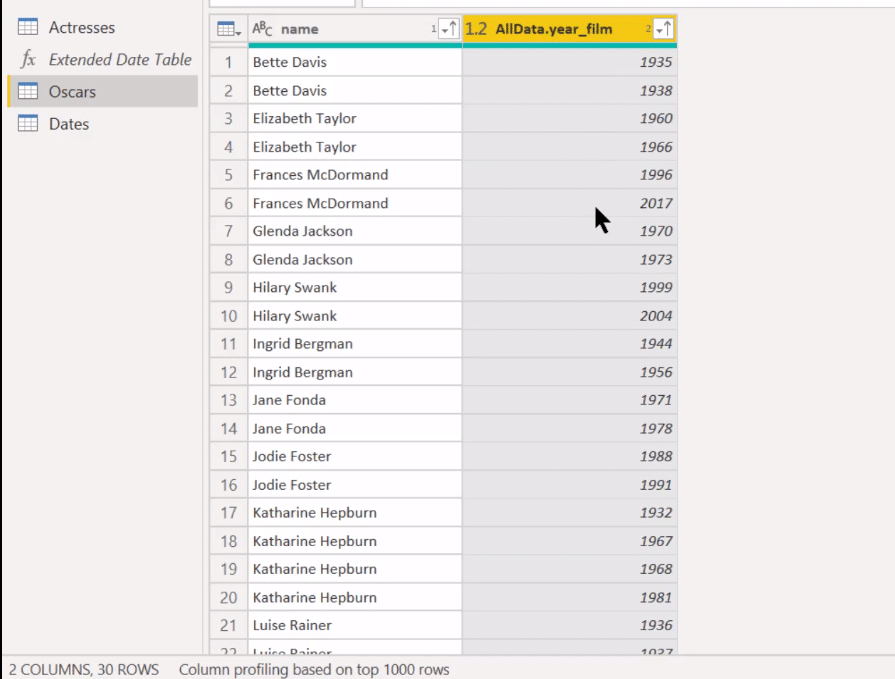
Then we can jump into Power Query and start operationalizing our solution. What I’ve done is that in this Oscar’s table, I’ve just gone through and pulled in the CSV file and filtered down to the Best Actress winners for each year. So, we’ve got just the 93 rows of just Name and the Year of the film.
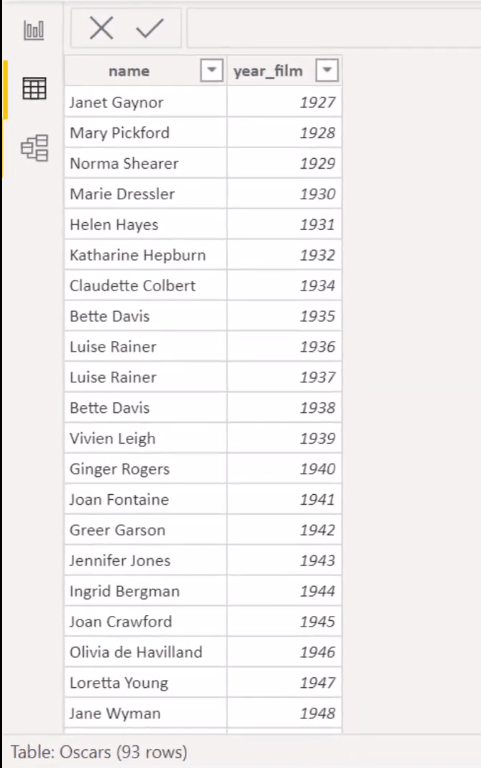
If we go into the Power Query and go to that table, the first thing we want to do is this Group By.
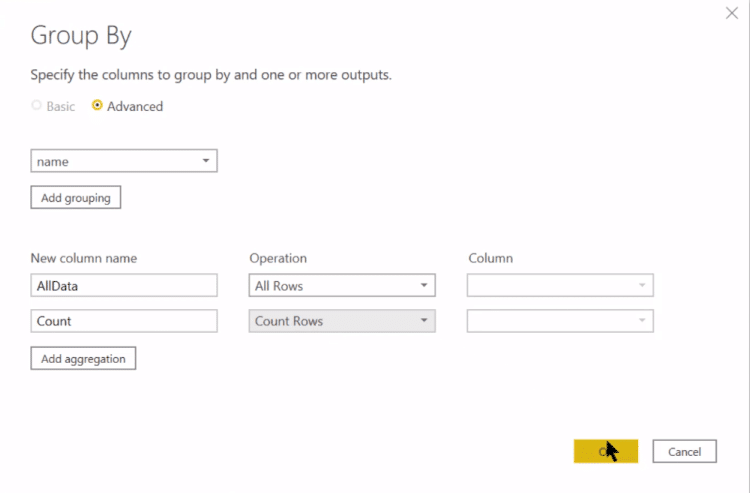
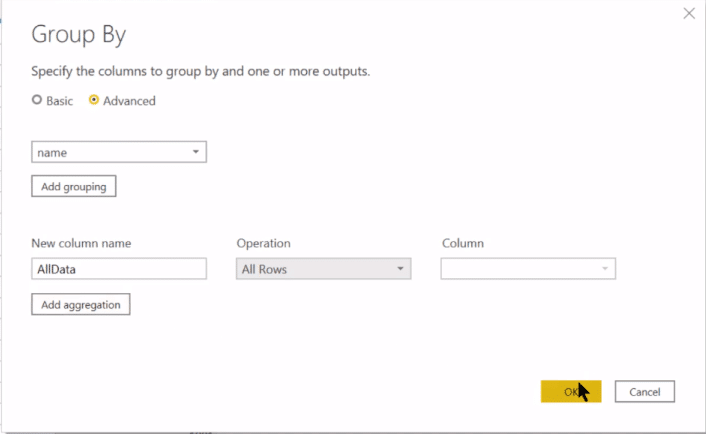
I always liked to go Advanced just because it just provides a slightly better interface even if what we’re doing is pretty straightforward.
We want to group by Name, then let’s have a column, AllData, and this is just going to be our All Rows. Instead of returning just the aggregate, it’s going to return the aggregation, but with all the rows that we want still remaining intact.
We’ll have another column called Count and we want it when we’re going to Count Rows. We want to find the number of slips in each pile. Then, we click OK.
We can then click on this white space in the table, and we get just one slip.
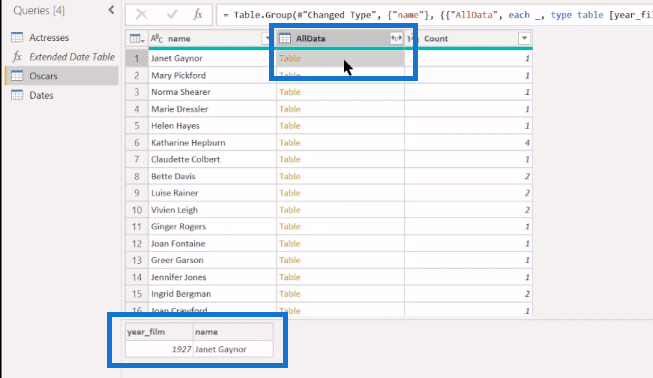
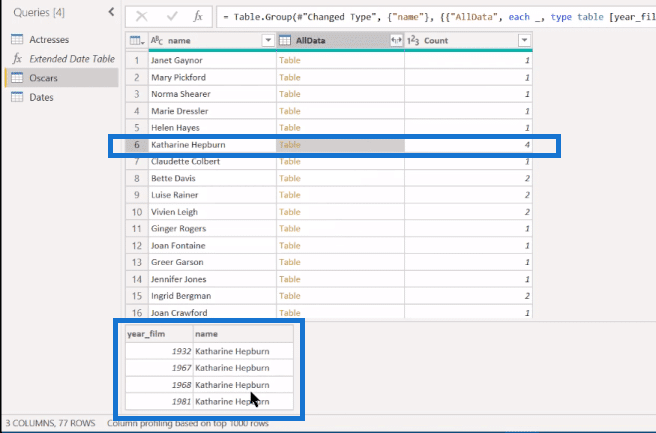
But then for the ones that have multiple counts, you’ll see we get all the records.
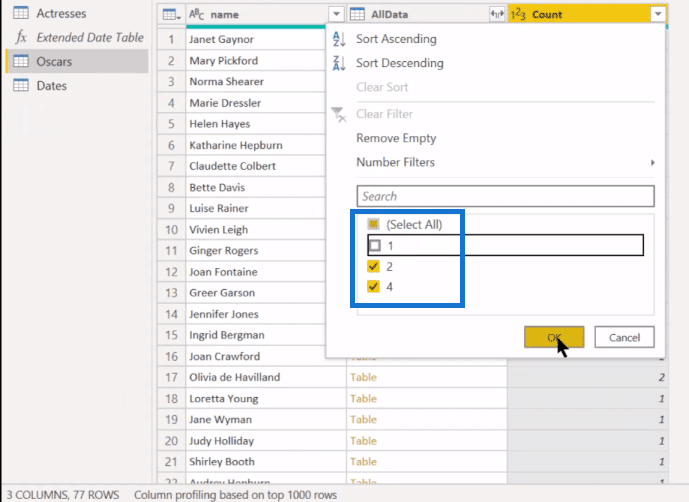
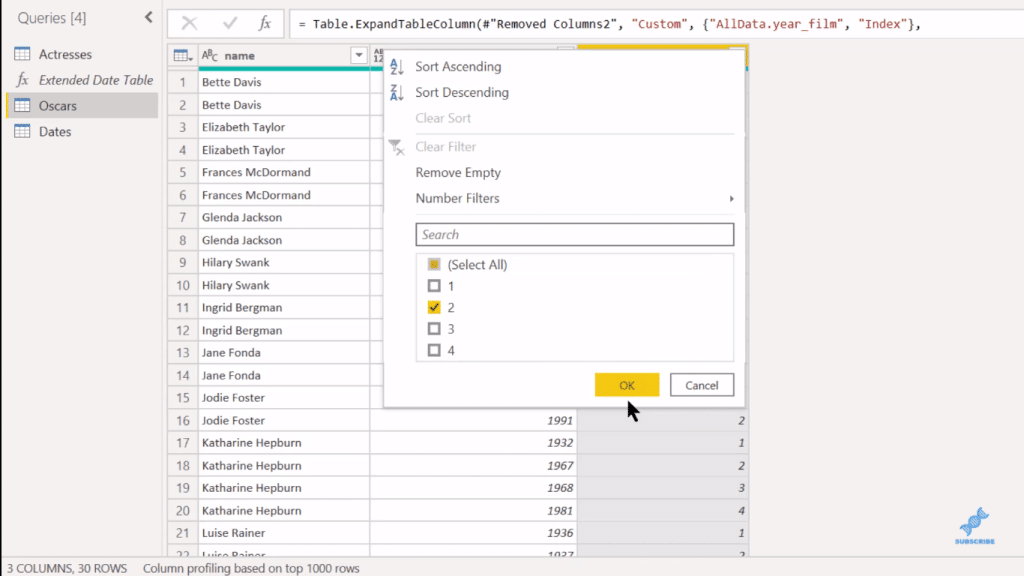
Next, we want to filter out the ones (1). So, we’re basically trashing all those piles that just have one name. Select 1 and click OK.
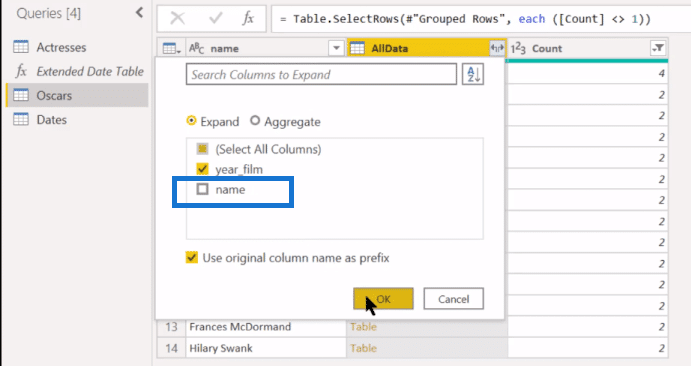
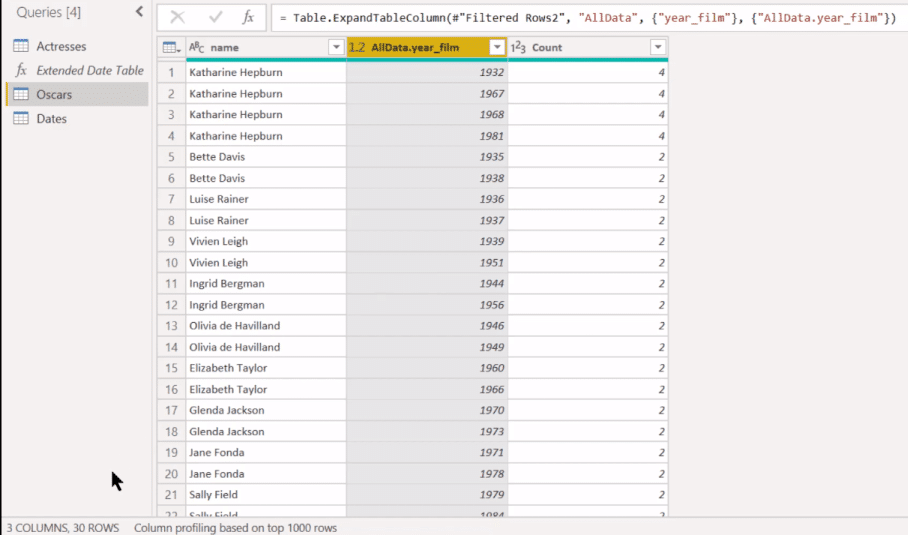
And we’re now down to the 14 multiple award winners. And we’re now down to the 14 multiple award winners. If we take and expand that, we can take out Name because we’ve already got Name here and just keep year_film.
We’re now down to 30 rows because some of these are going to have multiple wins. And we can actually even get rid of the Count column because we’ve already thrown out the 1s with just one.

Now we to go to the next phase of our conceptual model, which is to sort slips in each group by ascending date, and then choose the second occurring day within each group.
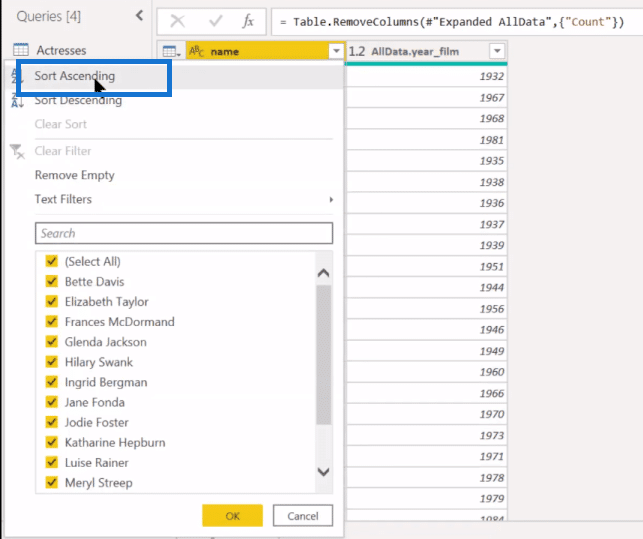
Sorting is easy. We can go back into Power Query and do a Sort Ascending by Actress and then by Date.
And it’ll show you a one and a two.
So we’re sorted well, and now we want to have like an index or a ranking that has for each one, and then be able to take the second one in each pile.
Incorporating Table.AddIndexColumn M Code
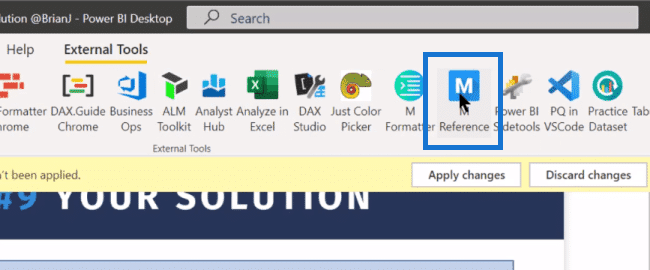
And so now we’re back to our “Learned by Googling” approach where we can just search rank or index, but we can also go to the Microsoft Reference Guide. I’ve created an external tool that I use all the time that just bounces you from Power BI into the Microsoft Reference Guide.
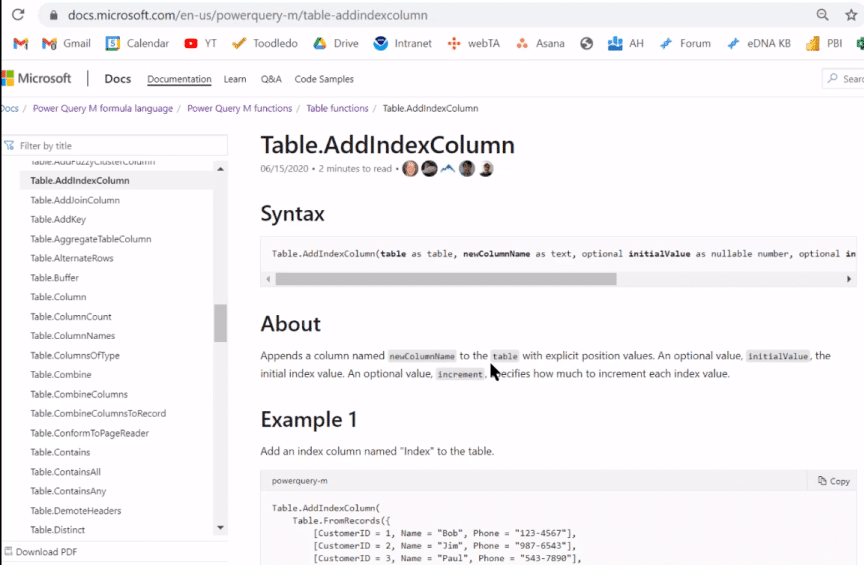
In the Microsoft Reference Guide, everything is grouped by function and it has a filter box where you can search for whatever you need. In this case, we type Rank or Index in the filter box. It doesn’t give us anything for Rank, but for Index, we have this Table.AddIndexColumn, which is relevant and applicable to what we’re looking for. It also provides some examples of how to use this function.
So let’s go into Power Query and let’s regroup our table by Actress.
With that, we get the 14 winners group by Table. And if we go in any of these tables say, Frances McDormand, we can see that the table is sorted by Date.
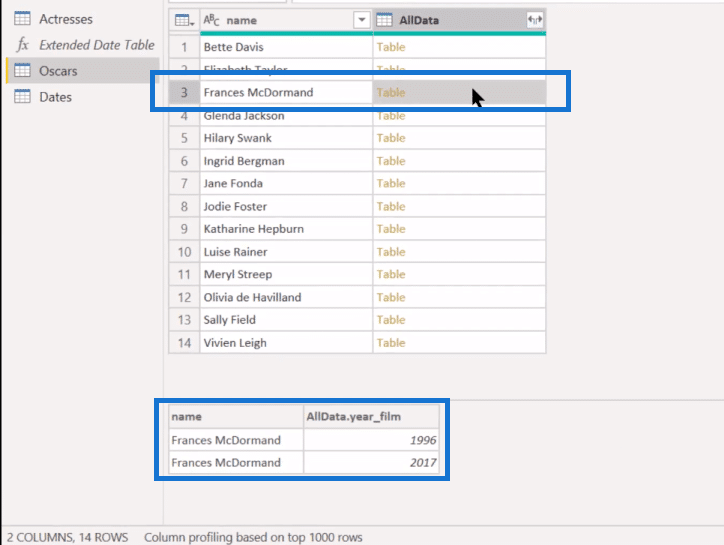
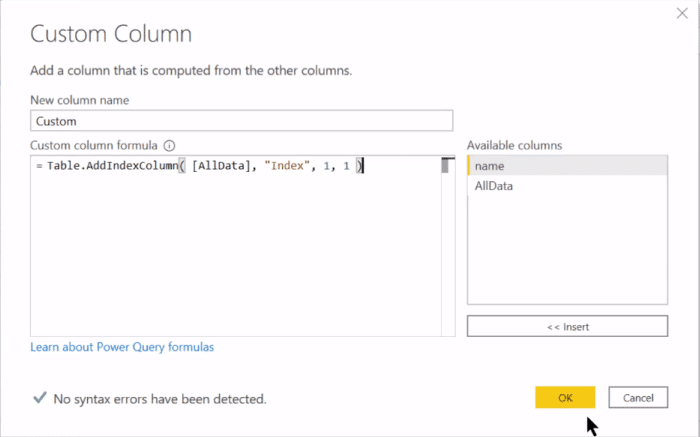
And then, here’s the big step, which is adding a Power Query custom column and enter our M code. We’ll have the Table.AddIndexColumn, then add the field AllData. We’ll call our new column (as text) in here as Index, and we’ll start our Index at one (1) and increment it by one (1).
And we get this perfect index here.
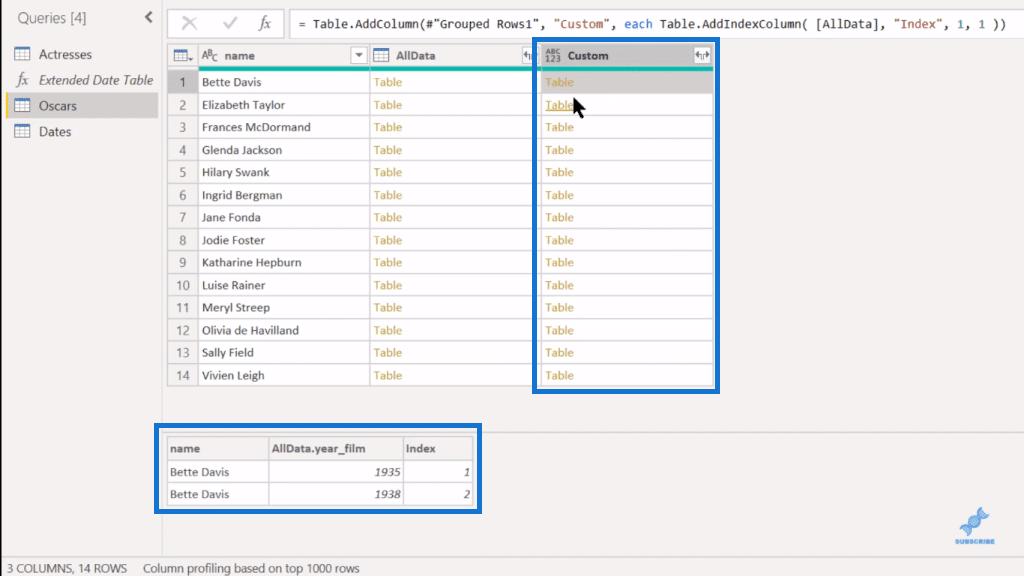
Now, we can delete our AllData column here since everything’s picked up in the Custom. Next, we can just expand the Custom column out, take out Name, because we’ve already got Name here as well. With that, what we’ve got is that numbered index for each one.
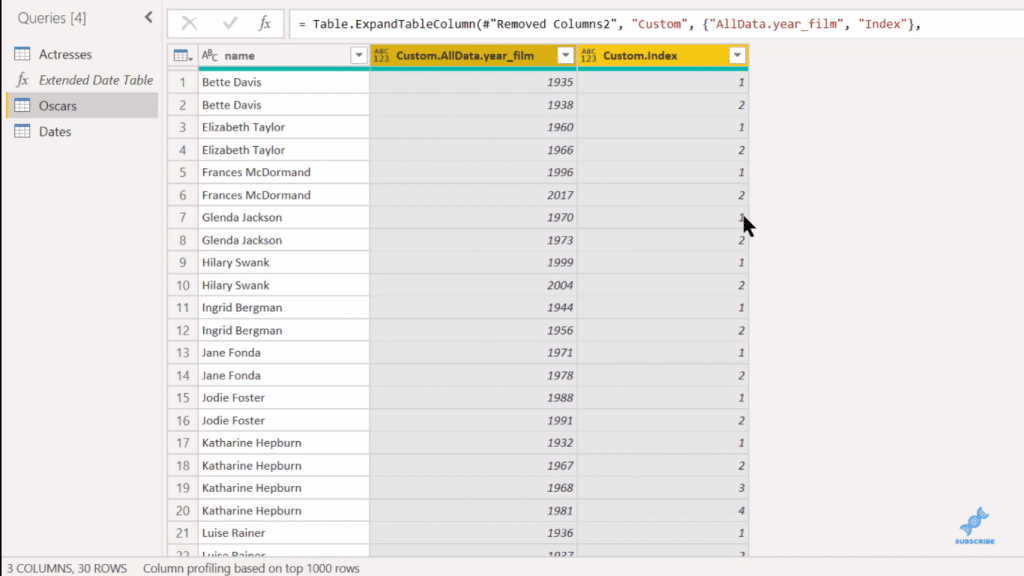
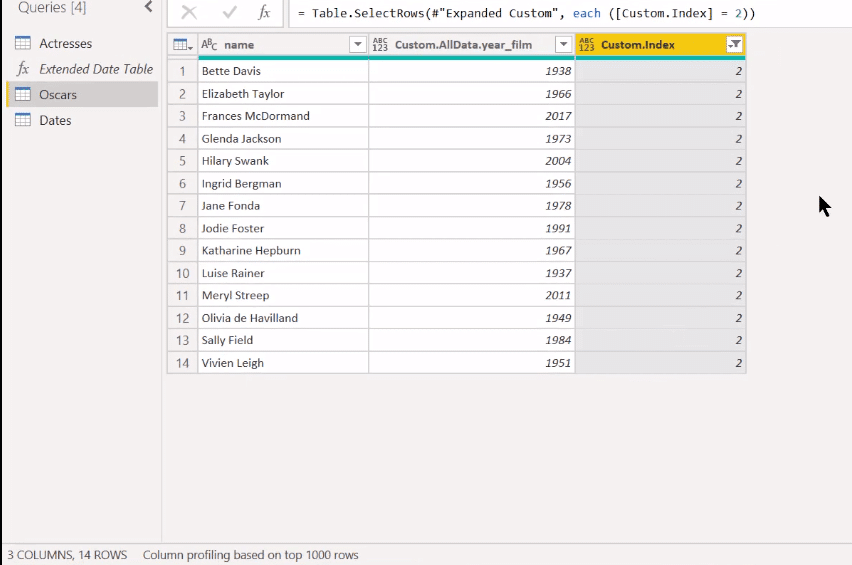
Lastly, we can do what we did on Count, which is filter out all the ones that are in the second win.
And there we go. There’s our solution.
Visualizing Using Queryon Timeline Custom Visual
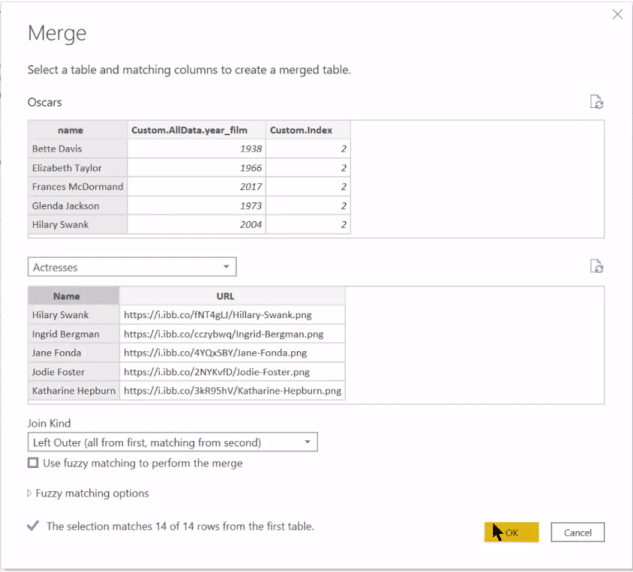
There’s a couple of other things we want to do here, which are all based on the implementation of the Queryon Visual. We’re going to do a merge and just add in the picture URL.
So we’ll merge queries, pull up that Actresses table, and we’ll merge on Name. We get 14 to 14 rows matching, which is good.
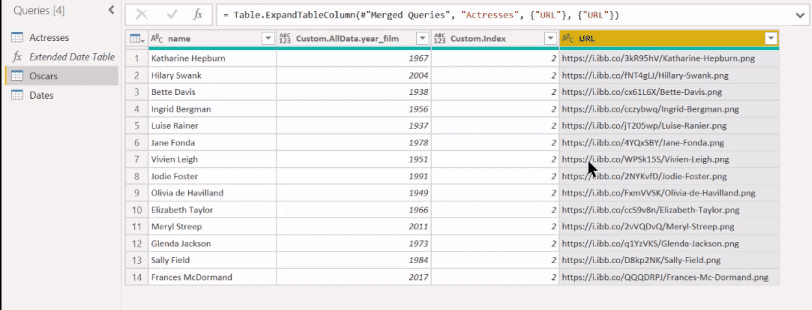
And then in the Actresses column, we’ll just expand out and we’ll expand to the URL.
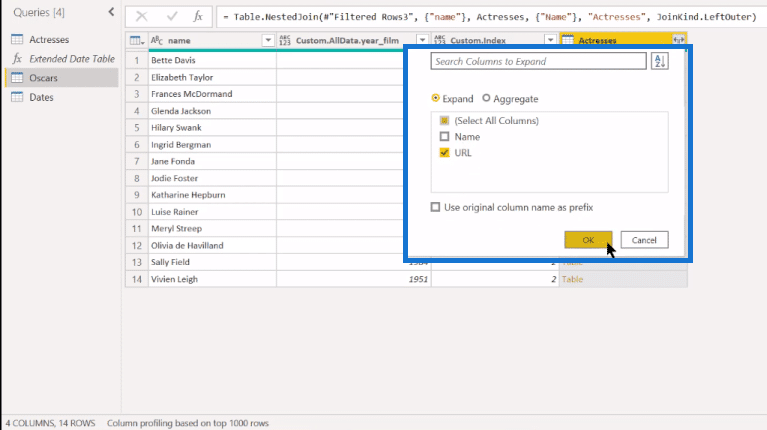
And now we have this column with the URLs.
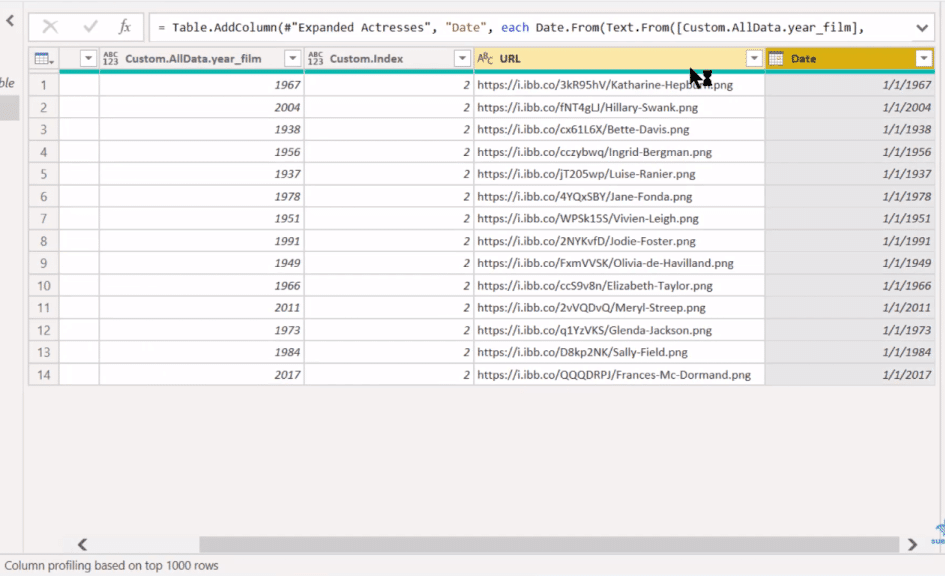
There’s one other thing that comes with the knowledge of the Queryon Timeline. Queryon works best when it’s dealing with full dates rather than years. And so, this is something that just comes with experimentation, but we can take the Year column and create a Column From Examples. What we want to do here is just turn the years into dates.
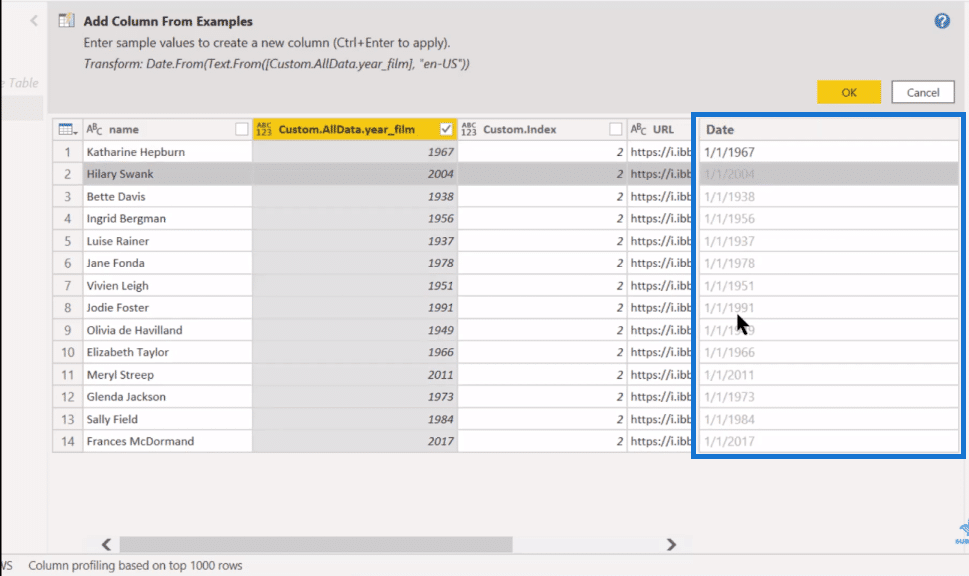
That’s going to make the formatting better. That’s something I wouldn’t expect you to know right off the bat, but it comes with practice with Queryon. We click OK, and that goes in as a date value. We can delete the index table because we don’t need it anymore, and we can then change the name of column year_film to Year.
Let’s now jump into the visualization aspect of this and I want to highlight the entry of one of the Enterprise DNA members, Jose, who really did a great job on visualizing.

Going back into Power Query for the visualization, it’s worth mentioning that Microsoft recently implemented some changes to the way they certify custom visuals. As part of that certification, they tightened down on the use of external URL images.
If you actually use the version of Queryon Timeline that’s on the App Source (version 1.05), you’re not going to be able to pull in these URL images. And so, you now have the option of using this 1.04, keeping the URL images, where they have on their site a way to embed binary 64 images directly into the PBIX file.
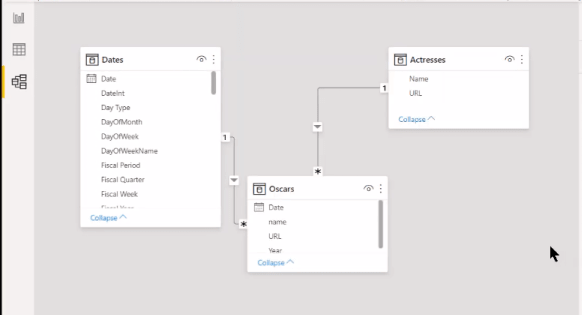
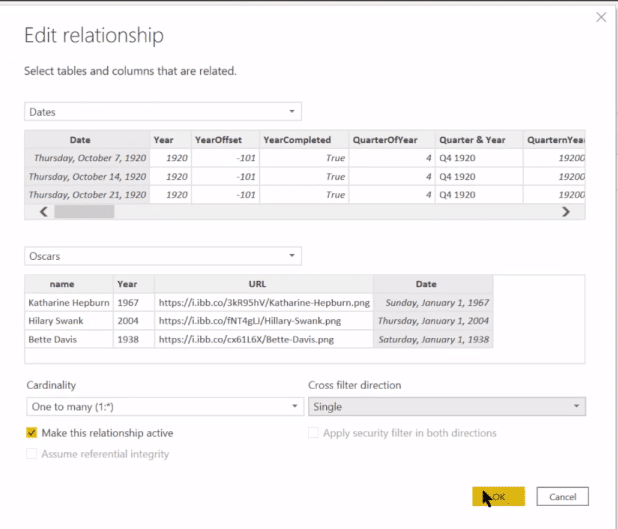
Now I mentioned changing that year into a date field, so we need to connect that to our data model.
Let’s just change it from one to one to a one to many, and Single direction on the Cross filter, and then make this relationship active.
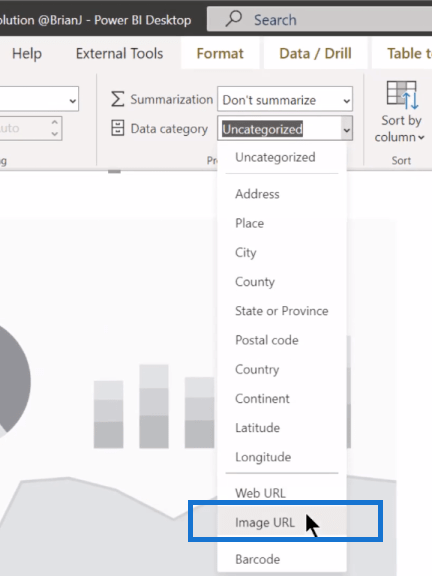
Next, for the image URL field, we need to make sure that in the Data category, it’s showing not as Uncategorized, but as Image URL.
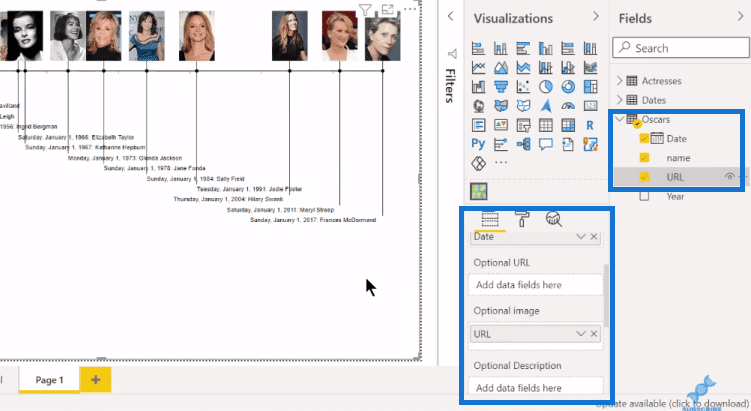
Now that we’ve got everything prepped nicely, we just drag and drop the Name, the Date, and the URL fields. The rest of it becomes really straightforward clean-up in the format options.
***** Related Links *****
Power Query Table: How To Dynamically Merge Columns
How To Merge Queries In Power BI
Extract Values From Records And Lists In Power Query
Conclusion
Hopefully, I got you excited about adding M code to your repertoire. I’ve shown you how to set up a conceptual model and implement the Learn by Googling approach. I’ve walked you through the steps in incorporating M code into a custom column and visualizing the results using Queryon Timeline.
I hope you found that useful. Watch the full video below for more details on the tutorial and check out the links below for more related content.
All the best!
Brian


