In this tutorial, I’m going to teach you how to highlight trends by using moving averages in Power BI in various ways. You may watch the full video of this tutorial at the bottom of this blog.
We can calculate one moving average and easily transfer the same formula into calculating other moving averages. All that’s required is changing one parameter inside the formula.
This is a technique which I talk a lot about because it is such a valuable idea and developmental concept inside Power BI. It definitely speeds up looking for a variety of insights that you may be looking for in your data. Especially if you are looking for a way to easily showcase the underlying trends in your data without diving away the day to day data.
This tutorial is also a great review of how you can utilize measure branching inside of Power BI.
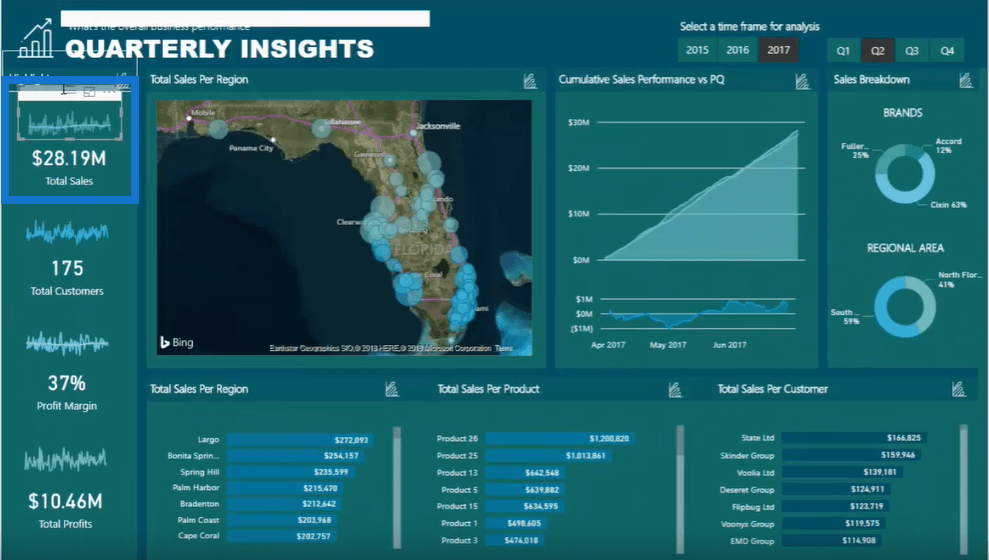
In this sample report for Quarterly Insights, I have actually created different moving averages beforehand. I want to teach you how to reuse these formulas relatively quickly to achieve additional insights.

Calculating Moving Averages For Total Sales in Power BI
Let’s look at this calculation for Sales 1M MA. The AVERAGEX function here looks at any particular day, and opens a time window in the future. After that, it calculates the average of all the results in that window. That’s because of the DATESINPERIOD and LASTDATE functions that I have also added.

Since it’s calculating for Total Sales, the formula looks at the total sales for every single day of the last month and works out the average of all those sales per day. That’s what this formula is doing.
Another great thing is that you don’t need to recreate the formula every time. You just have to copy and paste some existing formula and rearrange them. The first one actually calculates the total sales as you can see from the insight in the report.

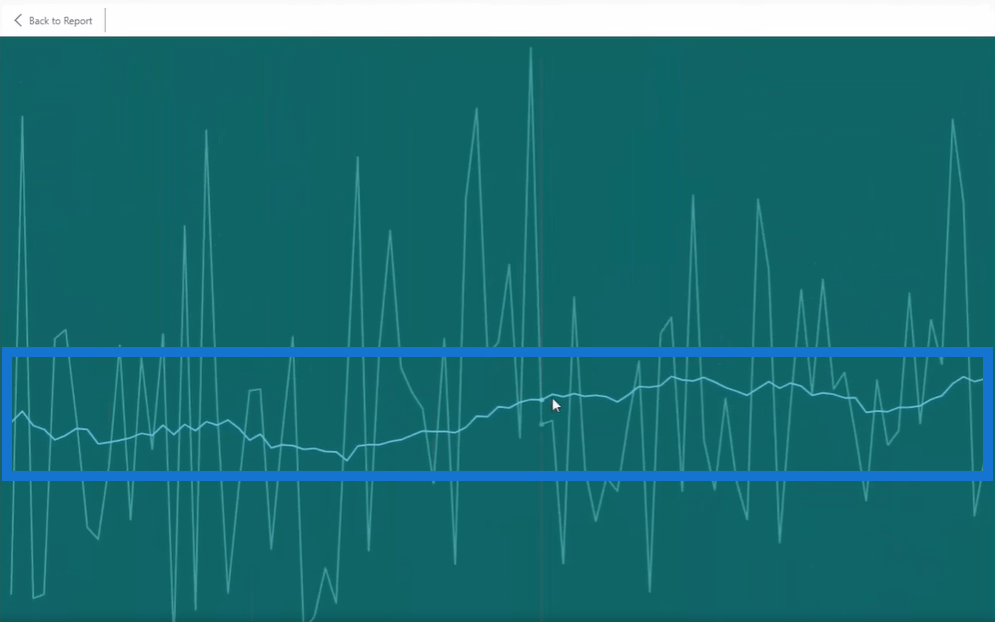
If you look closer, you’ll see that you’re looking at the total sales per day. But you’ll also notice from the visualization that I have overlaid the average trend.

As shown, the average trend for the total sales is increasing slightly based on the particular time frame that I have selected.
Finding Out the Profit Margin Average
The same can be seen with this formula here for Margins 1M MA. It’s a moving average of the margins that we have been achieving.

This formula is doing exactly the same logic from the previous sample calculation. The only thing that is different is instead of Total Sales I now have Profit Margin.
Now, if you dive deeper into the data, you can see that the margins for every single day are jumping around quite a bit. This can depend on many things like regions or products. But in this case, you can clearly see the moving average of the profit margin and it’s a bit dynamic.

Calculating The Average of Total Profits
Now, there’s an additional technique that I want to show you. I actually recreated the profit margins moving average and copied it into another measure called Profits 1M MA.
You can see that I have just changed the last part from Profit Margins into Total Profits. So this moving average will be about the total profits for a particular time frame and I can then add this into my visualization.

Just drag it down to the report and then do a few things to clean up the look, color, shade, and everything else. Now, if you look at it, it’s also increasing slightly while the profits per day are jumping around a bit.

Moving Averages in Power BI for Total Customers
The last thing that I’m going to teach you is about the moving averages of Total Customers for a particular time frame. As you can see in the sample report, the total customers for the second quarter of 2017 is 175.

If you look closely at the data, the number of customers are actually changing day by day. I can say that the trend here is very dynamic.

Now, let’s get to the formula. To create a new moving average for this, just copy the existing formula then click New Measure. Paste the formula and then change the old title to Customers 1M MA. Lastly, change the last part from Total Sales to Total Customers.

That’s all you can do to reuse the formula for moving averages in Power BI. Simply amazing technique right here. After that, you can then add it to your report and improve the visualization.
Now, you can see that I’ve got a moving average trend line representing the total customers per day.

What I have just taught you is a great way to show moving averages more effectively. At the end of the day, you don’t want your trends to combine with all the other things in Power BI. By utilizing these moving averages in Power BI into a great visualization, you can always get the right insight.
***** Related Links *****
Using Moving Averages To Show Trends in Power BI
Measure Averages Per Day Using AVERAGEX With DAX
Understanding How The AVERAGEX Function Works
Conclusion
So, from maybe creating one moving average calculation, you can easily generate four or five in under a minute.
What I just covered came from a session that I run during the Enterprise DNA Learning Summit. If you would like to register for the summit, you’ll get access to a free three-day event, six sessions, and you can download many high-quality resources that demonstrate a number of advanced analytical ways to utilize Power BI. You can check this event for more details.
Enjoy working through this tutorial and see if you can work this logic into your model as soon as you can. You should see the benefits very quickly.
Sam


