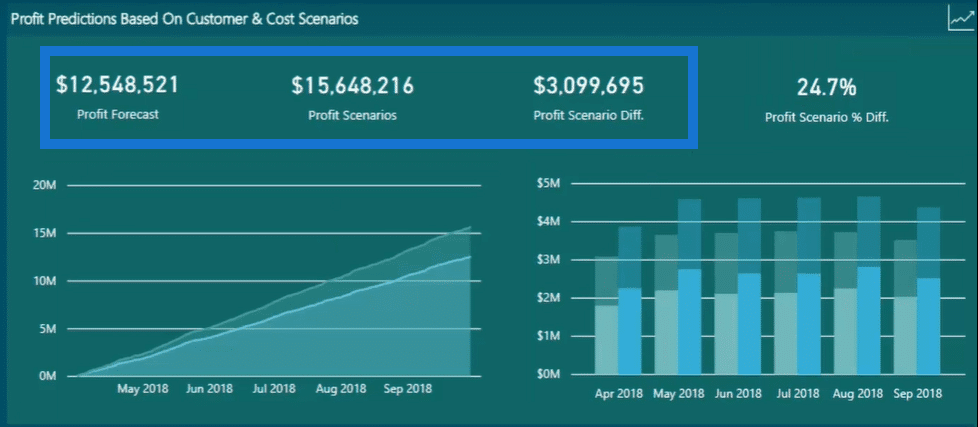
What I want to cover with this tutorial are some great examples of profit prediction in the future using Power BI. To achieve this in Power BI you need a number of different modelling and formula techniques, but you must be able to use them correctly and simultaneously. You may watch the full video of this tutorial at the bottom of this blog.
When it comes to the output that you can create inside Power BI, you can predict what might happen in the future by ‘shocking’ some variables around in your calculated logic.
In this tutorial, I’m trying to adjust variables such as how many customers there are as well as the cost of goods sold to those customers. Moreover, I’m attempting to predict what the ultimate outcomes would be if any of these scenarios played out.
What I’ve also enabled in this particular report page is some sensitivity analysis. Not only can we see the end results, but we can also see the variations of results based on the sensitivity inputs that we place inside our reports.
Profit Prediction Based on Customer Changes
In my sample dashboard for Profit Predictions report, the first thing that you can see is the table for Customers Change Scenarios. This is the first thing that I made since I want to know how things would be if I could successfully increase the foot traffic into my stores after some marketing efforts.
This table explains how things would play out if I increased my customers by 4 percent (4%), for instance. Also, I want to know how it would affect the underlying trend of my profit in the future.

Basically, I just need to work out the customer forecast first based on the projected foot traffic of customers. Then, I could just increase or decrease the customers using the selection tool.
After that, I need to somehow incorporate this customer increase into the sales data. So I just multiplied the projected customer increase by the average sale per customer that you can see in Avg. Sales Per Customer. From there, I can integrate it to finally show up in the different profit scenarios.
Furthermore, the results for that would give us part of the equation for sales. As you know, Sales subtracted by Cost will give us Profit. So, this part corresponds to the sales part of the equation.
Profit Prediction Based On Cost Changes
Next, I’m going to look at the changes to the costs in the Cost Change Scenarios table.

For example, the customers has increased by 7 percent (7%) and the costs per item that we are selling has decreased by 10 percent (10%).
Now, you can automatically see the results for that scenario in the Profit Predictions Based on Customer & Cost Scenarios table over any time frame.

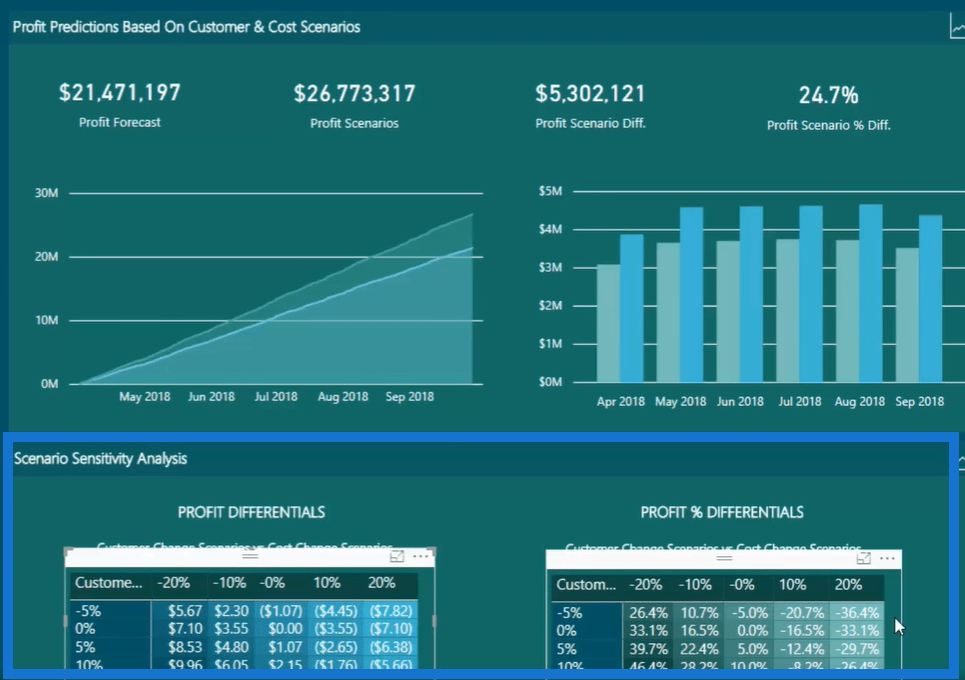
For instance, I’m going to look at the results for the second and third quarter of 2018. You can see that the initial profit forecast is around $21 million dollars. And based on the change scenarios that I have selected, it is predicted that the profit will increase to $26 million. Meaning, there is around $5 million difference between the profit and an impressive 24 percent (24%) difference in the profit scenario.
In the graph below, you can see the dynamic increase of profit from May 2018 to Sept 2018. You can also see how it changes every single month in this table here.

Predicting Profitability For Different Regions
I’ve also created a table for Regional Groups Breakdown and you can see that it has data for South and North Florida.

Now, I’ll jump to the Quarterly Insights report where you can see a graph here for the Total Sales Per Region.

This is where you can see how divided our sales are based on regions. After seeing the results, you can then research the reasons why there is a big gap between the sales of these regions. It could be because of the management group or it could just be for geographic reasons. That’s where the sales team works.
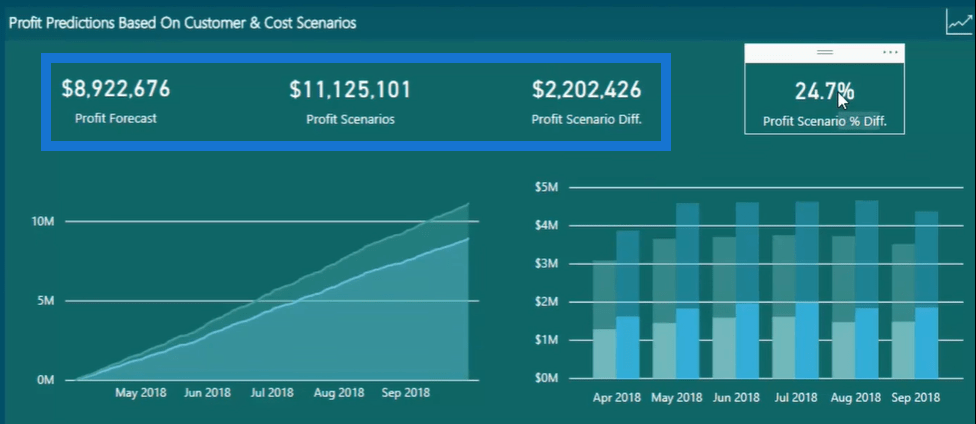
Going back to the Profit Predictions report, if you want to focus more on the data for South Florida, just click South Florida from the Regional Groups Breakdown table. As you can see, there will be a predicted increase in profit of around $3 million for South Florida.

Meanwhile, for North Florida, there will be more than $2 million expected increase in profit.

Creating Sensitivity Analysis
Another thing that I want to go through is creating sensitivity analysis. Instead of clicking through every different scenario here, you can actually create scenario analysis tables. These tables will give you the profit differentials for all the different changes as well as the profit percentage differentials.
Take a look at this example that I set up beforehand.

As you can see, this tutorial is just a preview to a more in-depth event around scenario analysis. If you do want to learn more about all of the individual techniques that go into making this work, certainly check out the Scenario Analysis Deep Dive course at Enterprise DNA Online.
***** Related Links *****
Predict Future Profitability Within Power BI DAX Functions
How You Can Predict Profitability In The Future Using Power BI
Forecasting Product Demand Using Power BI Analysis Techniques
Conclusion
This is some really unique analytical work that you can now do inside Power BI. It just requires utilizing the right features and techniques inside your models and formulas to get this working well.
This prediction type work that you can complete inside Power BI can produce some very impressive insights. So, I highly recommend diving into this one.
Enjoy working through this detailed video.
Sam


