I’m going to show you how to work through complex DAX formulas. Extensive DAX formulas in Power BI are normally used if there are unique insights that you want to show on your reports. You can watch the full video of this tutorial at the bottom of this blog.
One example of a scenario where a complex formula is required would be this question posted on the Enterprise DNA Forum.

The member was asking for a formula to use on Salesforce forecasting with ramp-up. Let’s look at this scenario and determine how to work with the complex formulas required.
Scenario Requirements
In the scenario given, we need to see how much discount is applied over time based on the sales made from a certain set of customers.

There is also an internal logic that we need to see monthly, which shows the ramp up and discounting costs to the business. It also shows an offset threshold for every ramp level.

Basically, the threshold sets a limit that dictates how much discount is given to the customer. As the customer buys more, they can reach a certain threshold and therefore earn higher discounts.
Every ramp up is dictated by a certain variable. In this case, it’s forecasted monthly sales.

On certain dates, for example, there would be a ramp up based on the forecast. This scenario is a perfect example of how dynamic DAX formulas in Power BI can be.
For this case alone, there are a number of ways on how to provide what is required. There are also a lot of existing formulas that you can apply here.
Cleaning Up Complex DAX Formulas In Power BI
In the forum, Brian Julius, one of our Enterprise DNA experts, shared his own formula that can be used in this scenario.

Before doing anything else, it’s best to clean up the formula first. You can use the DAX Clean Up tool, which can be found in the Analyst Hub App Centre.
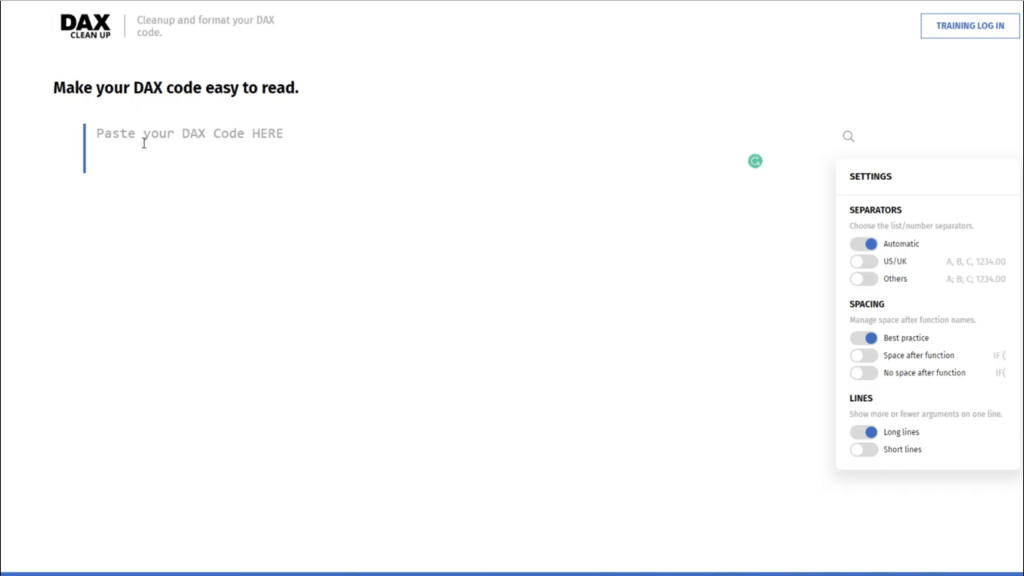
This tool helps you format your code properly so that it’s easier to understand. Just copy and paste the formula that you want to work on in the space provided.
Then, you can format the formula based on the formatting options given.
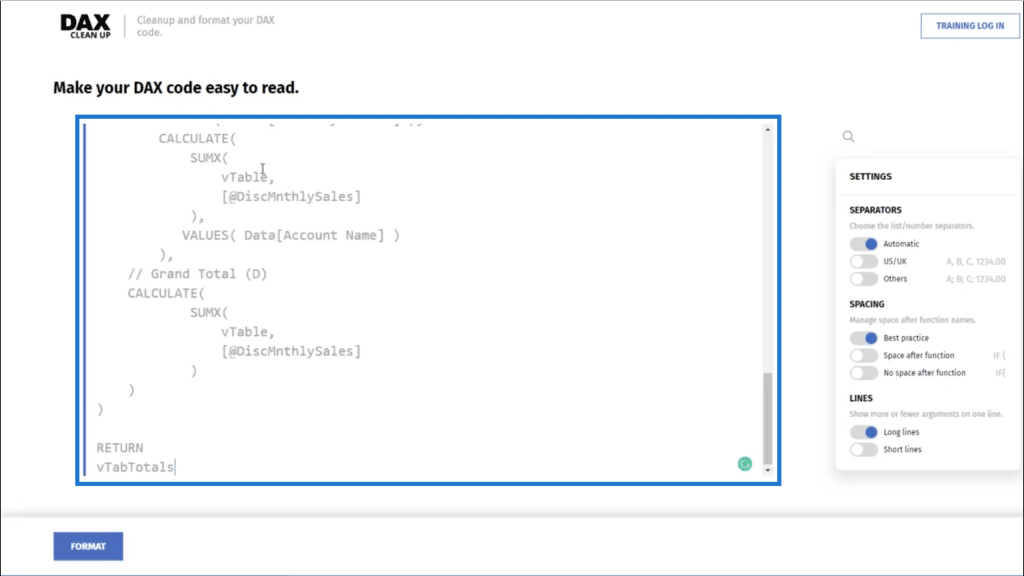
Since I personally want my formulas to be more condensed, this is how I would set it up.
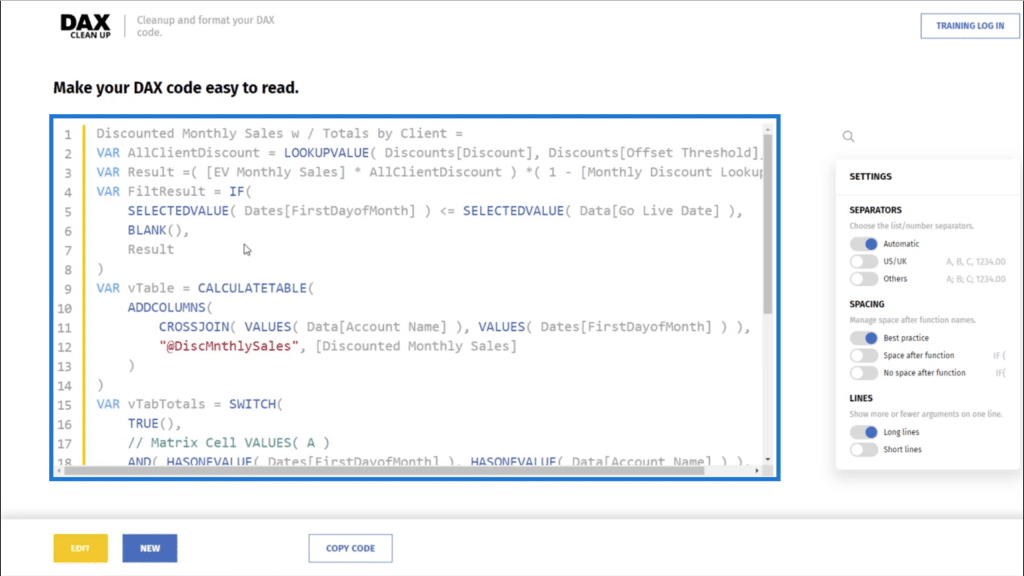
Of course, the final format would still be up to you. The important thing is that once you apply it to your report, you know how everything comes together so that it’s easier to make adjustments if needed.
After the cleanup, you can copy the formatted formula and paste it into your report. If you find that some tweaks still need to be done, you can do so directly in the formula bar.
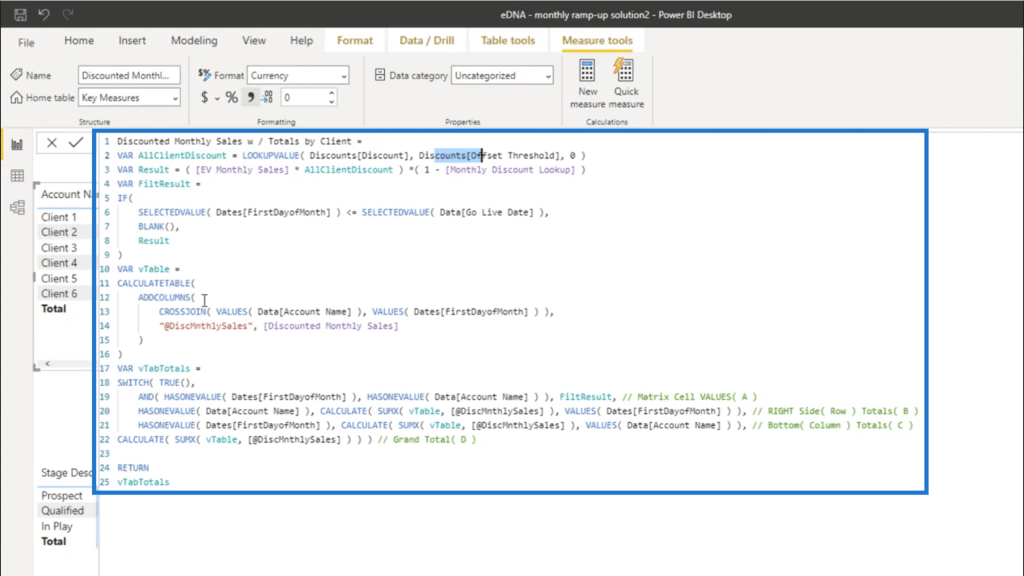
Applying Complex DAX Formulas in Power BI Reports
Now that the report has been formatted, it’s easier to look at what each part of the formula does to give us the results we need in our report.
For formulas that are as complex as this one, it’s best to use variables. In this case, Brian created one VAR for each logic.

Ever since variables were introduced, it has become easier to understand what is going on in formulas like this. Variables have made it possible for us to work on complex calculations like this and have changed the game in terms of advanced analytics inside of Power BI.
In the formula we’re using, the first variable is for AllClientDiscount, which shows the discount that applies to each particular client. We’re using LOOKUPVALUE here and referencing the Discount and the Offset Threshold.

The Result variable runs the logic that dictates the specific discount applicable when the sales go beyond a certain threshold.

With these variables, it’s easier to see the logic behind each part of the formula. If you tried to write this all out within one formula, it would be impossible to interpret.
Getting the Correct Totals
With everything properly laid out, we can now get the results that we’re looking for.
We have a Total running at the bottom for each month, and another Total running at the rightmost column for each client. Then, we have a Grand Total on the bottom right corner.

Here’s how we’re going to check for those Totals.
Going back to the data set, you’ll see that it did not give monthly data. It simply had a Go Live Date.

We only have the discount and threshold, but no data showing specific months.
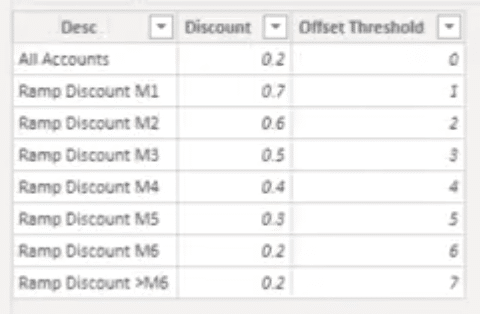
But we need to allocate results across every single month here.

This is why we have to create some unique calculations so that we can allocate results across every month. It’s not going to happen naturally because only the Go Live Date is given, when we also need to look at dates beyond that point.
That’s what this part of the formula is actually doing.
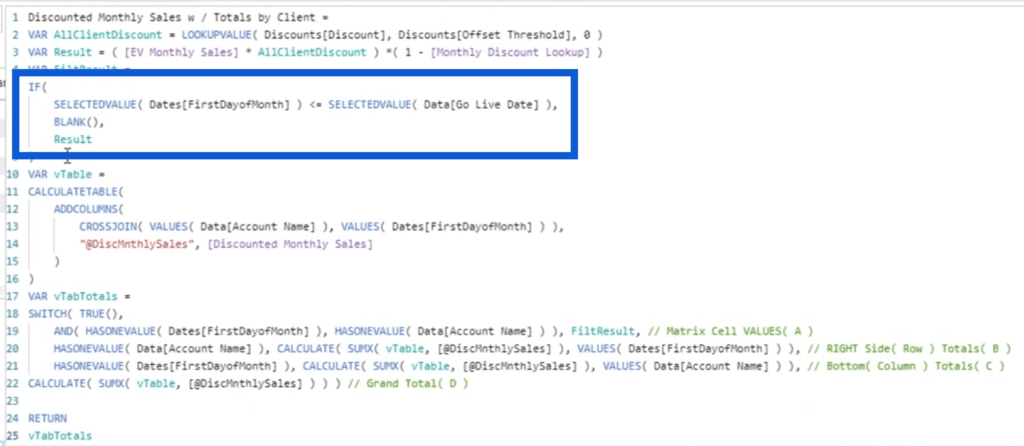
It asks for the SELECTEDVALUE and gives the condition that if the FirstDayofMonth is less than or equal to the Go Live Date, then we expect a Result.
We then have to create a virtual table.
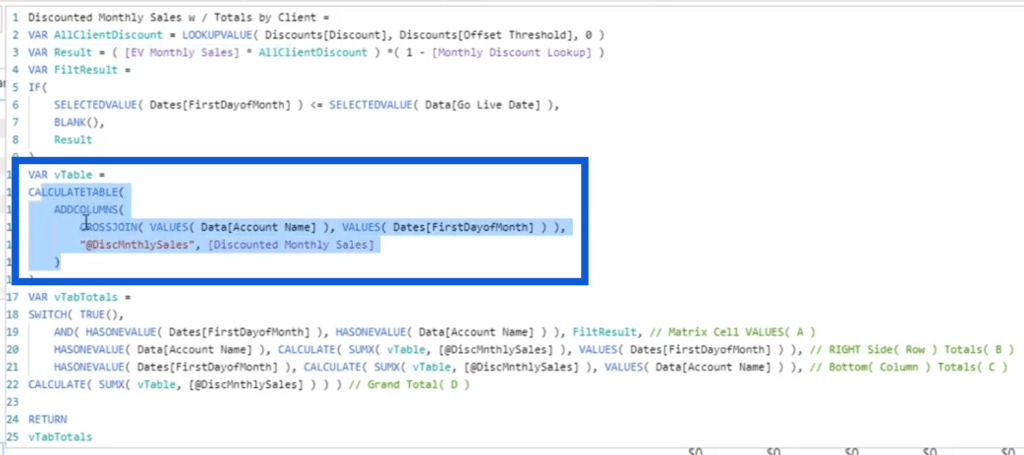
ADDCOLUMNS brings together every single Account Name and every single FirstDayofMonth. Then, we check for the discounted monthly sales for that particular month.
Then we allocate it through this part of the formula.

As you can see, it starts off by utilizing SWITCH, which breaks out where each value below it needs to go.

That’s followed by an AND, where we’re saying that if the first of the month HASONEVALUE for a certain Date and Account Name, then that value goes into the matrix.

If the Account Name HASONEVALUE, we iterate using SUMX through the vTable and reference the Account Name. All these go to the Totals on the right side.

Lastly, we get the total for the bottom part. So we reference the FirstDayofMonth columns.

After those three areas, we can finally CALCULATE for the Grand Total.

***** Related Links *****
Combining DAX Patterns Or DAX Formulas In Power BI
DAX Examples In Power BI – Advanced DAX Formulas
Power BI CALCULATE: Key To Advanced DAX Formulas
Conclusion
This is a perfect example of how you can solve for totals. Again, there are a lot of DAX formulas in Power BI that can help you do the same thing.
I just wanted to highlight that when your DAX formula flows as nicely as this, it’s easier to sort things out. The mere formatting alone already makes a huge difference especially when you’re working with really complex formulas like this.
If there are any parts here that you didn’t understand, then you can go ahead and search in our blog or on our channel about that specific part. For example, if you don’t understand what virtual tables do, we actually have a lot of tutorials about that within our resources. If you’re not sure what CALCULATETABLE means, we have resources for that as well.
All the best,
Sam


