In this tutorial, we’ll go over the Natural Language Query (Q&A) feature in Power BI. You may watch the full video of this tutorial at the bottom of this blog.
There’s so much you can discover just by writing these Google-like queries inside the search bar and dashboards in Power BI.
This feature isn’t just for simple queries. It can also be used for very advanced insights that you have set up inside your Power BI Desktop.
If you build something intuitive and optimized for searching data or results, you’ll be able to utilize the Q&A functionality very well.
This is a very detailed tutorial because there’s so much to show you how you can utilize Natural Language Query to quickly discover insights within your reports.
Background On The Q&A Feature
As a tip before starting, make sure your row-level security is on when doing your report in Power BI otherwise the Q&A feature won’t work.
Moving forward, look at this detailed report.

Now, the key when it comes to the Q&A feature in Power BI is that it won’t work if your model is not well-built.
It’s not enough to just be able to read and know your data. You must also make sure you have good measures that are named well, and optimized your calculations.
The Q&A feature is a key part of the dashboard.
There’s no point in placing a lot of visualizations inside a dashboard when you can just make your report look like a dashboard and utilize bookmarks among other features.
In this case, an image has been put in the dashboard.
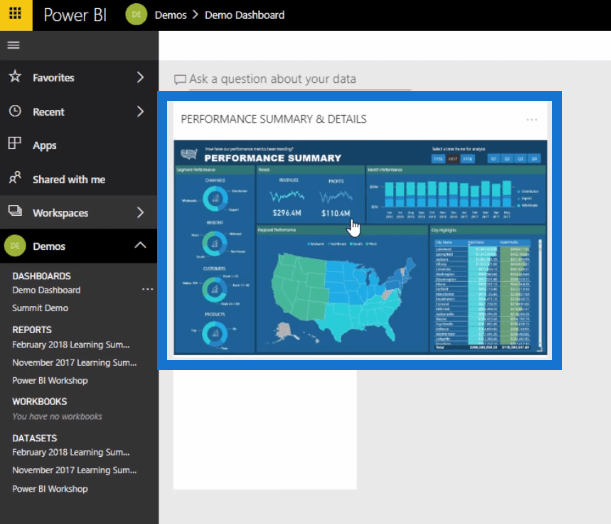
Clicking this image will allow you to move in between different reports. It’s a good way of dynamically jumping between one report and another.
This feature, however, does have a downside. It’s the colors. You can’t customize the colors. Q&A doesn’t carry over color themes that you’ve used in your report. That’s the reason why this feature should be used in isolation within your dashboard.
Creating Reports Using Simple Queries
Let’s go straight into an example.
The Q&A feature allows you to look at any report that you have a link to.

Basically, it’s anything you put into the dashboard.
This blank space is connecting this dashboard to the February 2018 Learning Summit.
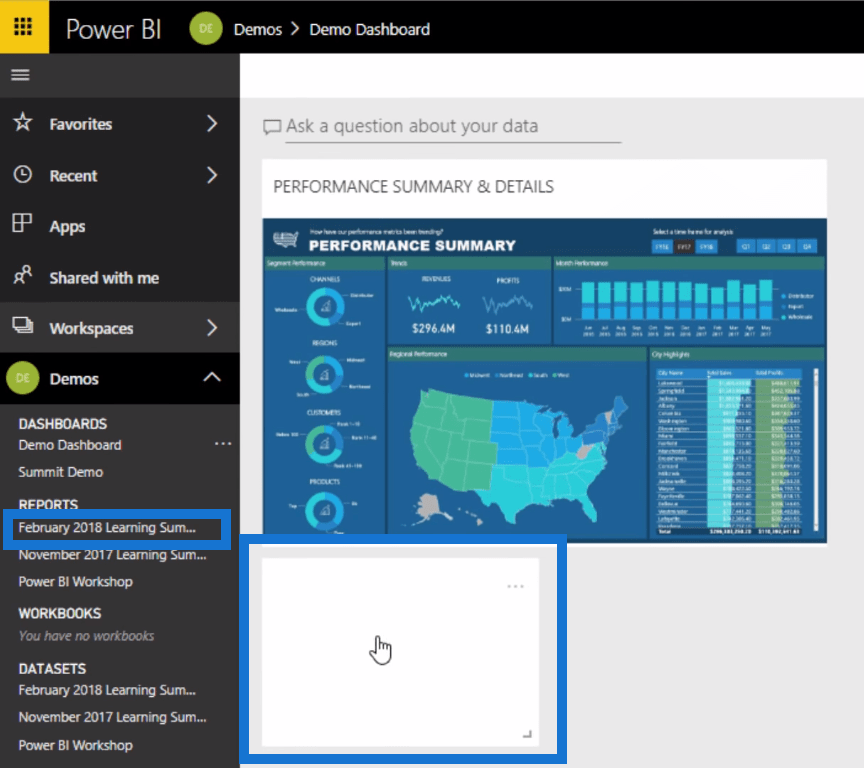
It’s basically a placeholder.
You can type in the search bar show total sales by customer name and it will show the chart or report that corresponds to the search.
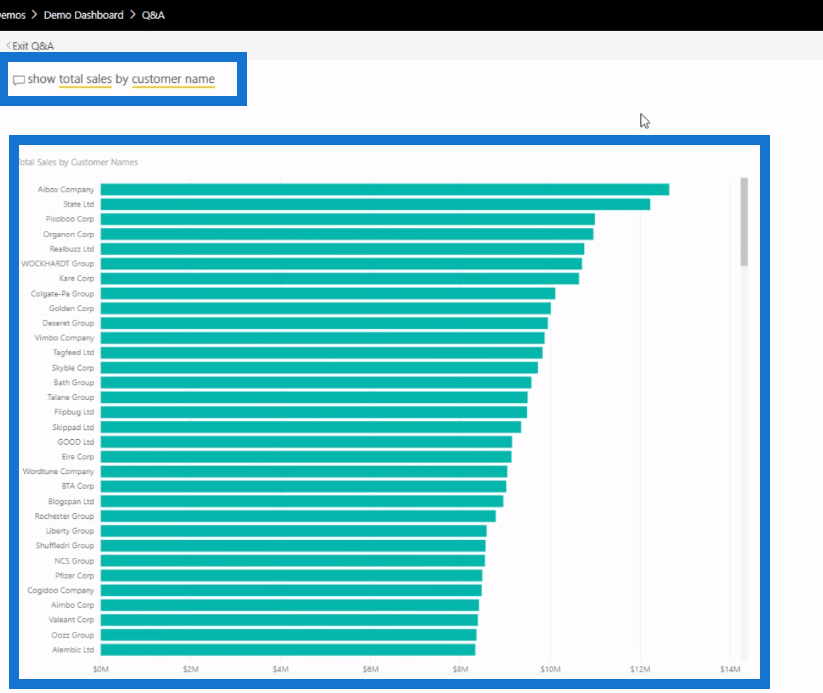
You can write simple things like this and quickly get answers.
Working With Measure Tables
The concept that the Q&A feature doesn’t work with measures that are in measure tables is incorrect. Q&A works with measure tables. Don’t let this misconception stop you from using them because measure tables are essential in Power BI models.
For example, the search query shows total sales by customer name.

You’ll see that it picked up Total Sales which was in the measure table.
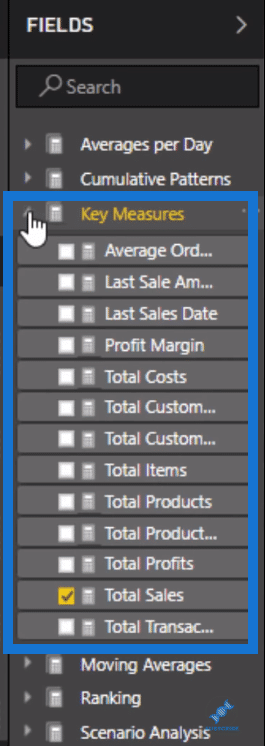
It worked just fine. So, don’t believe when others say it doesn’t work.
Measure groups are essential.
Using Selections In Combination With Q&A
You can add other measures and create any visualization using the selections under the Visualizations and Fields pane located on the right-hand side. All you have to do is write it out and show it.
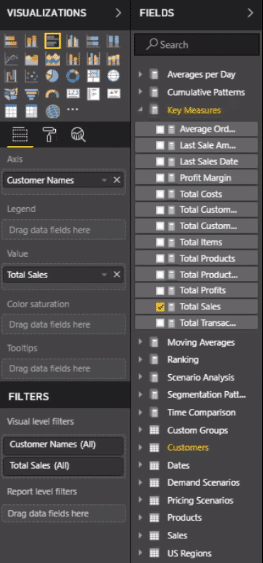
So, let’s show total sales and profits by city name.

You can see that it hasn’t created a very good visualization.
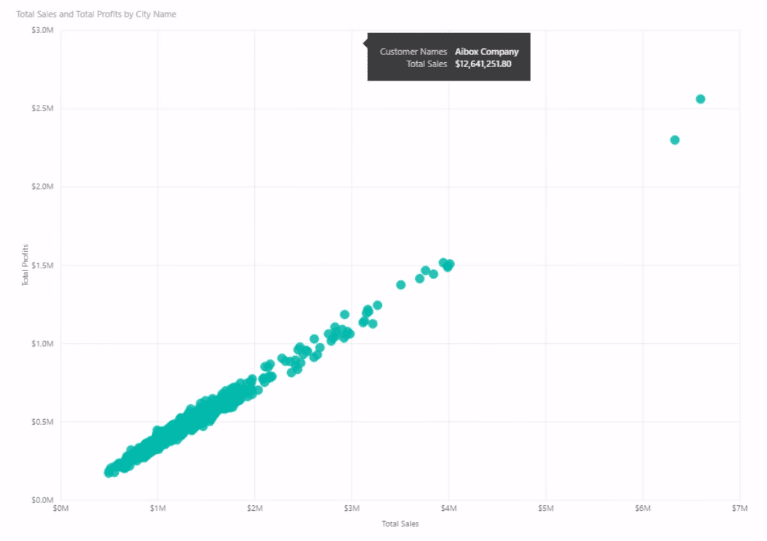
To make it better, you can make a selection under the Visualization pane to change the form of the generated chart.

You’ve always got to use the Q&A feature and the Visualization and Fields pane in combination. This will give you the desired visualization.
Now, the interesting and useful thing about the Q&A feature is that the visualization shown above wasn’t even originally in the report.
So, if a consumer wanted to see this insight, this is how they could do it. They don’t need to be able to get used to the report and how to make changes in it – you can create this option for them using the Q&A feature.
Recreate Reports With Advanced DAX Formulas
Now, let’s have a look at a more advanced example using Q&A in Power BI.
This example is based on what was demonstrated during the Learning Summit. It was a complex example of customer segmentation using advanced DAX formulas.
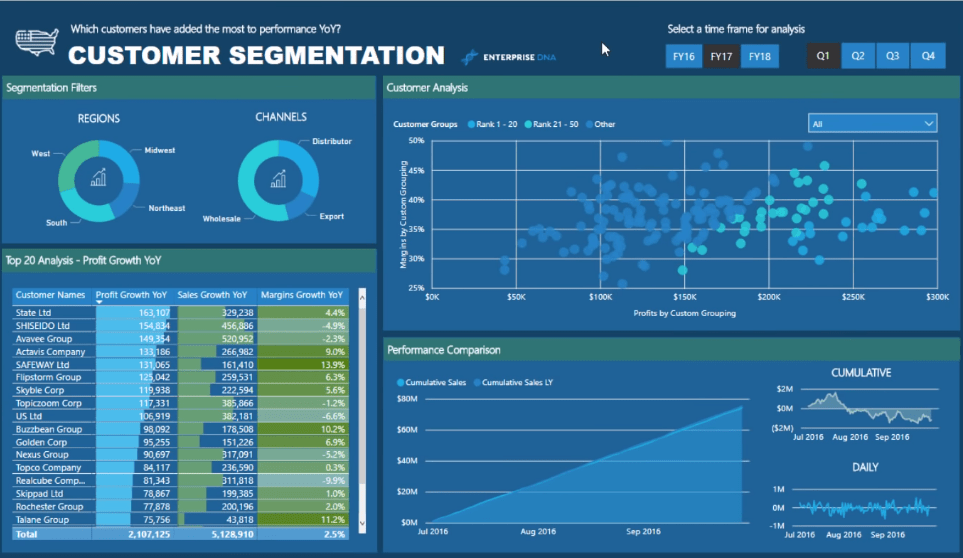

You can actually call these formulas inside the Q&A feature and pull up visualizations that look the same as those inside your Power BI reports.
Even with these advanced formulas, the internal engine inside Power BI is actually going through and doing these calculations based on DAX.
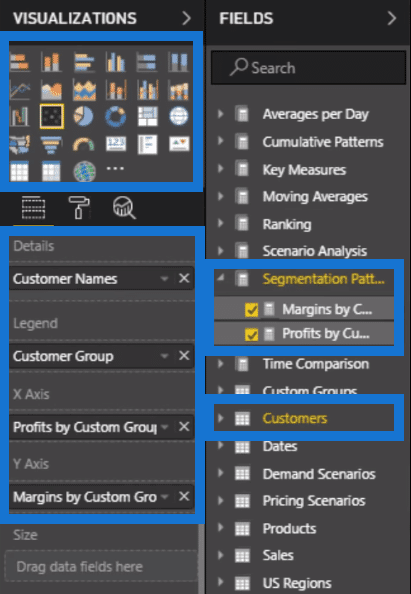
So, let’s show profits by custom grouping versus margins by custom grouping per customer as a scatter chart with legend customer groups.

When you’re able to type the measures correctly, the display will reflect the intensive calculation of the customer segmentation report.
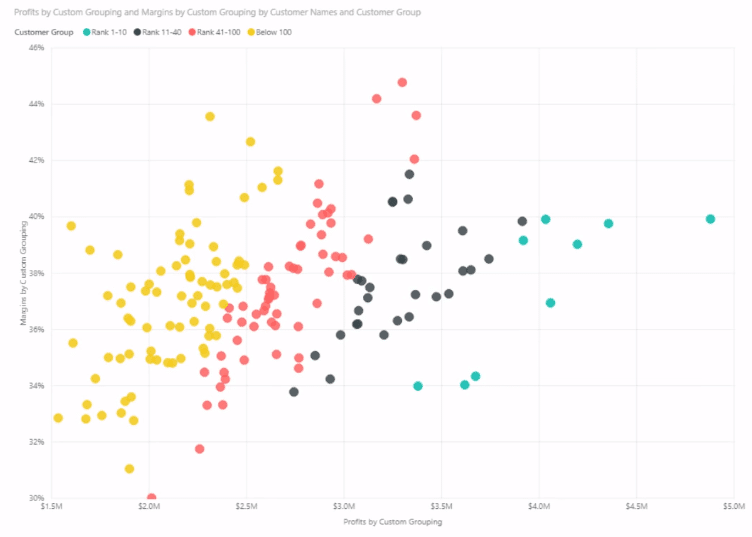
By referencing the measures and the correct filters inside Q&A, you’re able to recreate the report.
You can also see that it has automatically selected the fields on the right-hand side. The segmentation formulas were selected virtually.
Using Q&A To Get Information Quickly
For another example, let’s look at how to create or get information quickly using the Q&A feature.
You can use this even when the information is not in your report. This is especially useful during cases where you want to be able to download or get a piece of information into a format that you can show in the display at any particular moment.
So, let’s type in show in a table total sales, total profits, profit margins per customer where year is 2017.

You can see that it added another element – a Customer Group, which isn’t needed.
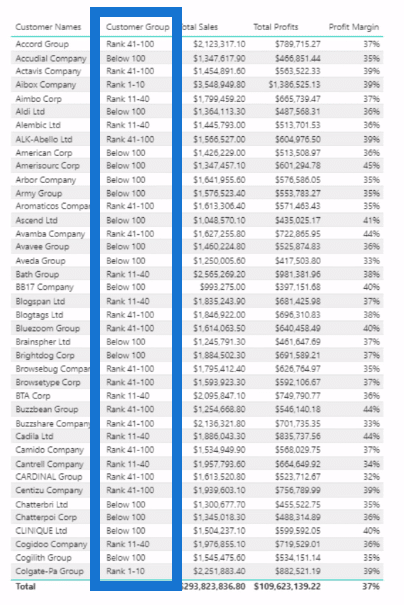
Using the options located on the right-hand side, you can choose to remove it from the generated table.


Using the Q&A feature, you’re able to quickly generate a table containing the required information. You can also change how each column is sorted and arranged.
If you can recall, this wasn’t originally in the customer segmentation report.
So, for instance, when you’re in a meeting, you can instantly generate any report and insight using Q&A. You could pin it to your dashboard so that you can quickly go back and make references there.

This is very useful because you can get insights like this even if they don’t exist inside your current report.
To be able to call upon information and put them into any visualization is only possible if the measures are neatly organized across the different measure groups.
Trial And Error Process During Visualization
Now, do take note that it won’t always work out exactly how you think it will. You may be getting a different visualization, or the wrong filters might have been selected.
But don’t get too worried about it. If you’ve set up your model well, you can easily go and use it in combination with all the different selections available in the Visualizations and Fields pane located at the right-hand side. It’s just a matter of trial and error.
Conclusion
There are many applications for this feature. It’s great for an ad hoc analysis. And in the future, the Q&A could be voice-activated using Cortana in Windows. This could also be integrated into a lot of Microsoft tools, especially in Microsoft Outlook.
Imagine writing an email while needing to include a certain insight. Well, you can simply type this into the Q&A question bar and be able to immediately retrieve an answer.
This Q&A feature could go anywhere within the cloud. It could be incorporated inside Office 365.
If you use it effectively together with well-built models, there’s an exponential potential as to how it can be utilized effectively within your organization.
All the best,
Sam
***** Learning Power BI? *****
FREE COURSE – Ultimate Beginners Guide To Power BI
FREE COURSE – Ultimate Beginners Guide To DAX
FREE – 60 Page DAX Reference Guide Download
FREE – Power BI Resources
Enterprise DNA Membership
Enterprise DNA Online
Enterprise DNA Events

***** Related Links *****
Best Practices In Using The Q&A Feature In Power BI
Natural Language Query – (1.20) Ultimate Beginners Guide To Power BI
How To Organize Your Power BI Data Model – Best Practice Tips
***** Related Course Modules *****
Best Practices & Feature Reviews
Learning Summit Series
Ultimate Beginners Guide To Power BI
***** Related Support Forum Posts *****
Error In Q&A With Year 2000
Q&A Feature – Removing DAX Or Will DAX Stay?
Naming Conventions In BI
For more Q&A support queries to review see here….


